| Excerpt | ||
|---|---|---|
| ||
Added pull requests reports. |
New in this release
View the breakdown of all pull requests with pie chart report.
Keep track of the dynamics of pull requests creation versus merging over time.
Now Awesome Graphs provides two pull requests reports options: Pie Chart Report and Created vs Merged Pull Requests Report.
To generate pull requests reports, navigate to the repository of your choice and choose Pull requests> Reports.
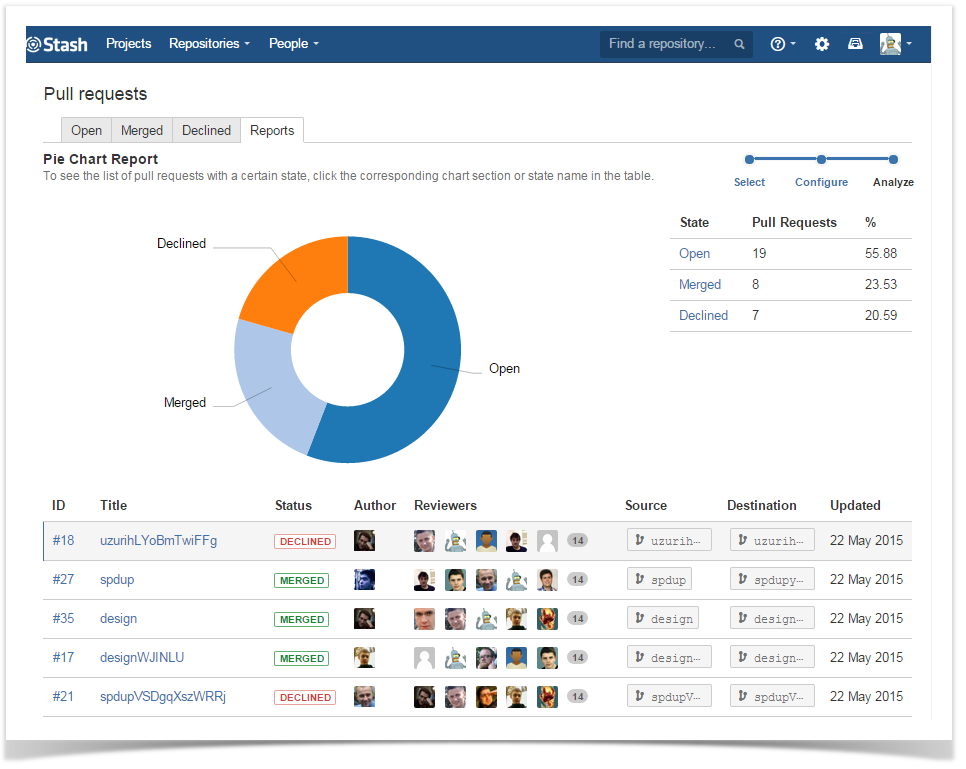
View the breakdown of all pull requests with pie chart report
Pie Chart Report shows a pie chart of pull requests grouped by a specified statistic type. It helps you:
- see the breakdown of a set of pull requests, at a glance
easily find all pull requests with a certain author, reviewer, state or destination branch
Available types of statistic to group pull requests by:
Author
Reviewer
State
Destination
To the right of the pie chart, there is a table showing the number of pull requests that correspond to each author (reviewer, pull request state or destination branch).
Below the pie chart, you can see the table with the details of pull requests. Initially, it includes all pull requests. To see only the details of pull requests with a certain author (reviewer, pull request state or destination branch), click the corresponding chart section or row in the table located to the right of the chart.
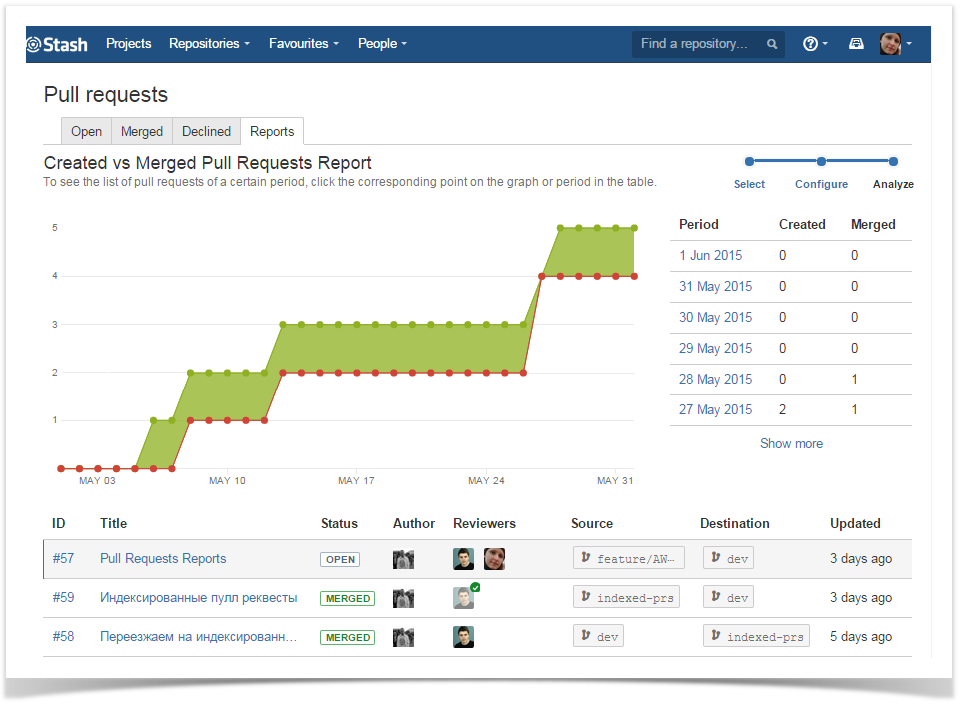
Keep track of the dynamics of pull requests creation versus merging over time
Created vs Merged Pull Requests Report shows the number of pull requests created versus number of pull requests merged over a given period of time. This can help you keep track of the dynamics of your repository development.
Pull requests can be grouped by:
- Days
- Weeks
- Months
- Years
Graphs' areas in red show periods where more pull requests were created than merged. Areas in green show periods where more pull requests were merged than created.
To the right of the graph, there is a table showing the number of created and merged pull requests that correspond to each period.
Below the graph, you can see the table with the details of pull requests. Initially, it includes all pull requests. To see only the details of pull requests until a certain period, click the corresponding point on the graph or row in the table located to the right of the graph.
| Aui button | ||||
|---|---|---|---|---|
|