Download PDF
Download page Bubble Pie chart type.
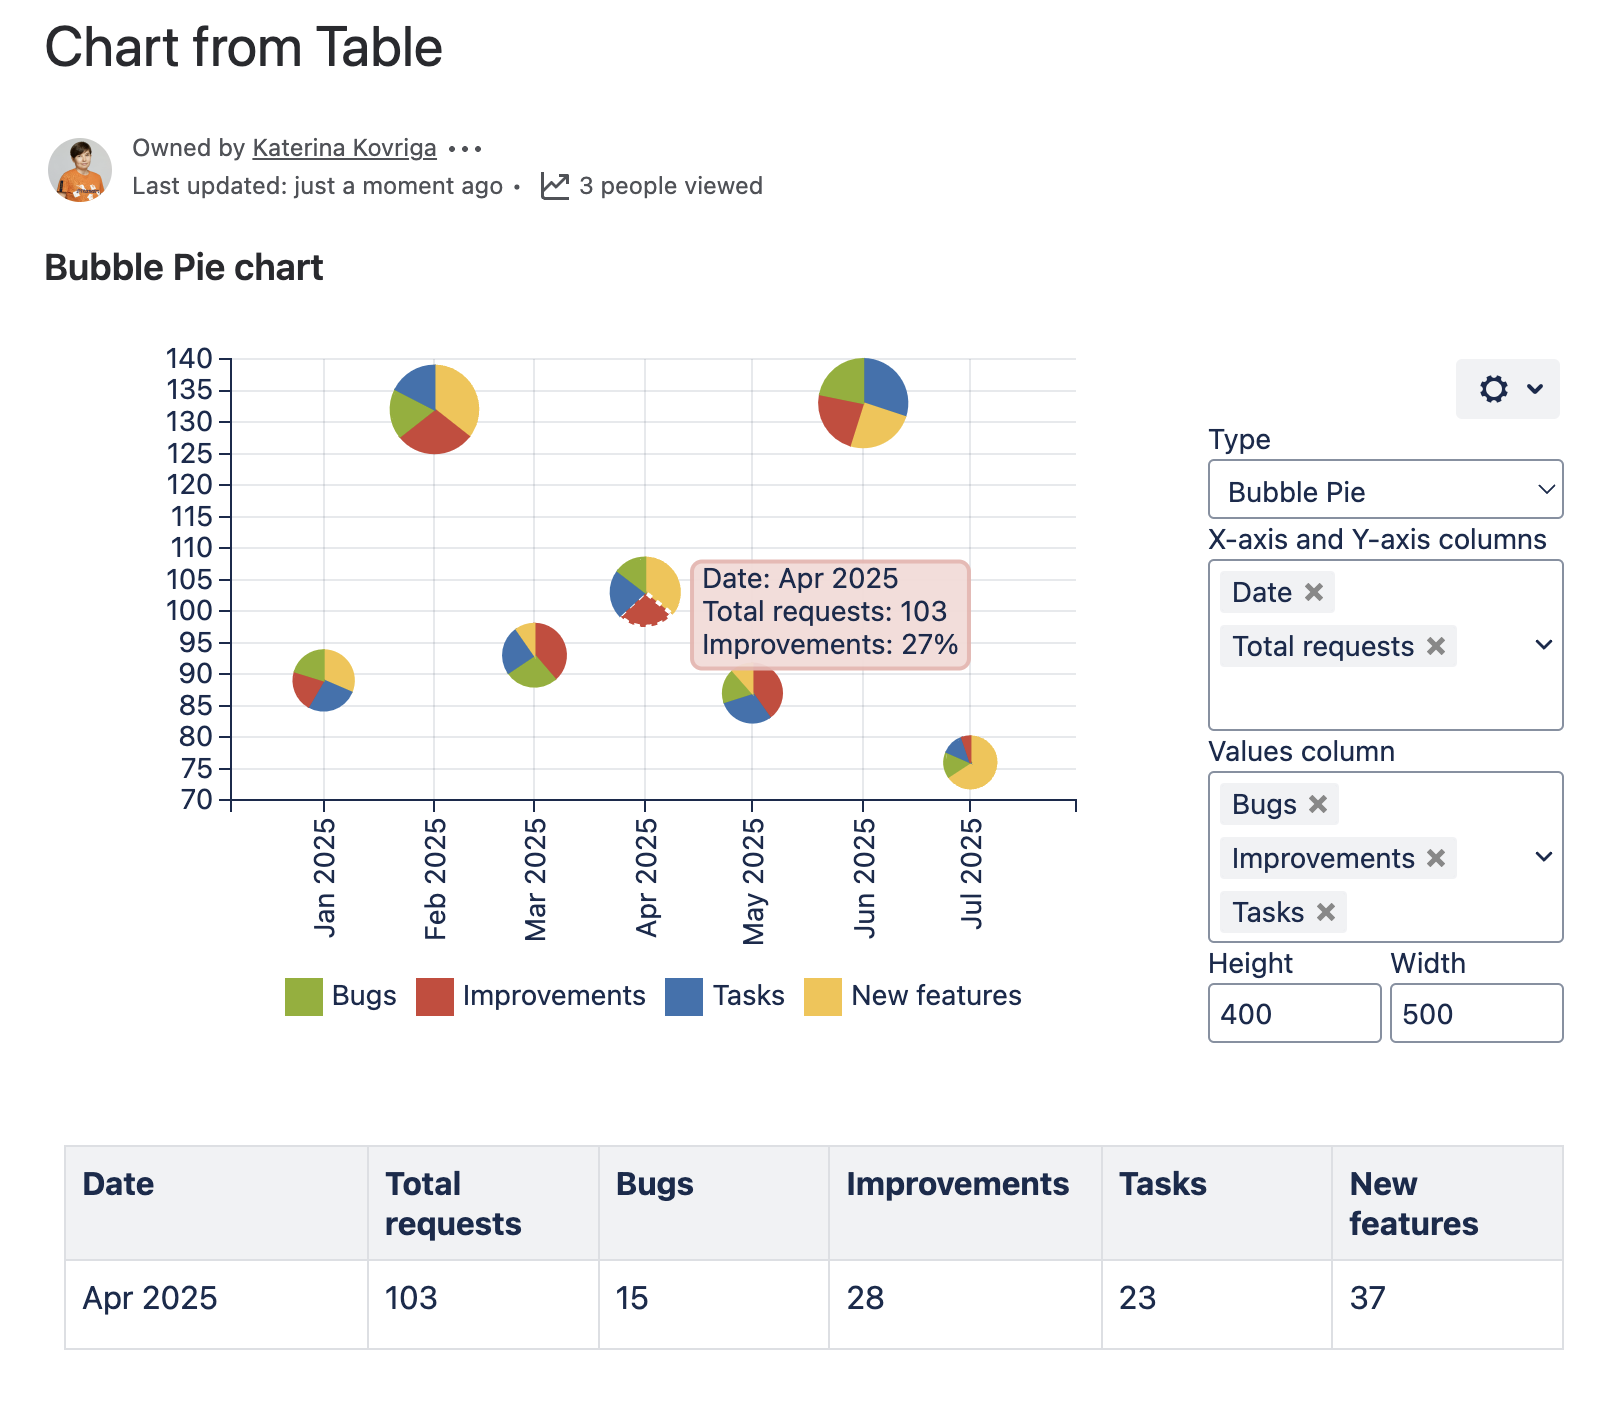
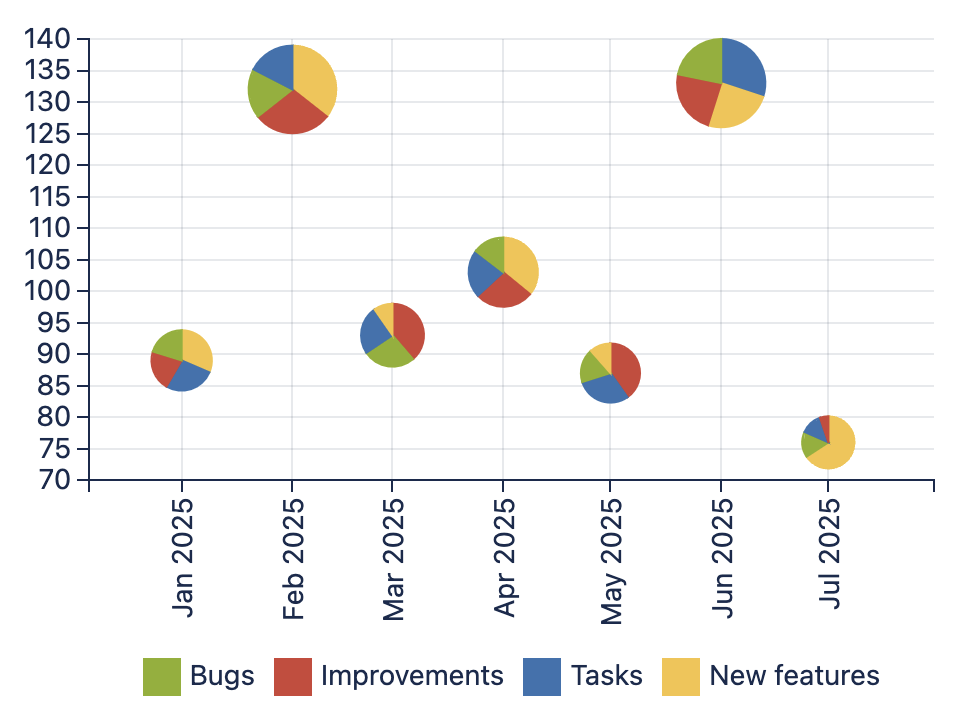
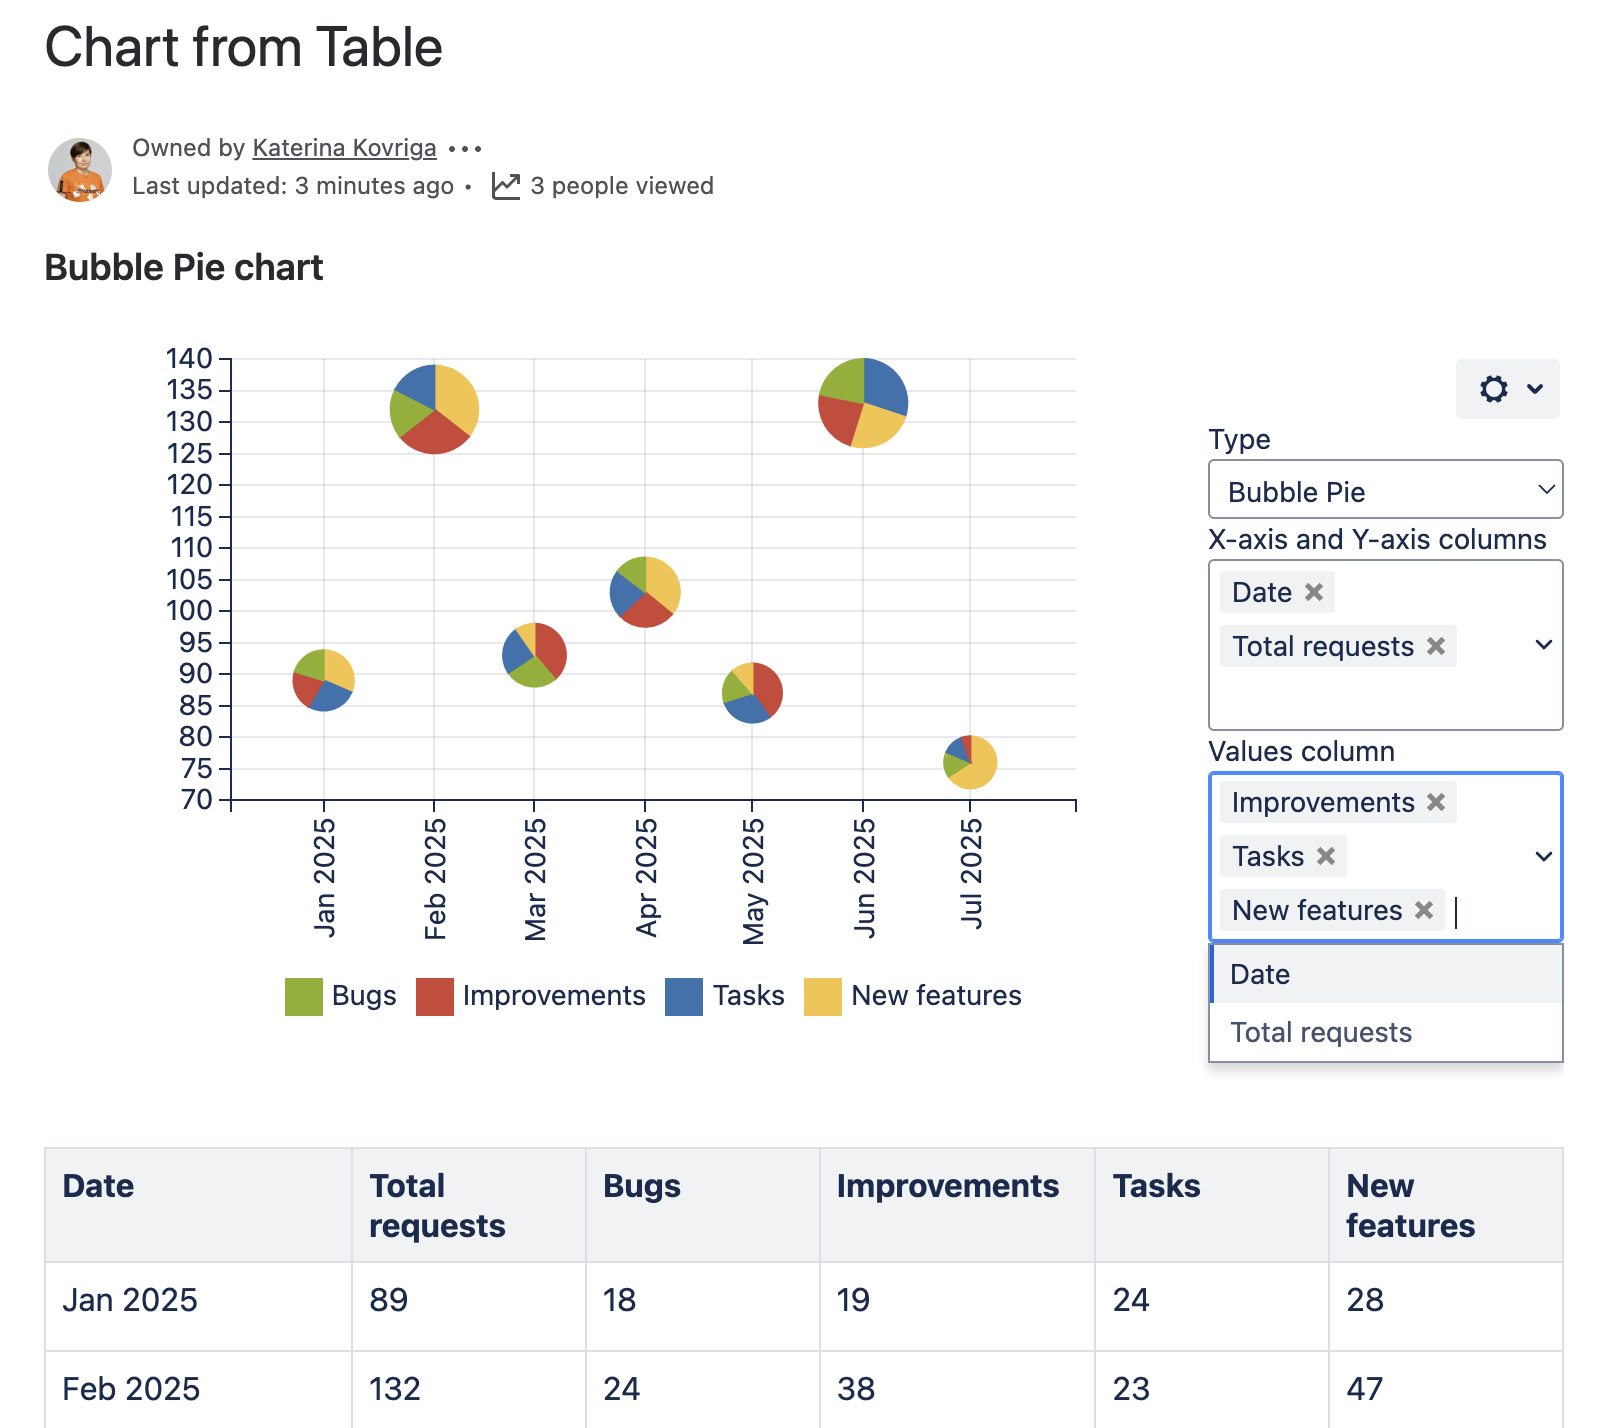
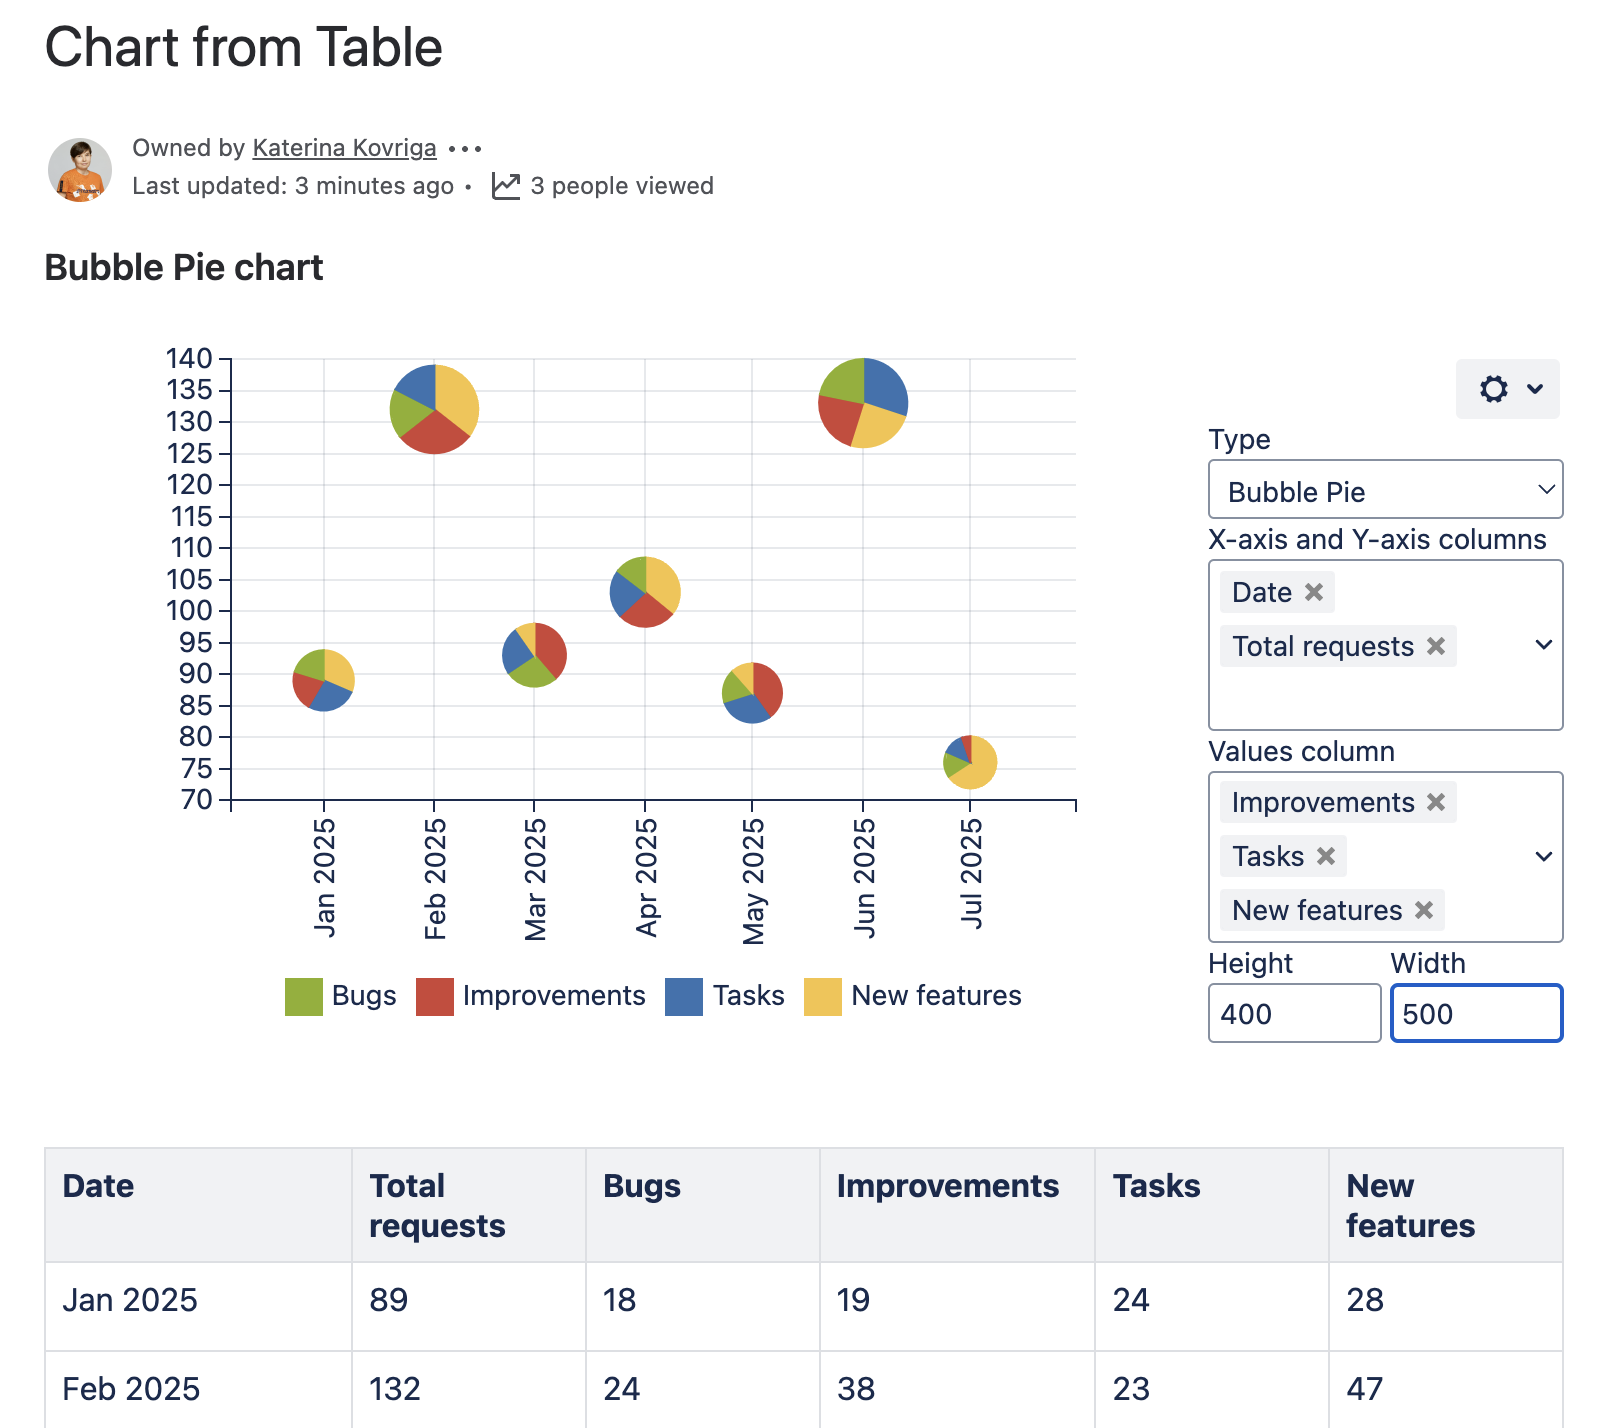
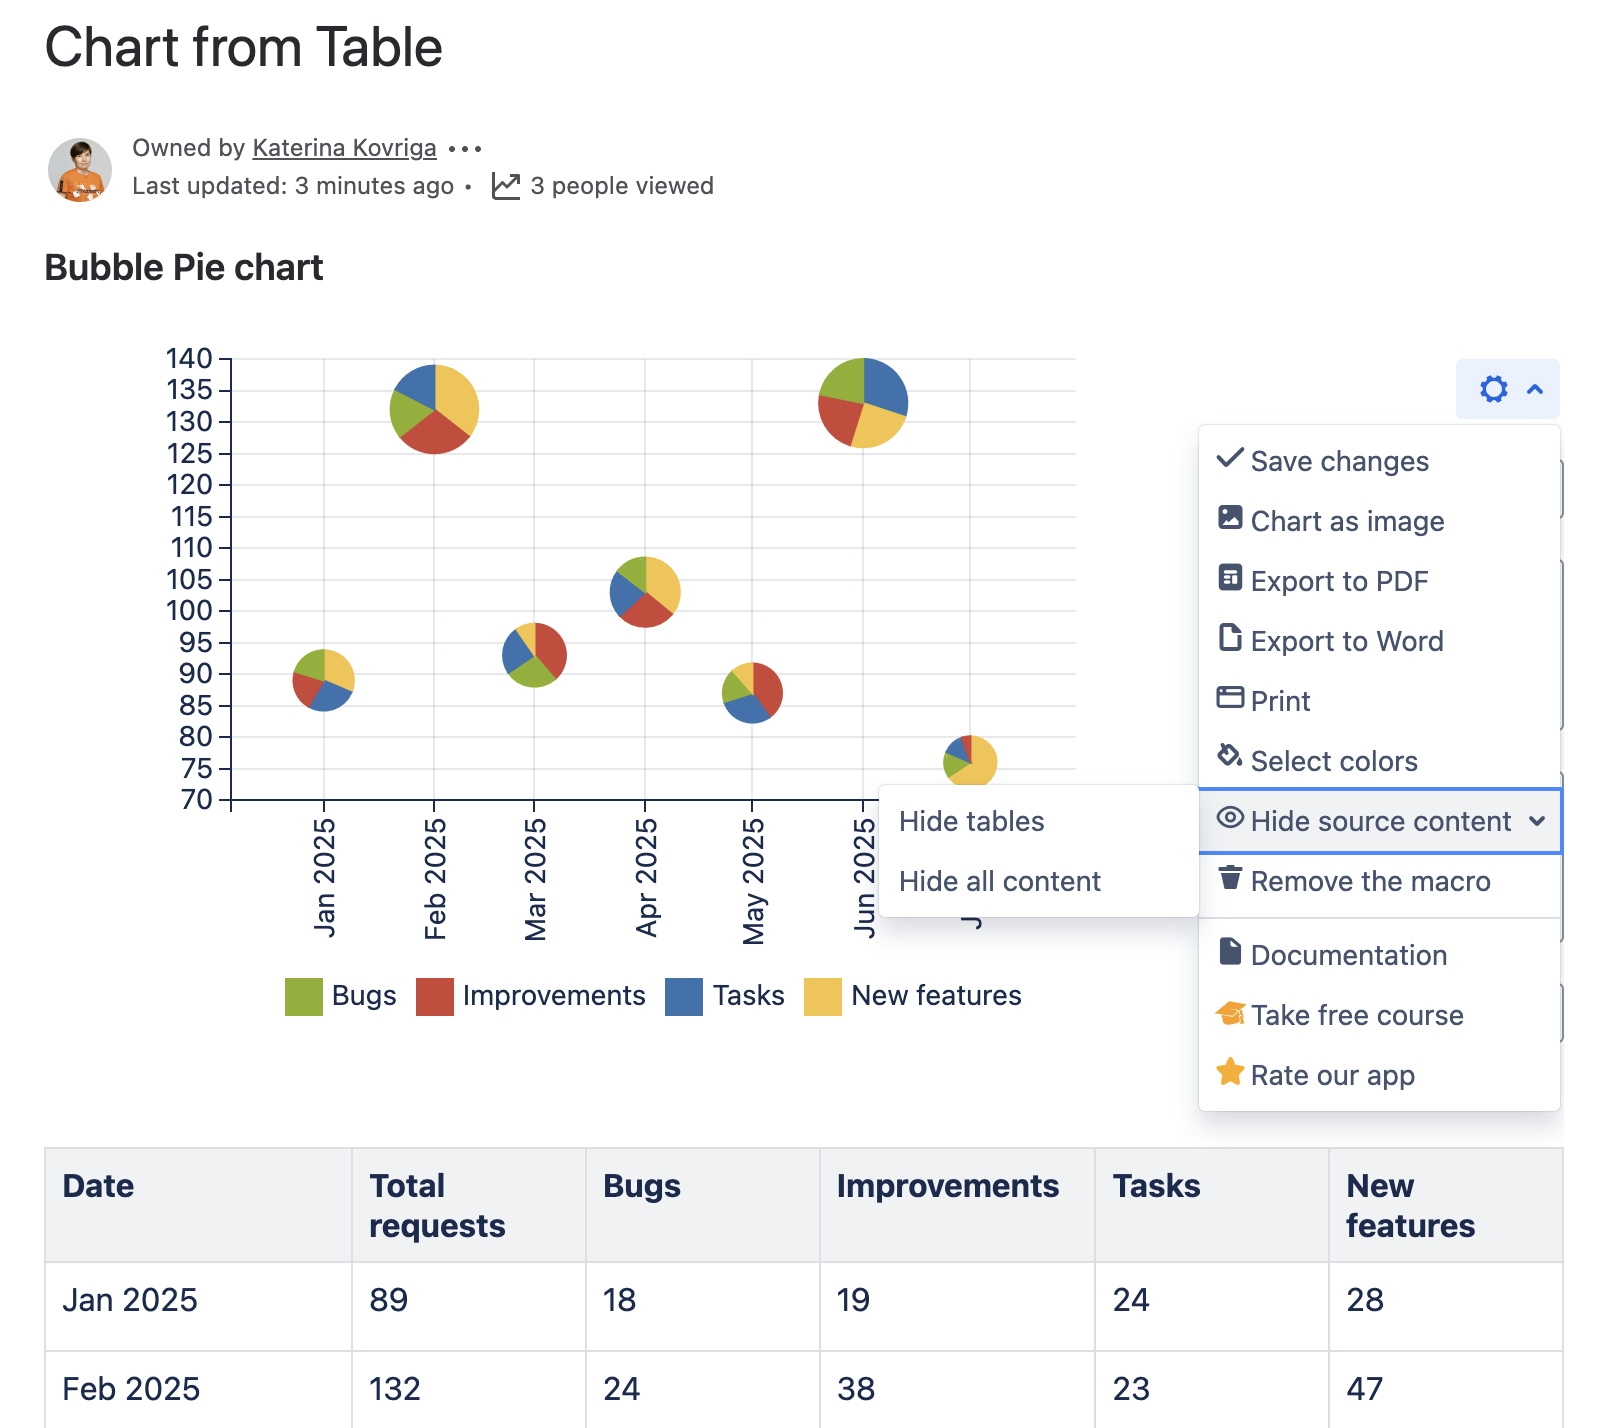
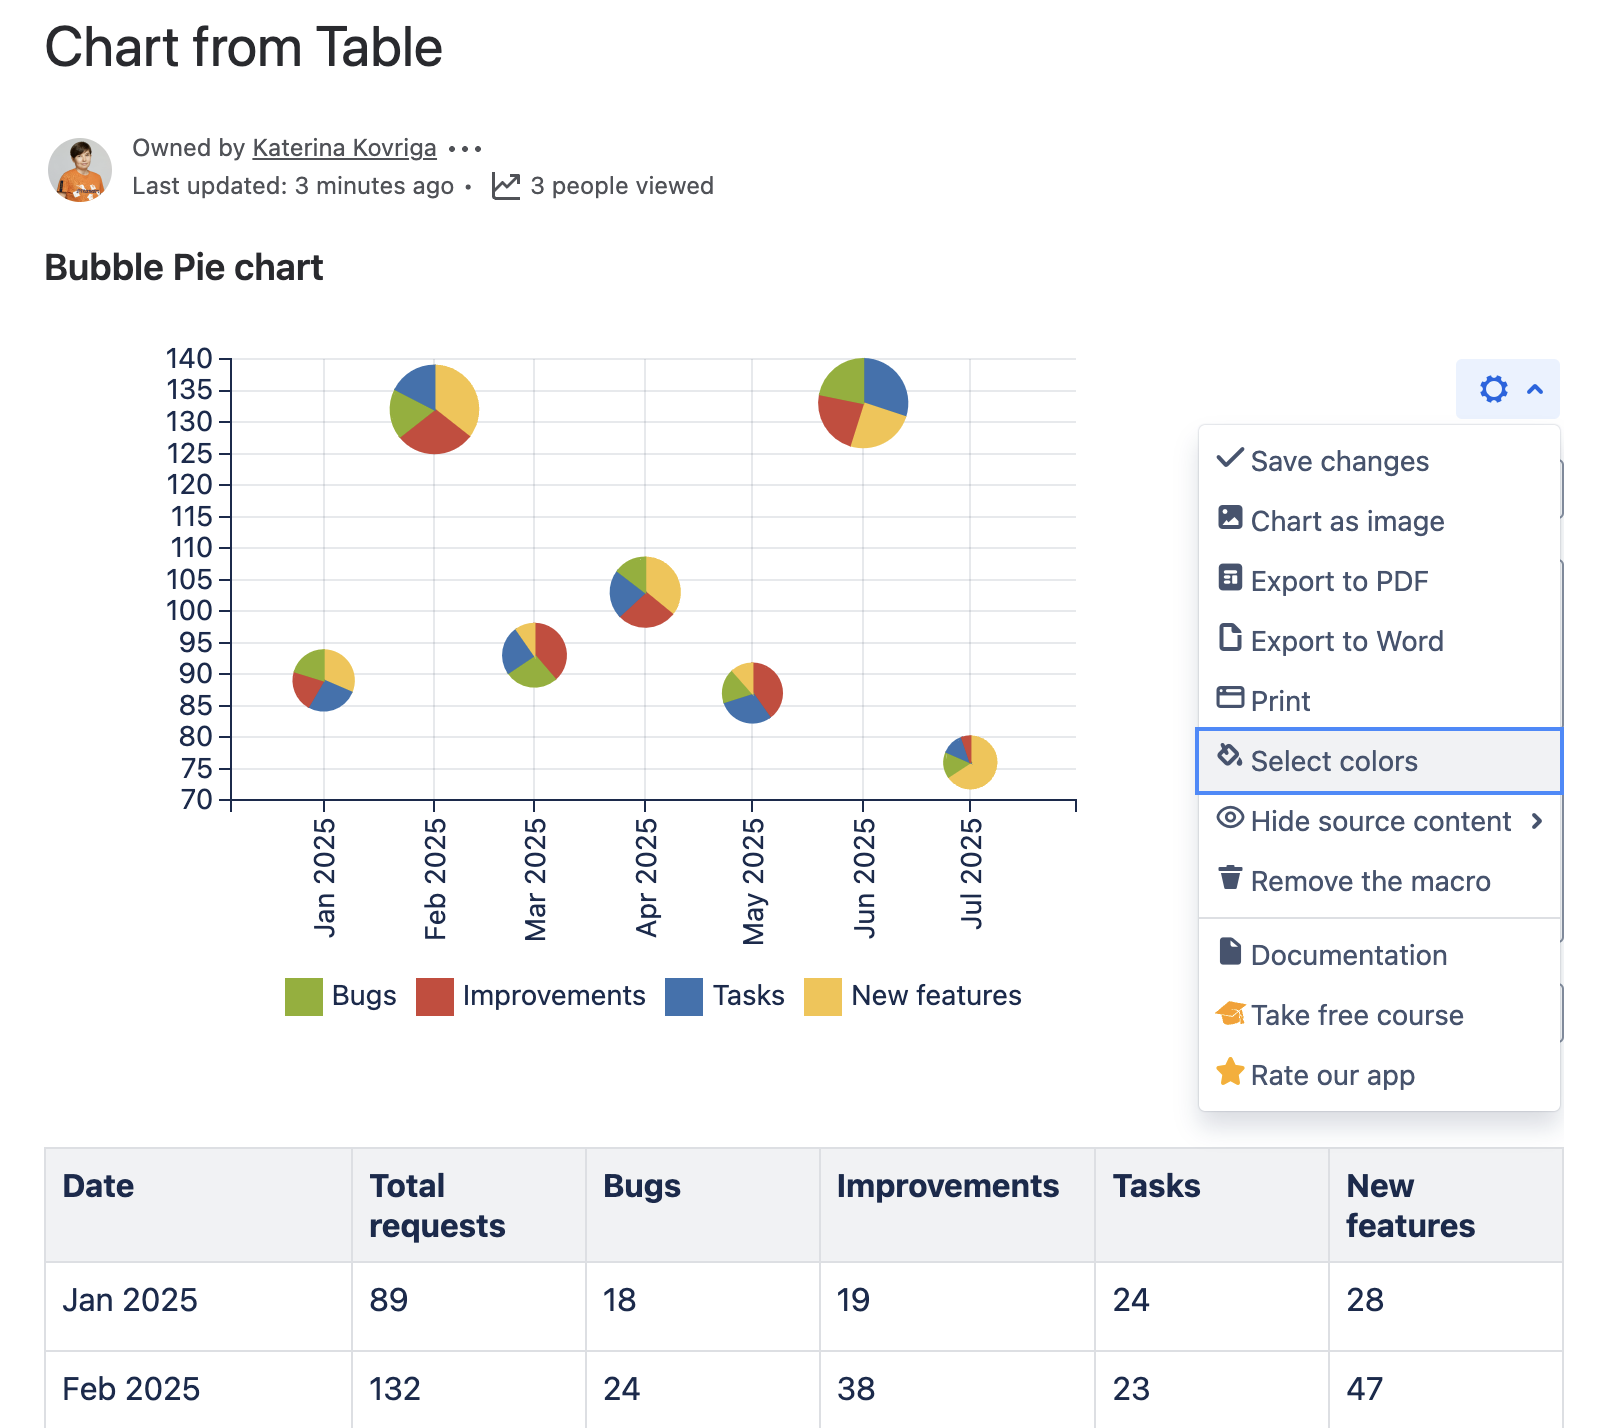
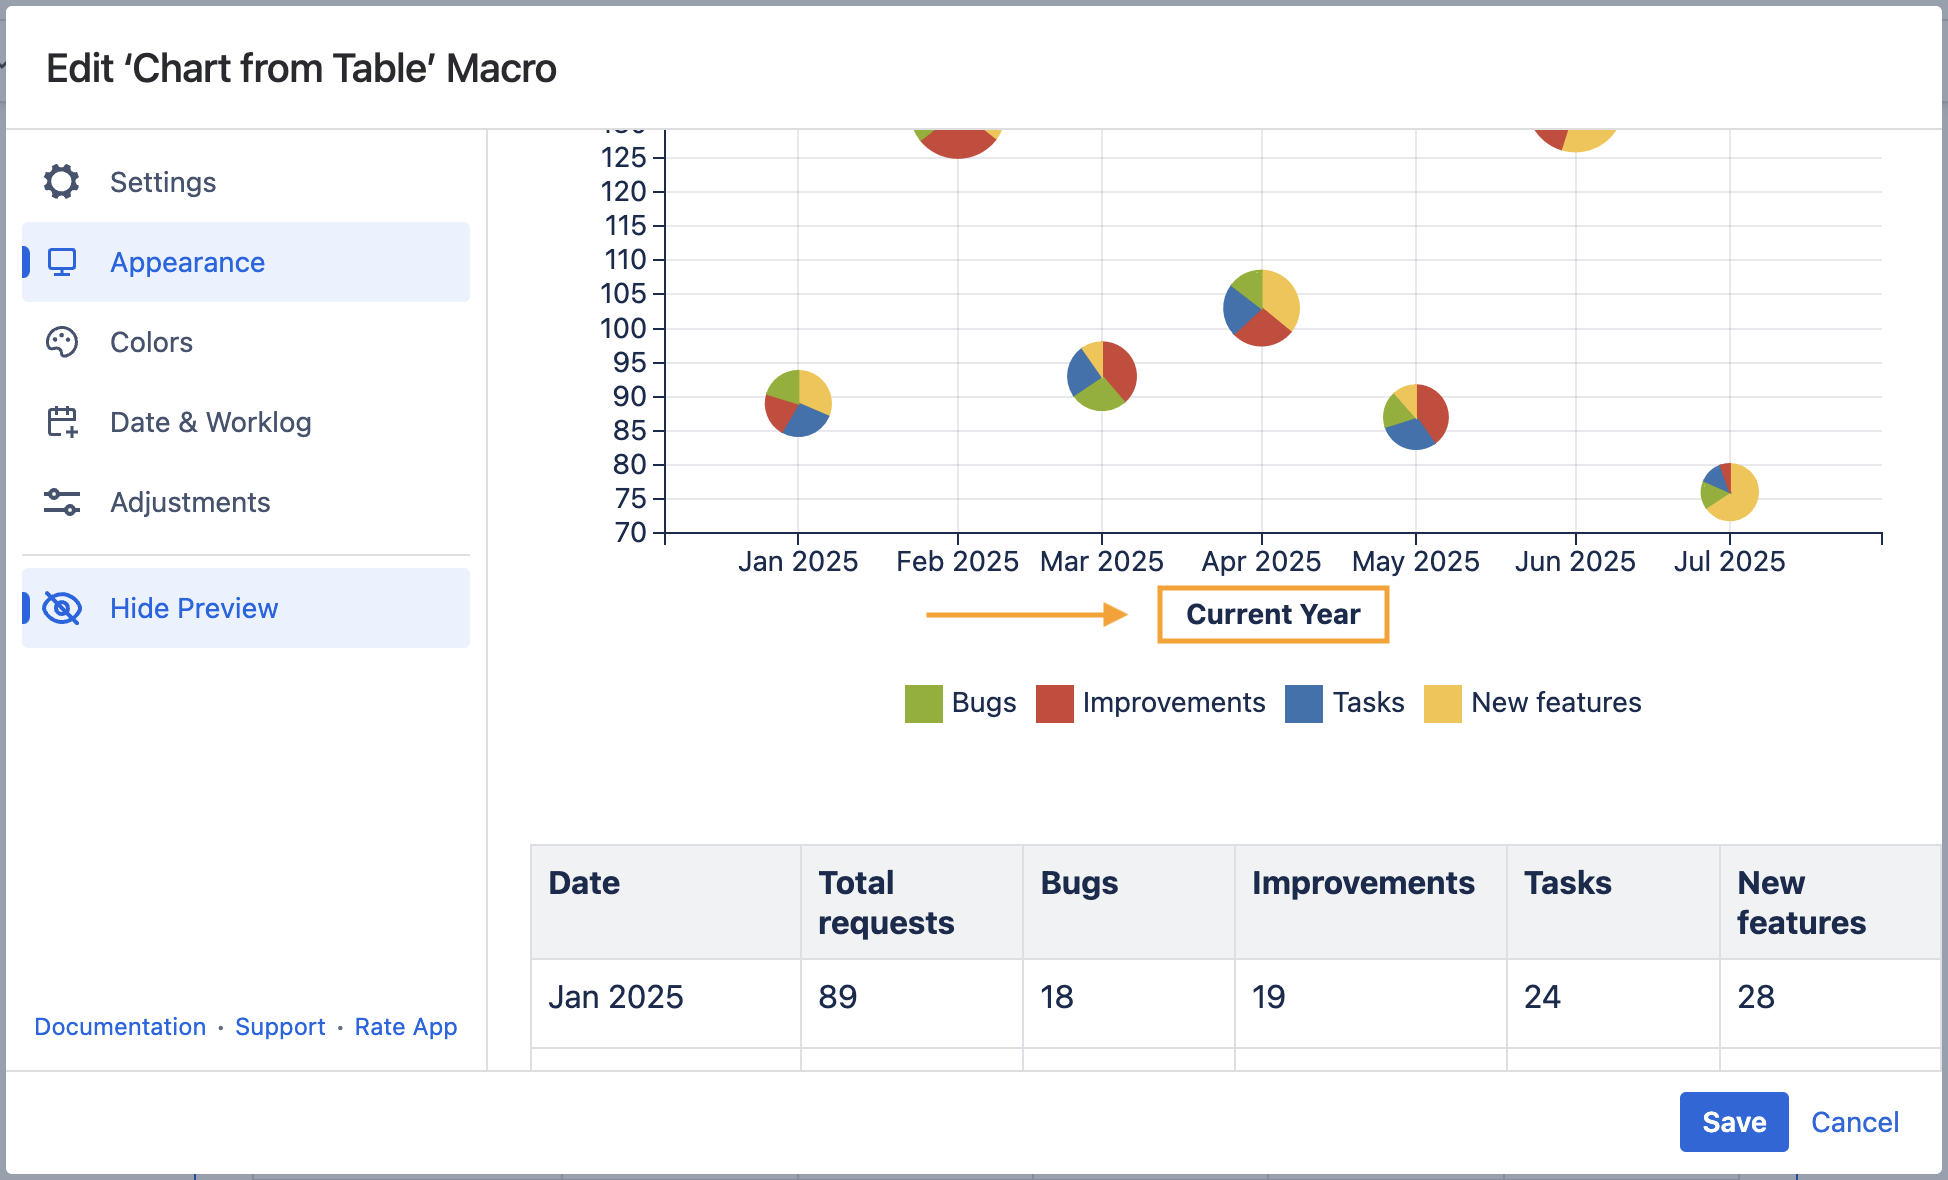
Bubble Pie chart type
Overview
Rendered Chart
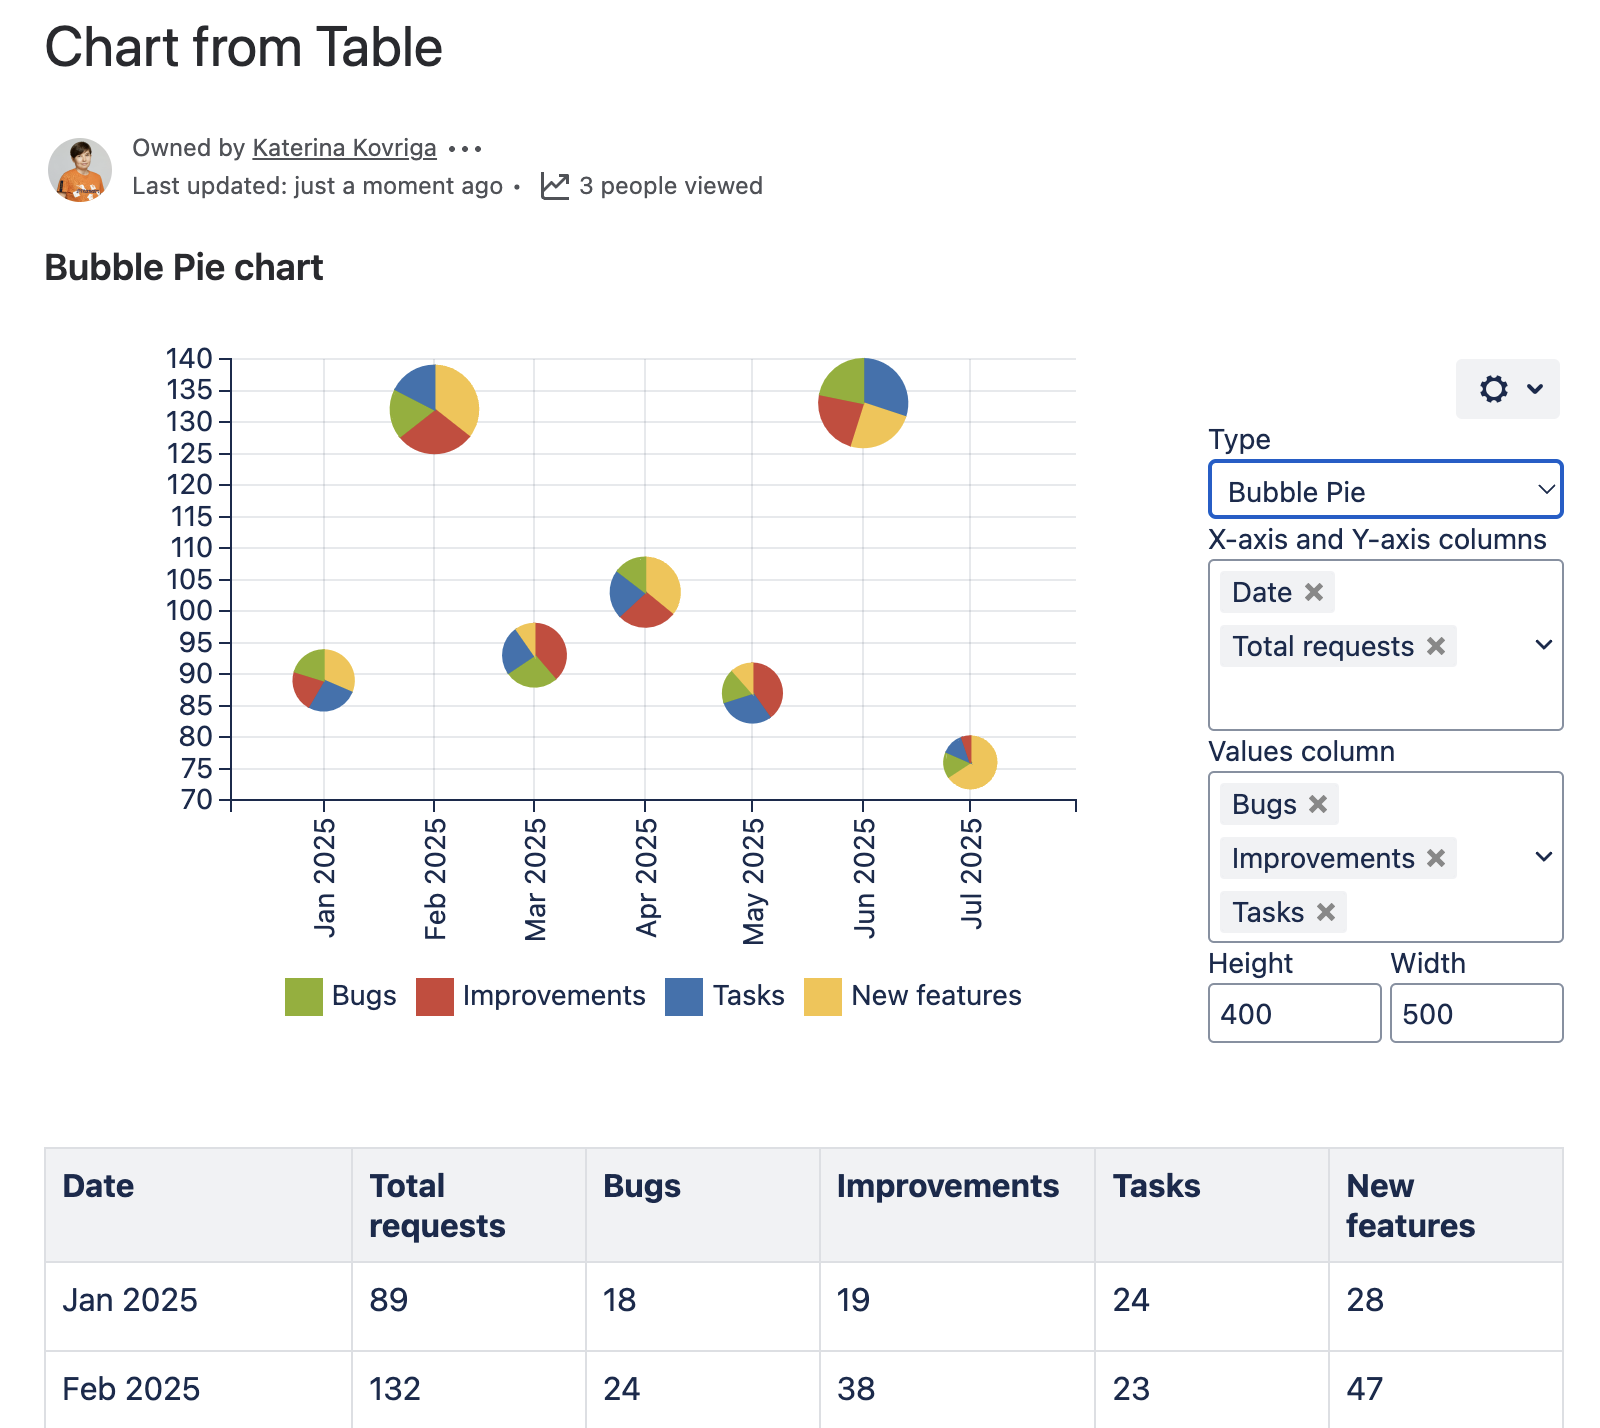
Parameters in Macro Browser
| Type | Bubble Pie |
|---|---|
| X-axis and Y-axis columns | Date, Total requests |
| Values column | Bugs, Improvements, Tasks, New features |
Data Table in Macro Placeholder
Date | Total requests | Bugs | Improvements | Tasks | New features |
|---|---|---|---|---|---|
Jan 2025 | 89 | 18 | 19 | 24 | 28 |
Feb 2025 | 132 | 24 | 38 | 23 | 47 |
Mar 2025 | 93 | 25 | 36 | 23 | 9 |
Apr 2025 | 103 | 15 | 28 | 23 | 37 |
May 2025 | 87 | 16 | 35 | 26 | 10 |
Jun 2025 | 133 | 29 | 31 | 40 | 33 |
Jul 2025 | 76 | 12 | 4 | 10 | 50 |
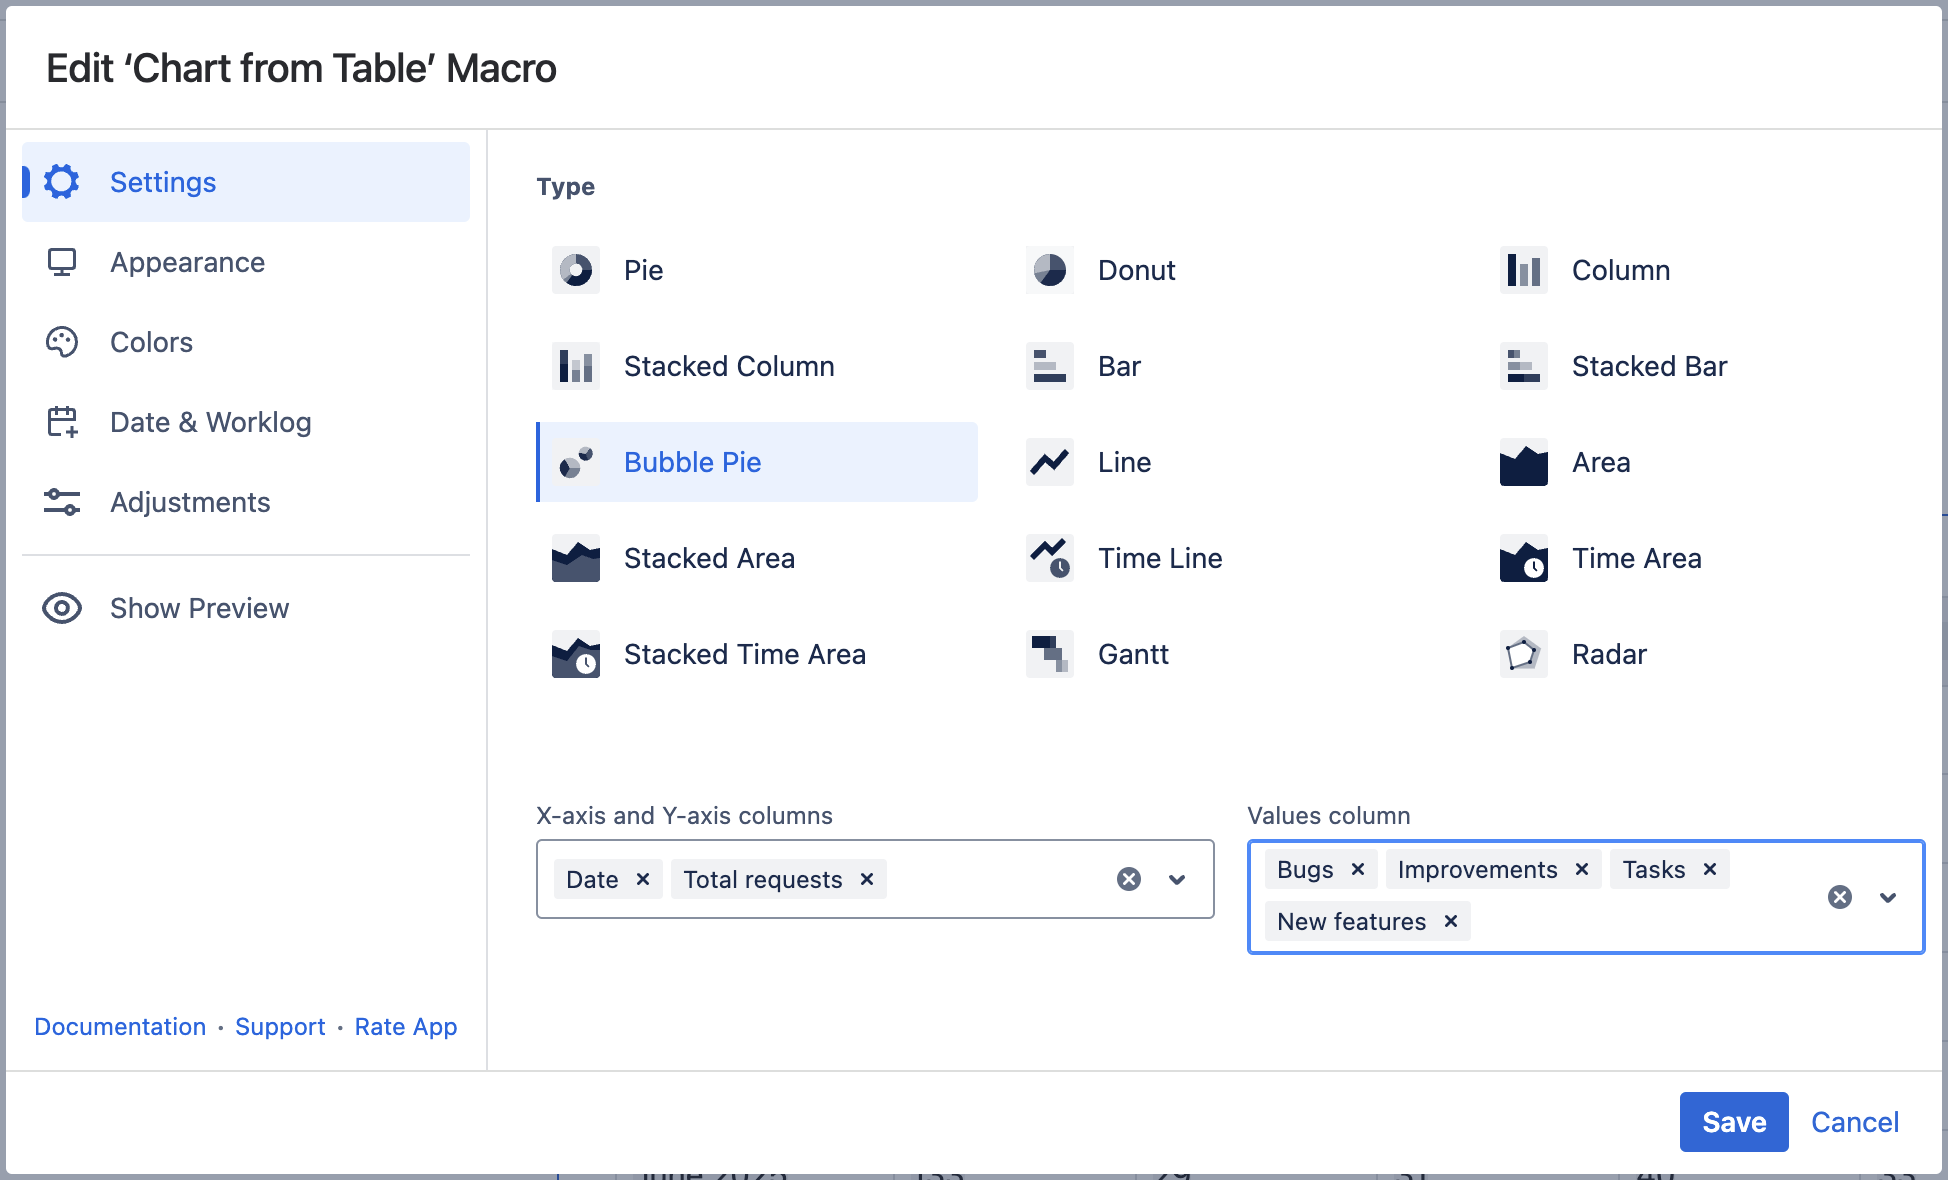
Settings Tab
Select the chart type
To select the chart type in the page view mode:
- Insert the Chart from Table macro.
- Hover over the chart controls on the right of the table.
- Locate the Type option and select the chart type. The chart will be automatically regenerated.
- To save the modifications in the macro body, click the cogwheel icon and select Save changes.
To select the chart type in the macro browser:
- Switch the page to the edit mode.
- Insert the Chart from Table macro and paste the table within the macro body.
- Select the macro and click Edit.
- Locate the Type option in the Settings tab and select the chart type.
- Save the macro and the page.
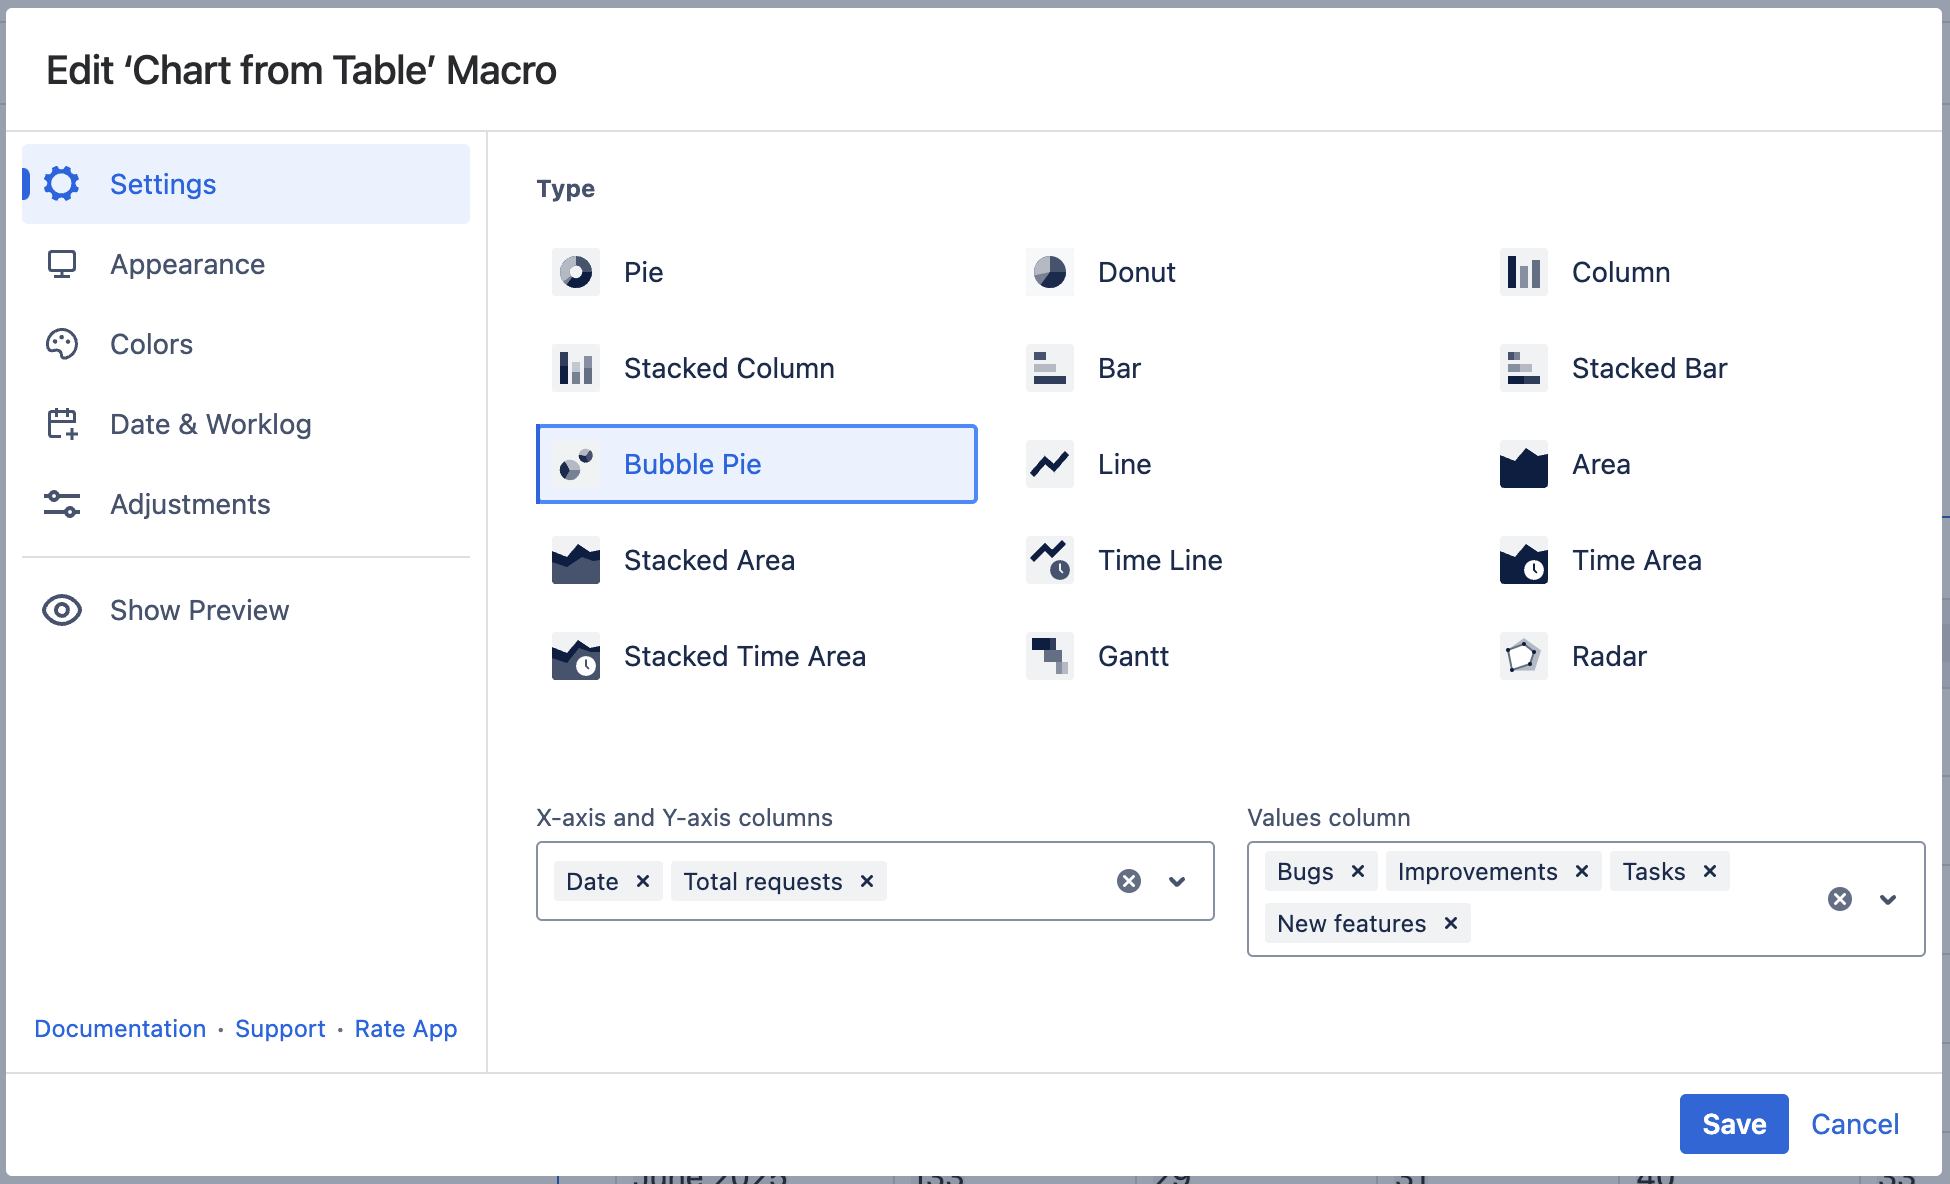
Select data series
X-axis and Y-axis columns - the columns containing numerical values or dates for chart generation (horizontal and vertical axis).
Values column - the column or columns containing numerical values for Pie chart generation.
To select data series in the page view mode:
- Insert the Chart from Table macro.
- Hove over the chart controls on the right of the table.
- Locate the X-axis and Y-axis columns, Values column options and select the table columns containing data for chart generation. The chart will be automatically regenerated.
- To save the modifications in the macro body, click the cogwheel icon and select Save changes.
To select data series in the macro browser:
- Switch the page to the edit mode.
- Insert the Chart from Table macro and paste the table within the macro body.
- Select the macro and click Edit.
- Locate the X-axis and Y-axis columns, Values column options in the Settings tab and select the table columns containing data for chart generation.
- Save the macro and the page.
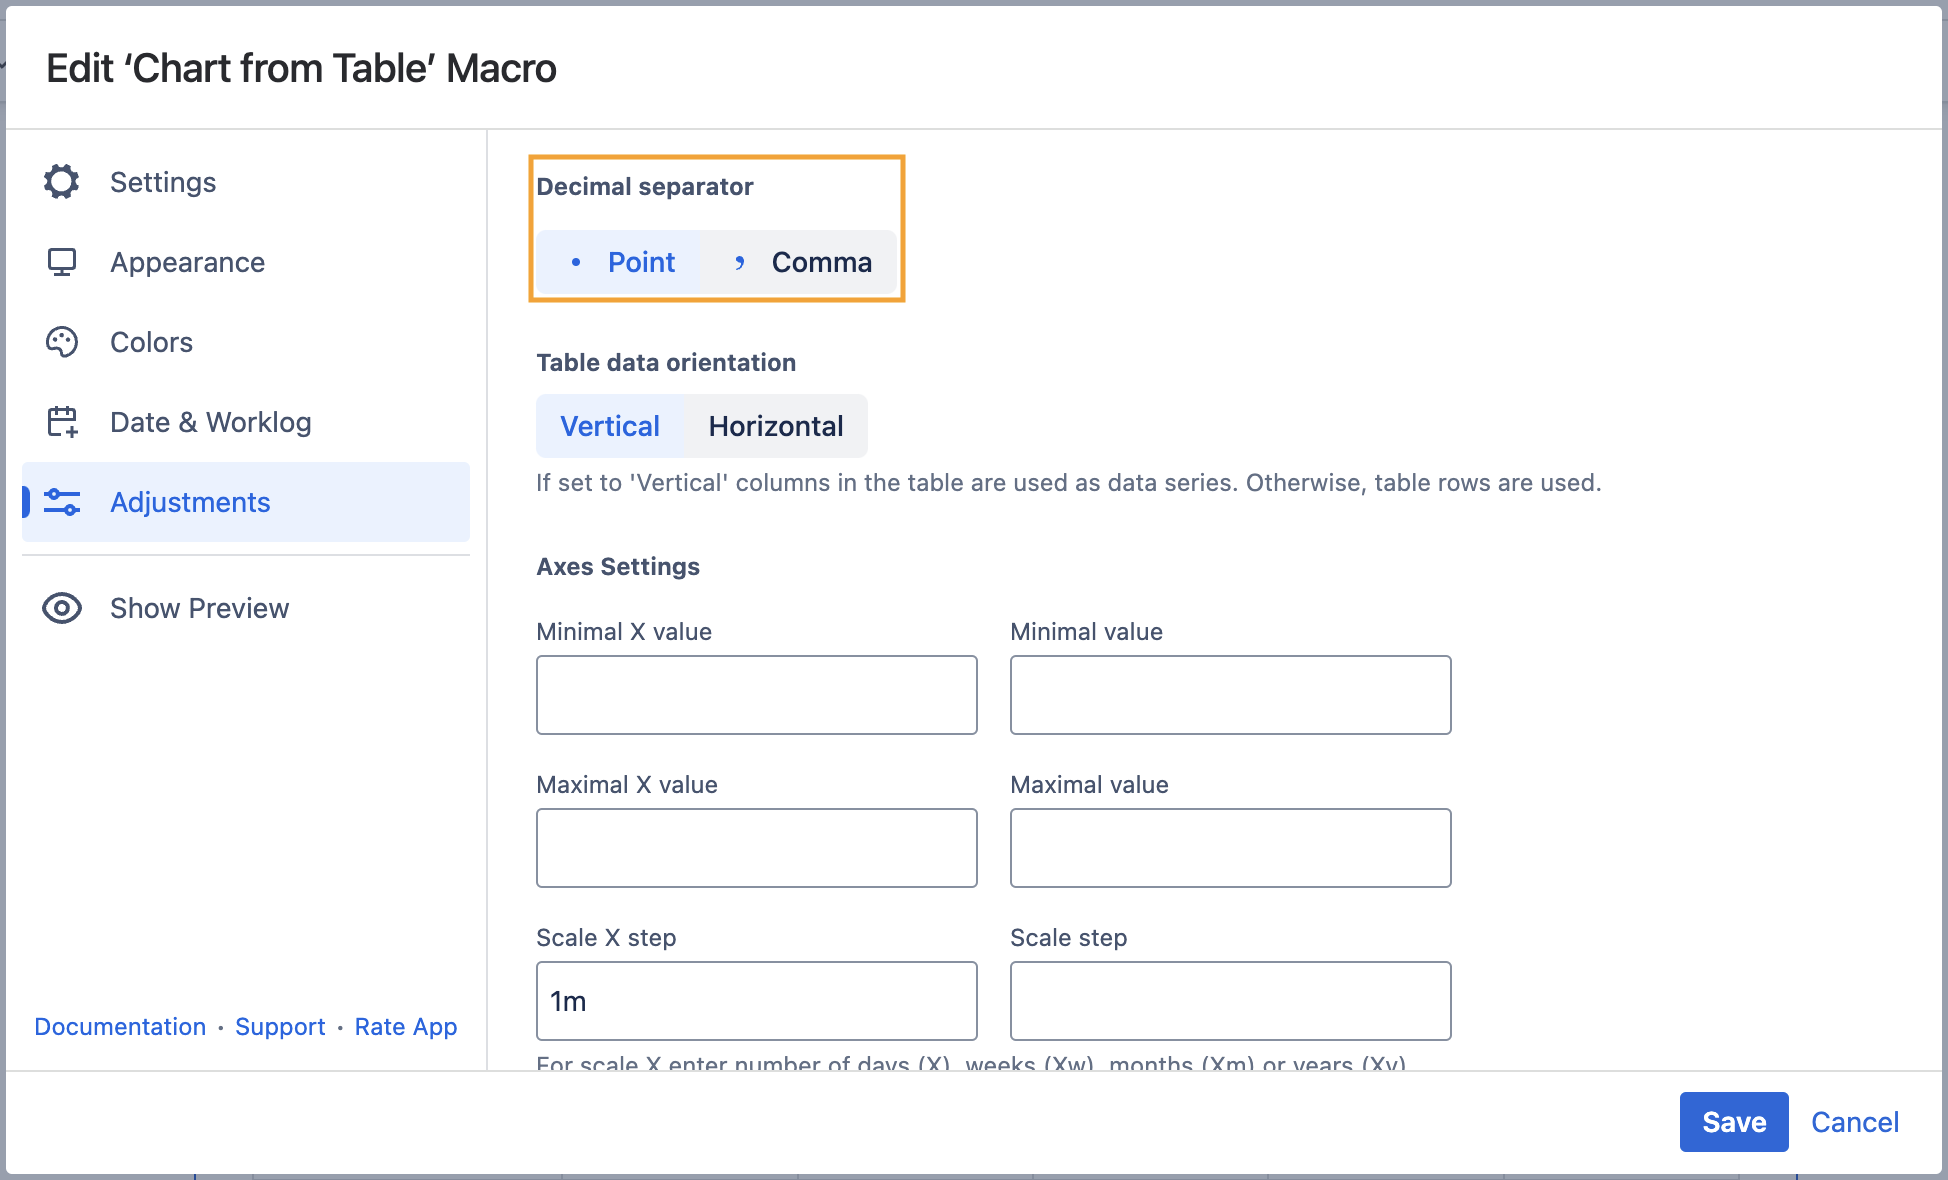
Adjustments Tab
Set the decimal separator
- Switch the page to the edit mode.
- Select the macro and click Edit.
- Switch to the Adjustments tab.
- Locate the Decimal separator option.
- Specify the correct decimal separator for numeric values in the source table (point or comma).
- Save the macro and the page.
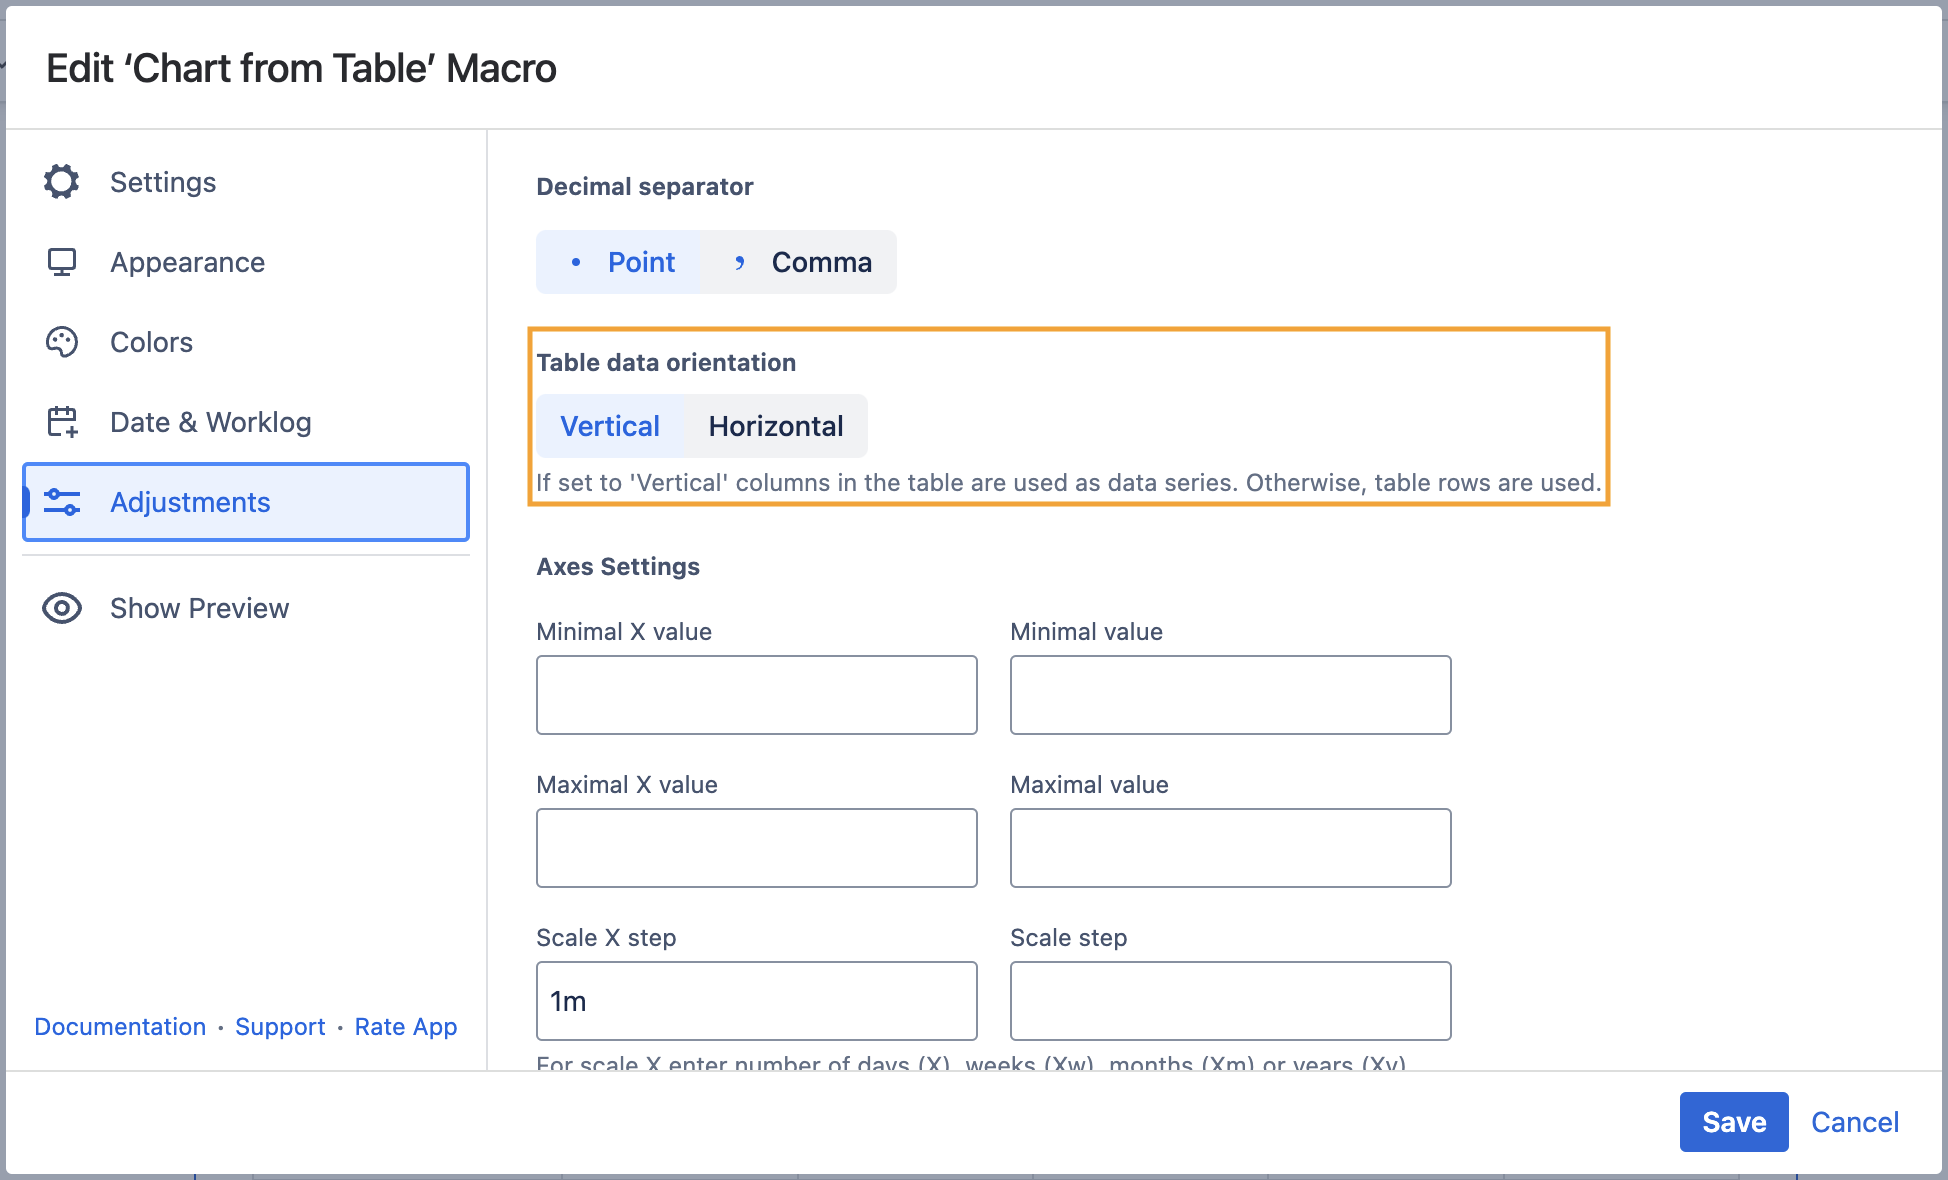
Set the table data orientation
- Switch the page to the edit mode.
- Select the macro and click Edit.
- Switch to the Adjustments tab.
- Locate the Table data orientation option.
- Select the Vertical or Horizontal option.
- Save the macro and the page.
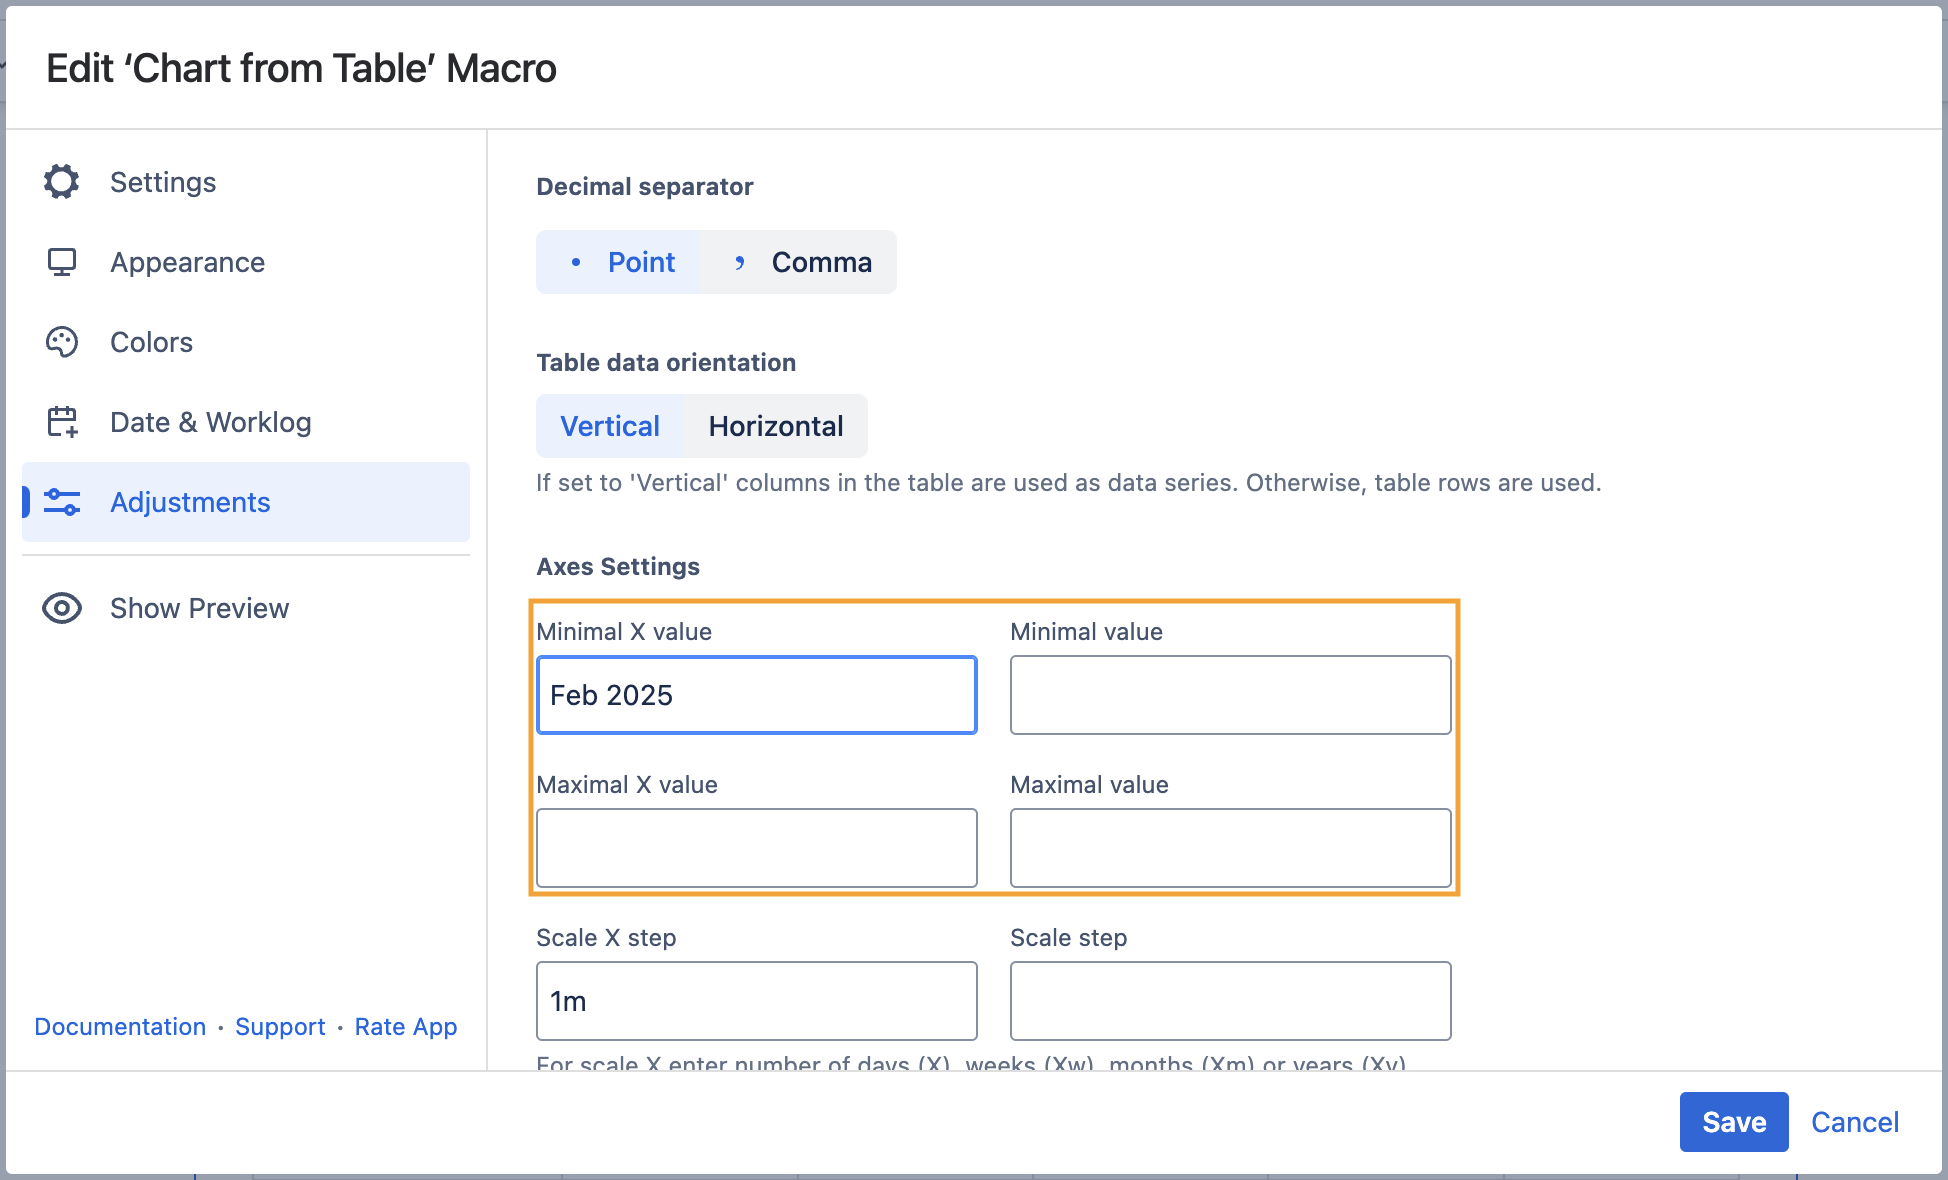
Set the minimal and maximal values
Minimal (X) value - the minimal value for showing only data values greater than the specified minimal value.
Maximal (X) value - You can specify the maximal value for showing only data values not greater than the specified maximal value.
- Switch the page to the edit mode.
- Select the macro and click Edit.
- Switch to the Adjustments tab.
- Locate the Minimal (X) and Maximal (X) value options and set the values.
- Save the macro and the page.
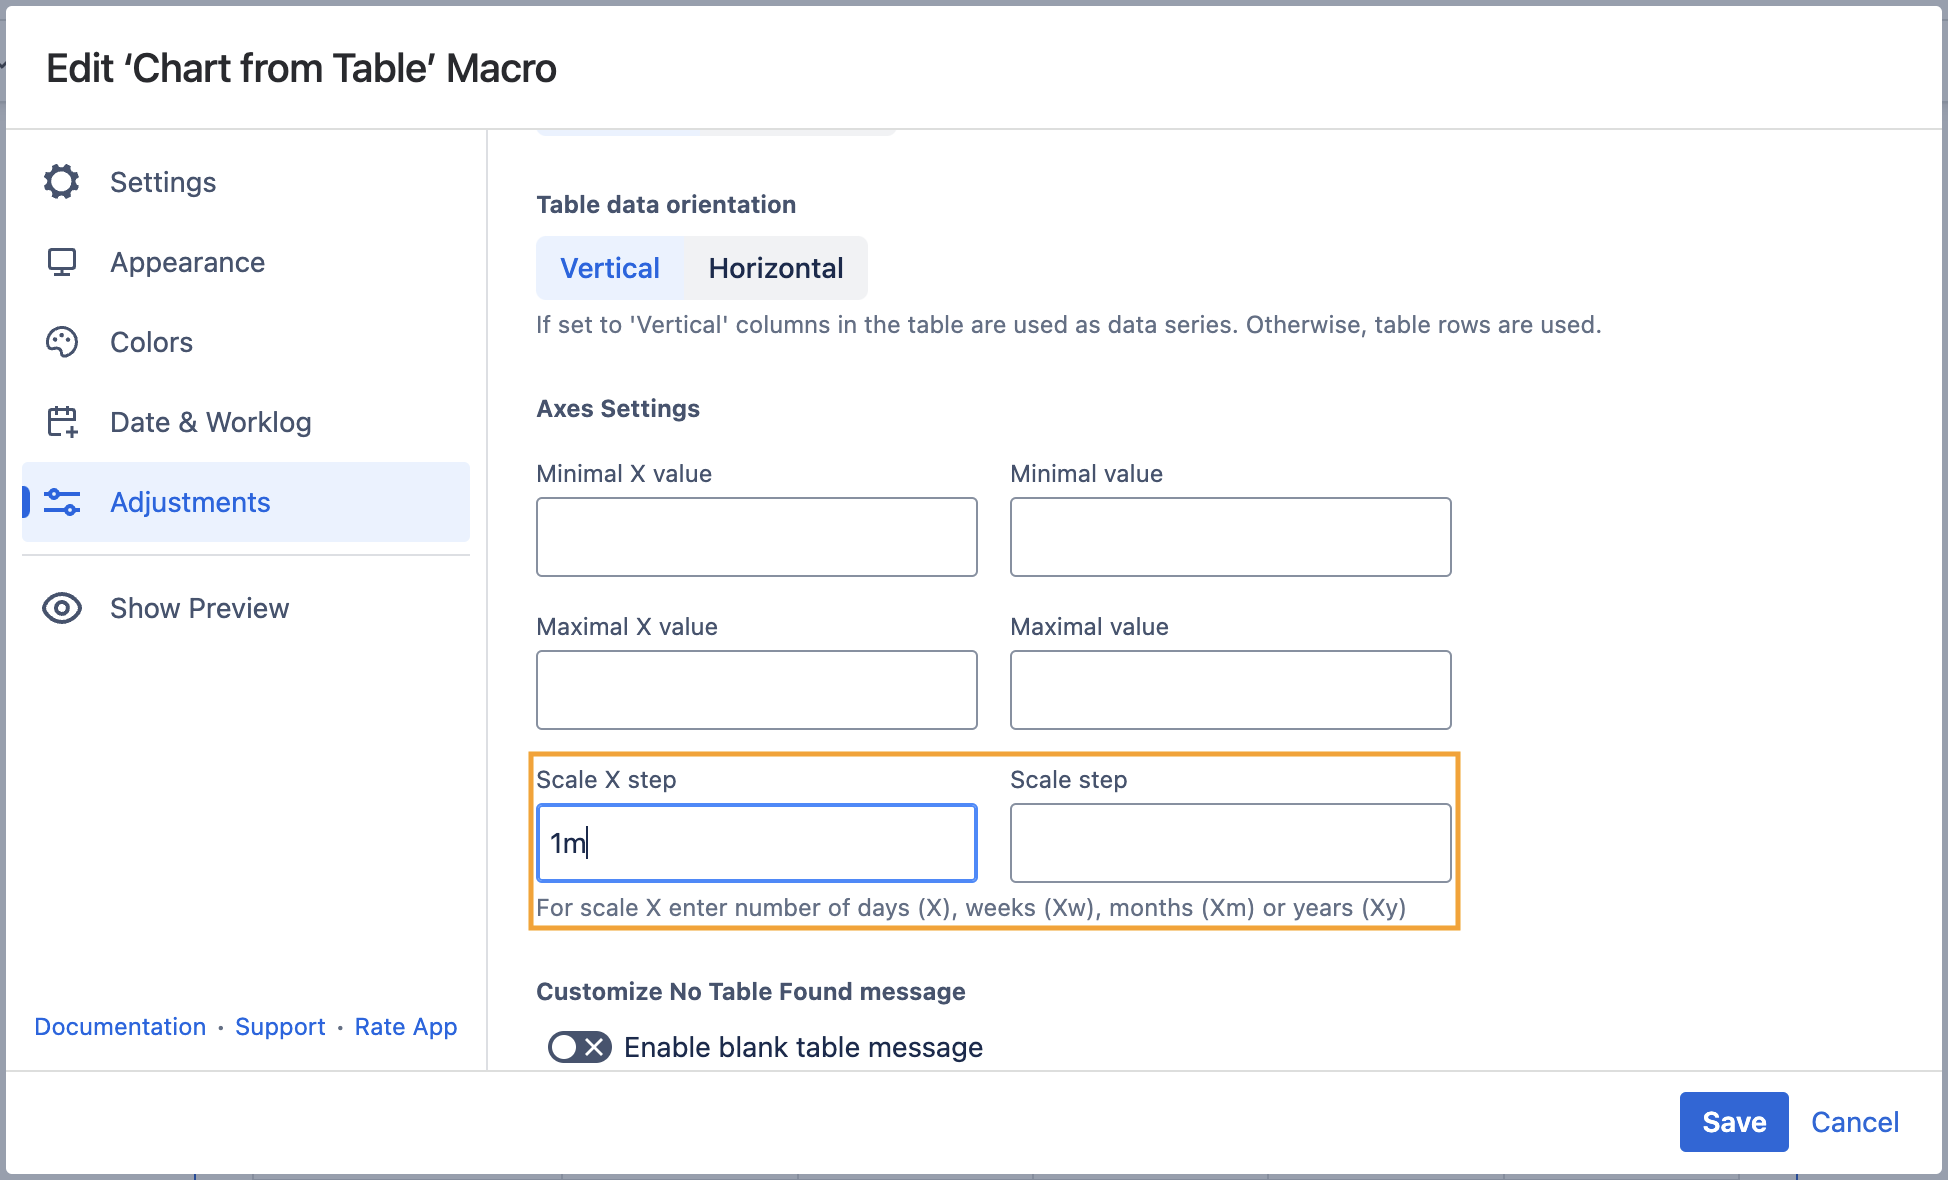
Set the scale step
Scale (X) Step - the required scale step of Y axis for showing the chart.
- Switch the page to the edit mode.
- Select the macro and click Edit.
- Switch to the Adjustments tab.
- Locate the Scale (X) Step options and set the scale step.
- Save the macro and the page.
Date & Worklog Tab
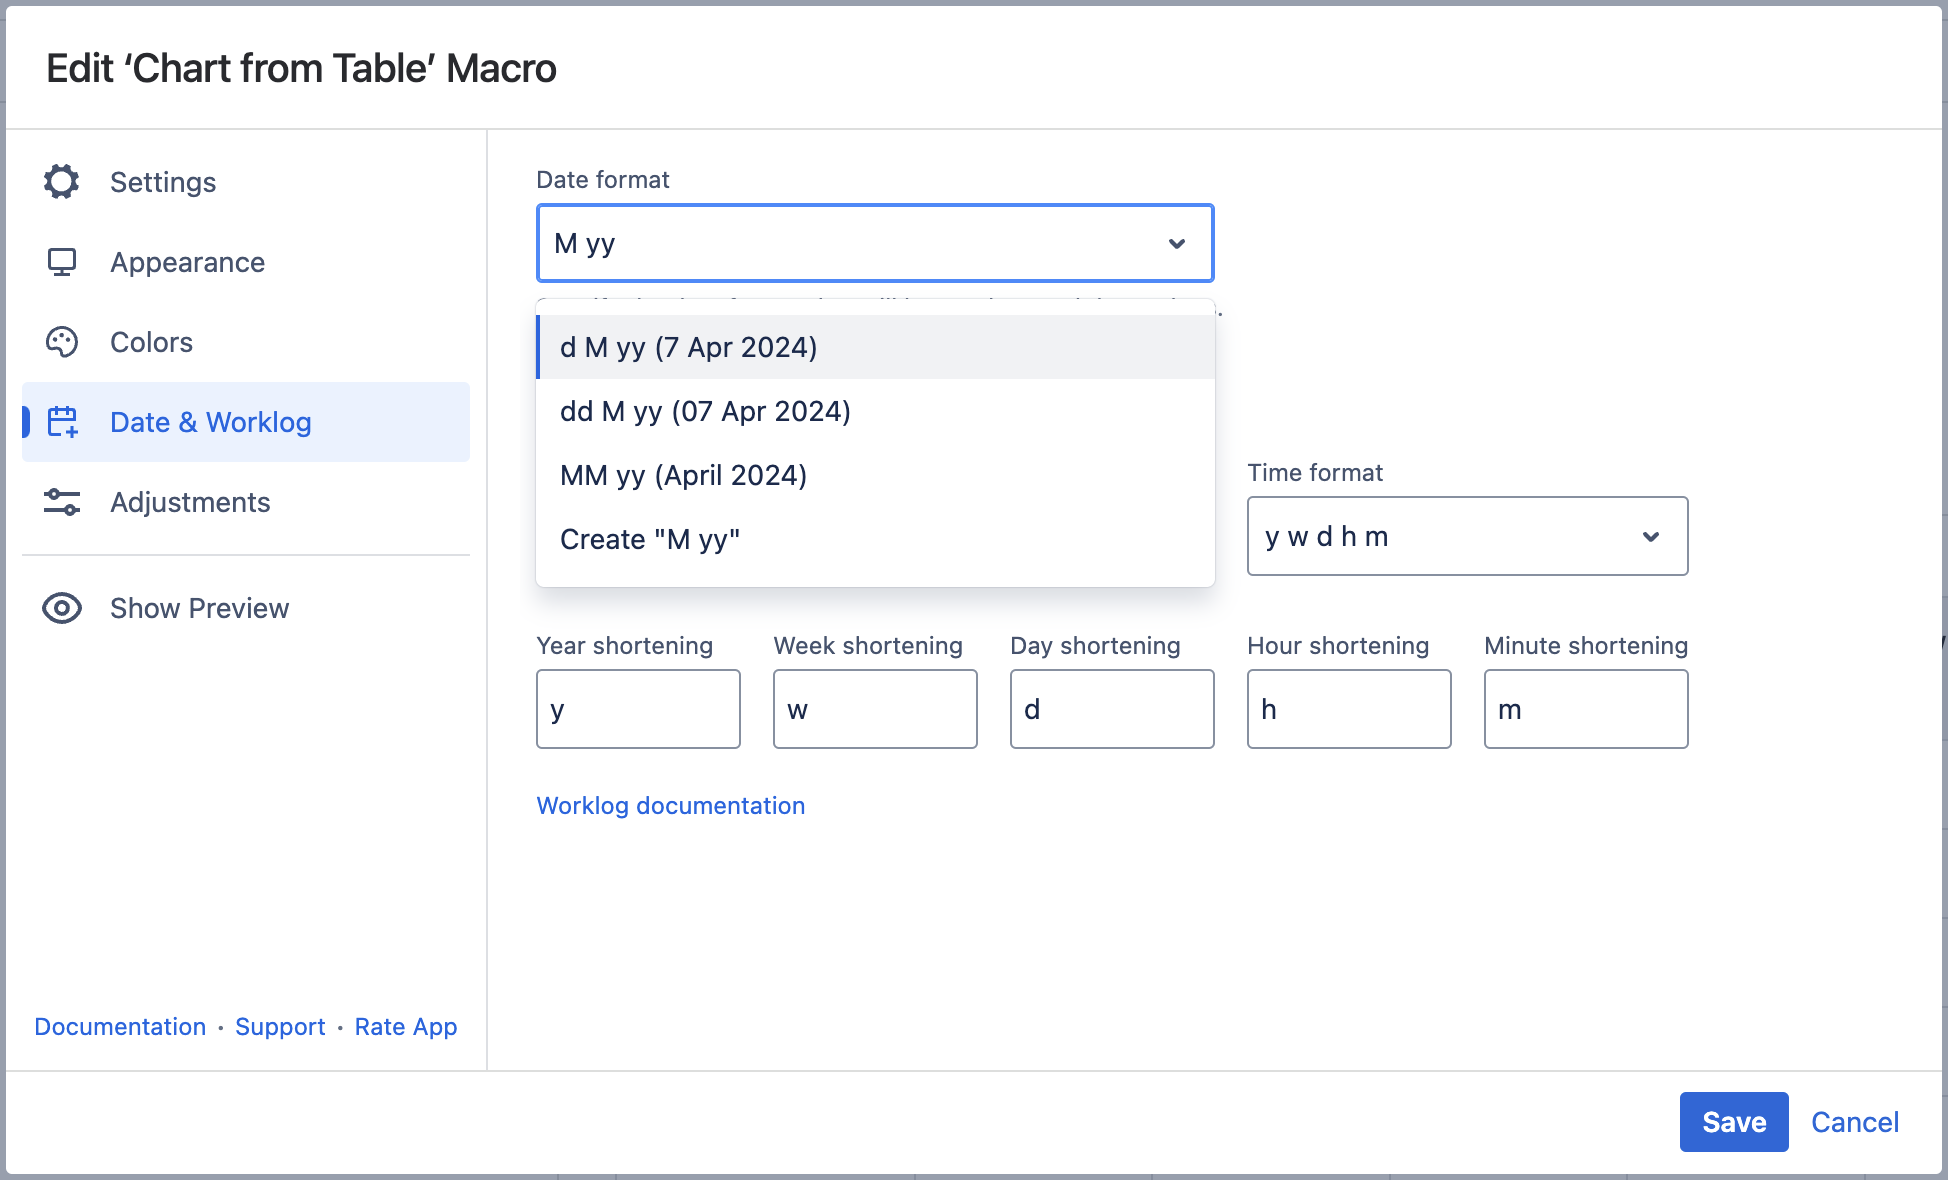
Set the date format
- Switch the page to the edit mode.
- Select the macro and click Edit.
- Switch to the Date & Worklog tab.
- Locate the Date format option.
- Specify the correct date format for date values in the source table.
- Save the macro and the page.
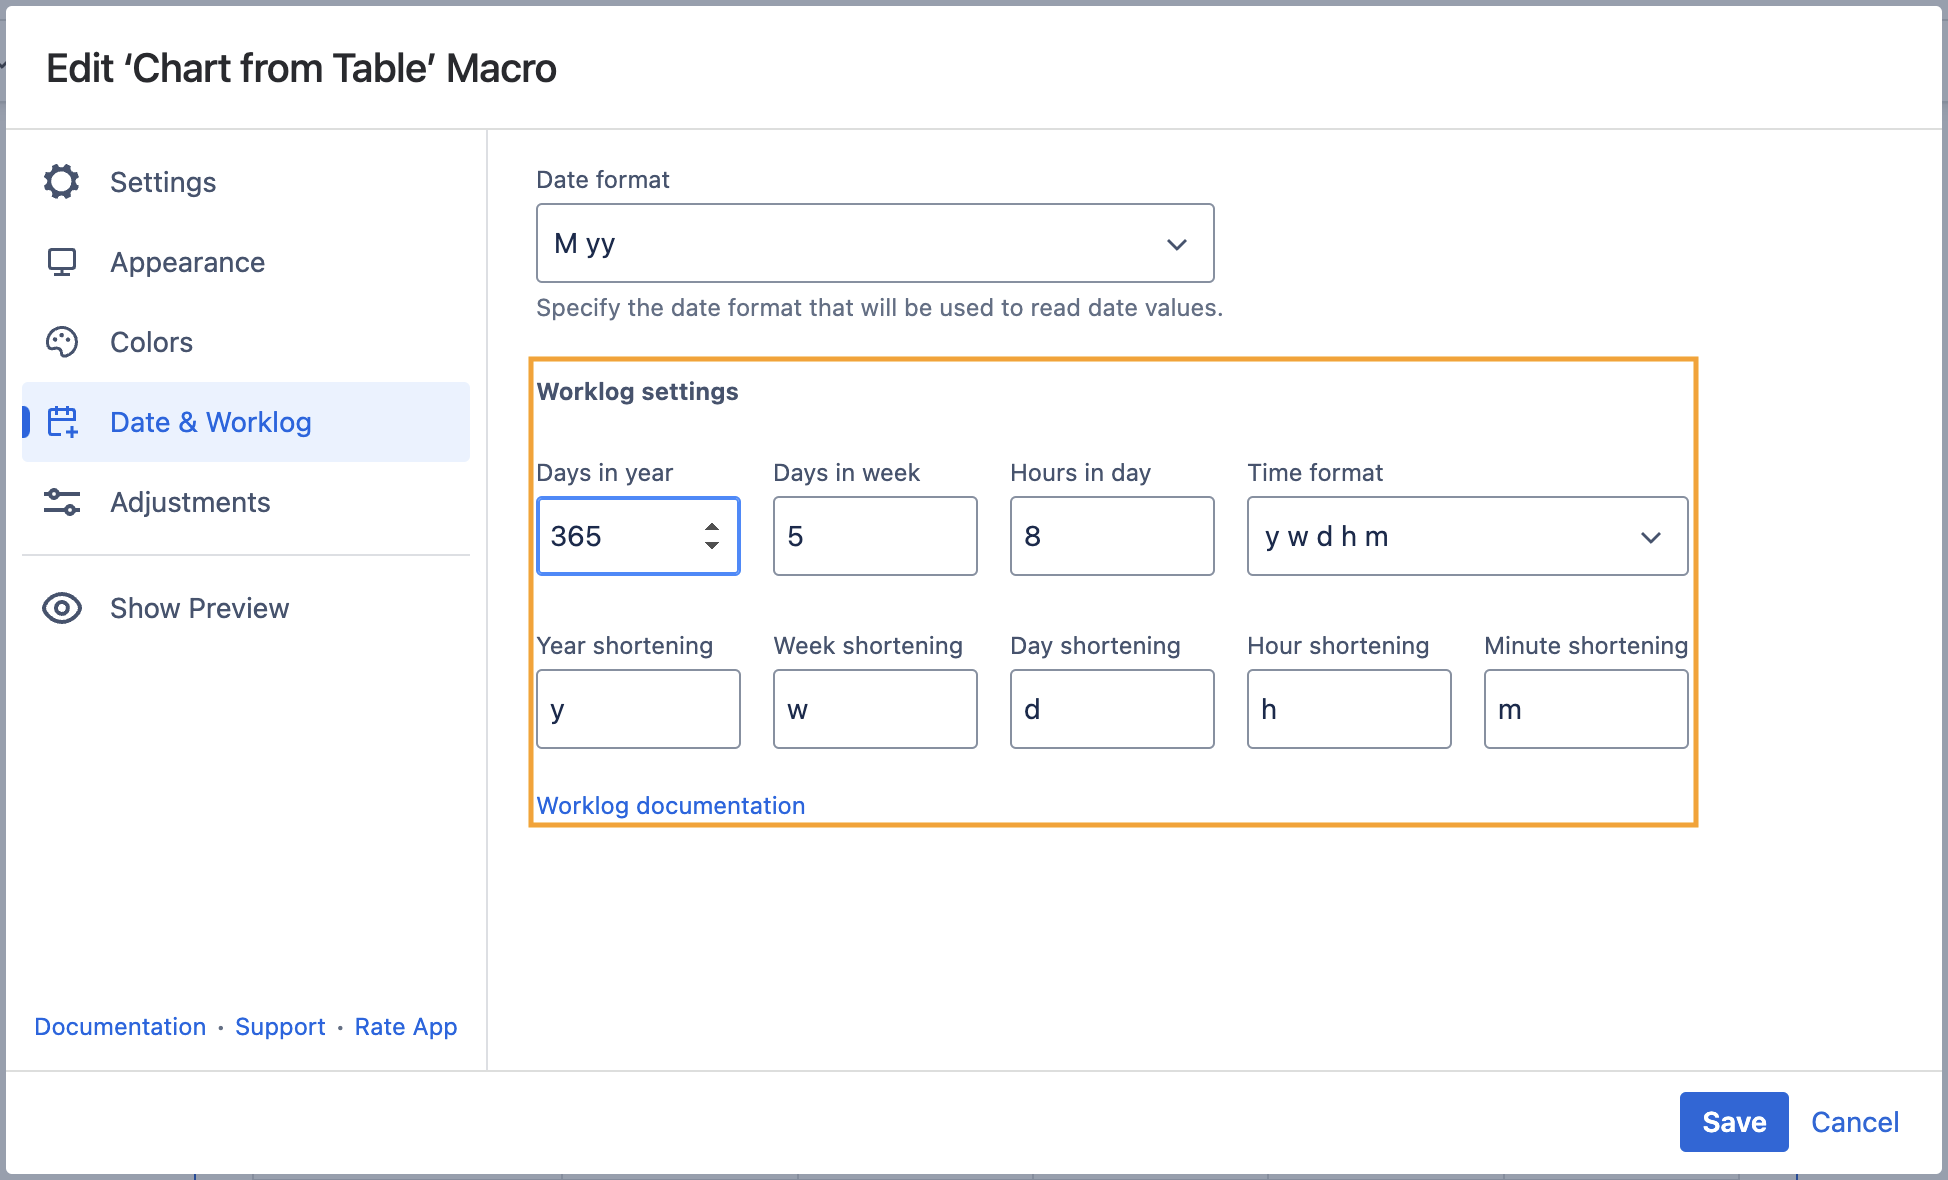
Set the worklog settings
- Switch the page to the edit mode.
- Select the macro and click Edit.
- Switch to the Date & Worklog tab.
- Locate the Worklog settings option.
- Define the worklog parameters, as follows:
- Days in year - enter the number of days in a year.
- Days in week - enter the number of business days in a week.
- Hours in day - enter the number of working hours in one business day.
- Time format - select the used time format in worklog values.
- Year shortening - enter the shortening for the year time unit if you use any language different from English.
- Week shortening - enter the shortening for the week time unit if you use any language different from English.
- Day shortening - enter the shortening for the day time unit if you use any language different from English.
- Hour shortening - enter the shortening for the hour time unit if you use any language different from English.
- Minute shortening - enter the shortening for the minute time unit if you use any language different from English.
- Save the macro and the page.
Appearance Tab
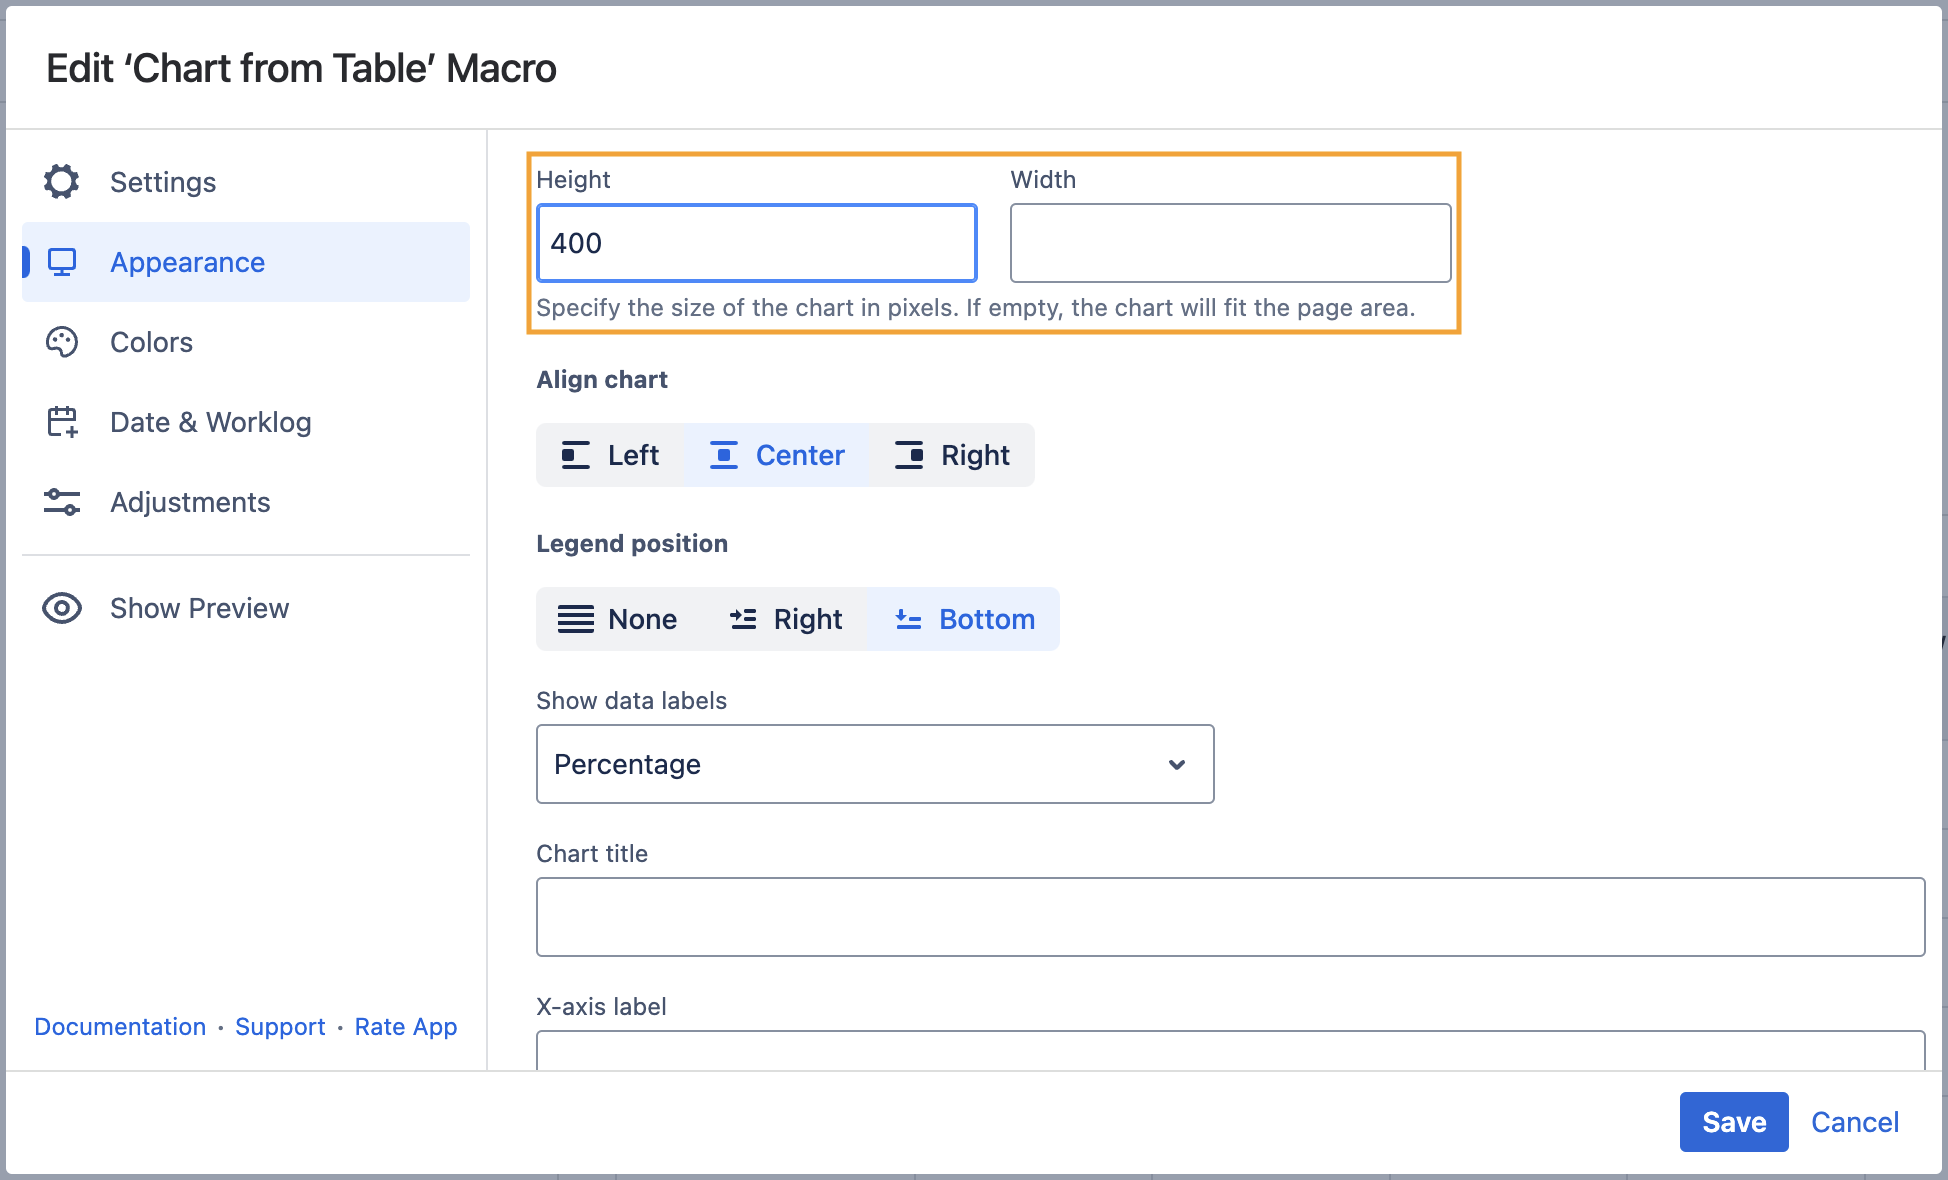
Set the height and width of the chart
- Switch the page to the edit mode.
- Select the macro and click Edit.
- Switch to the Appearance tab.
- Locate the Height and Width fields.
- Enter the appropriate dimensions of the chart.
Save the macro and the page.
To set the Height and Width of the chart in the page view mode:
- Hover over the chart controls on the right of the table.
- Locate the Height and Width fields.
- Enter the appropriate dimensions of the chart.
- To save the modifications in the macro body, click the cogwheel icon and select Save changes.
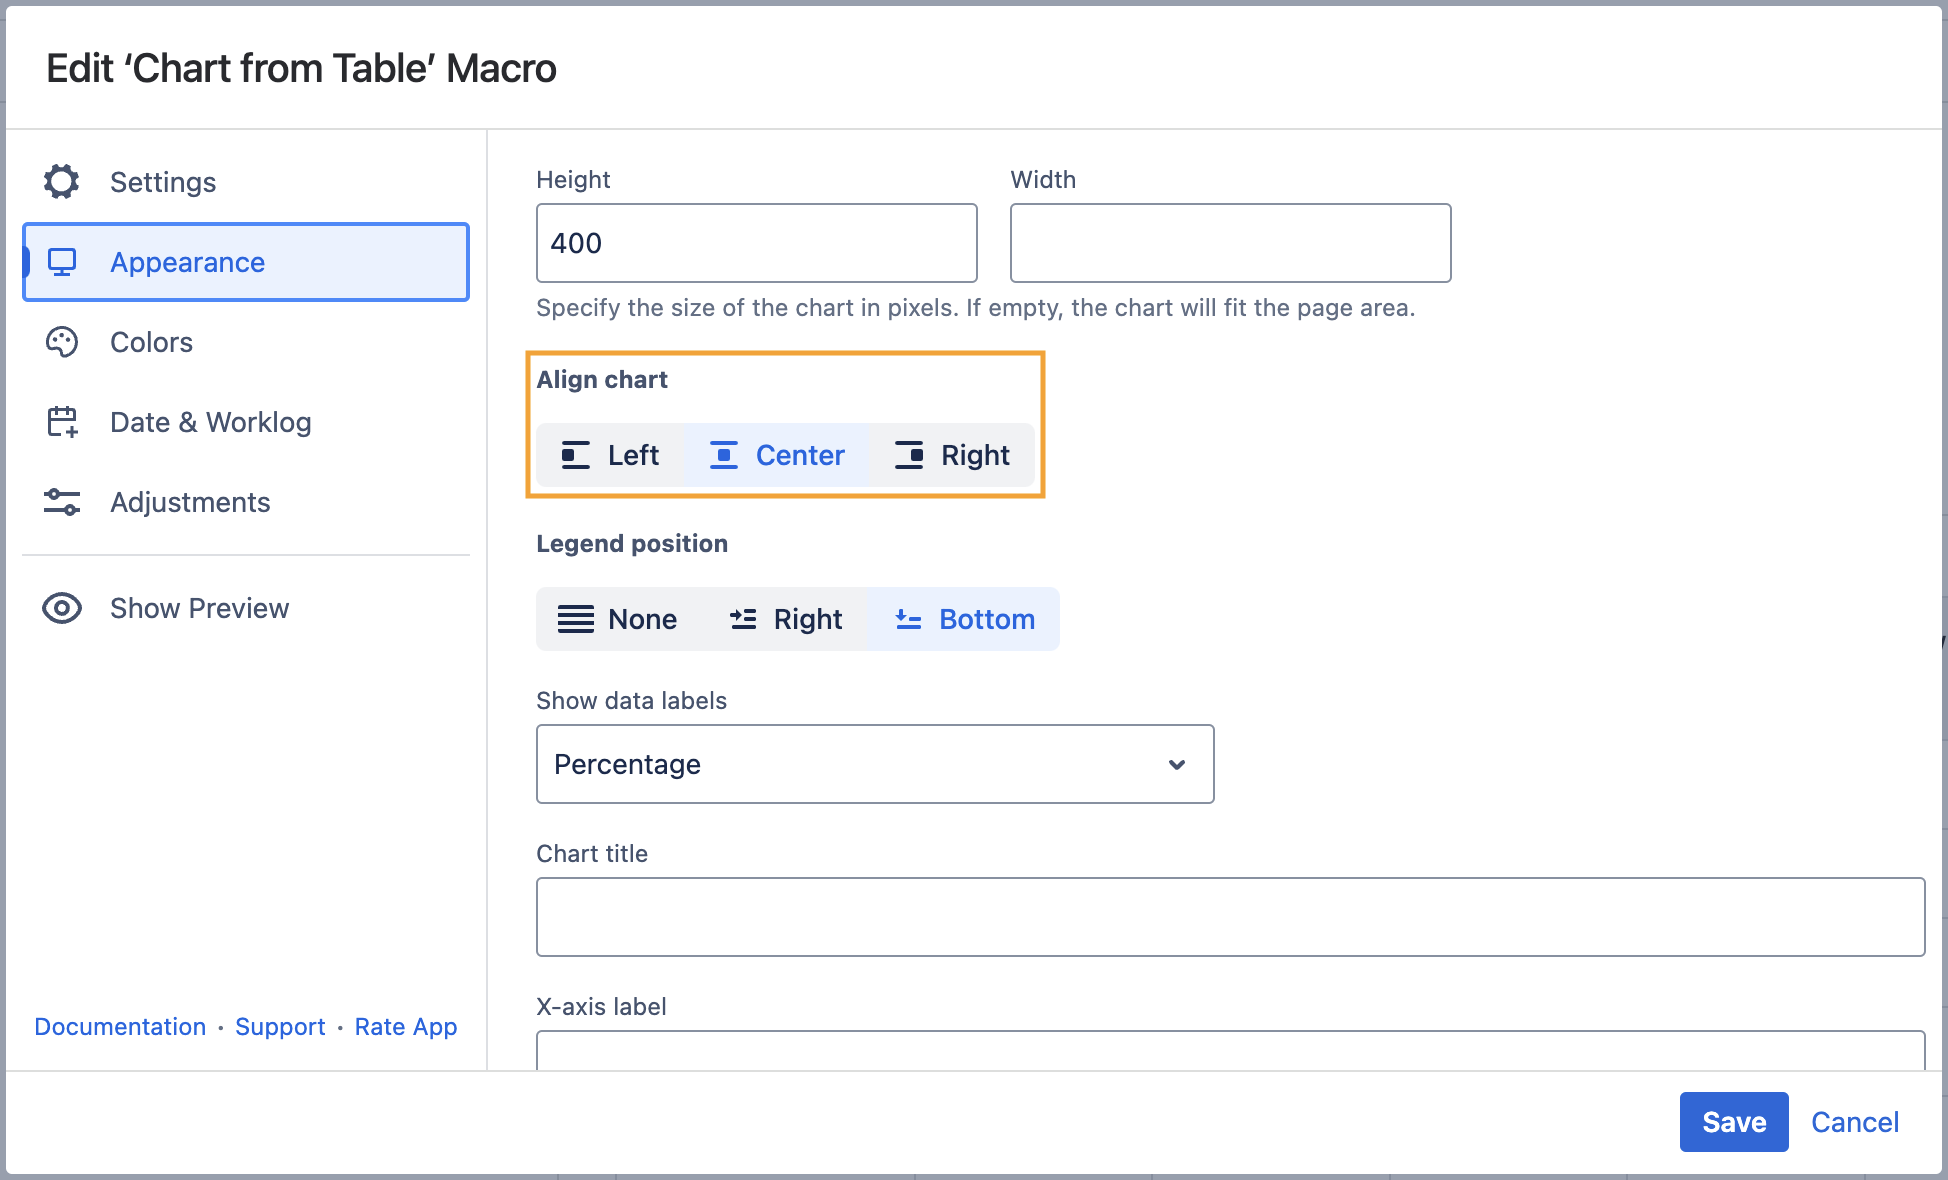
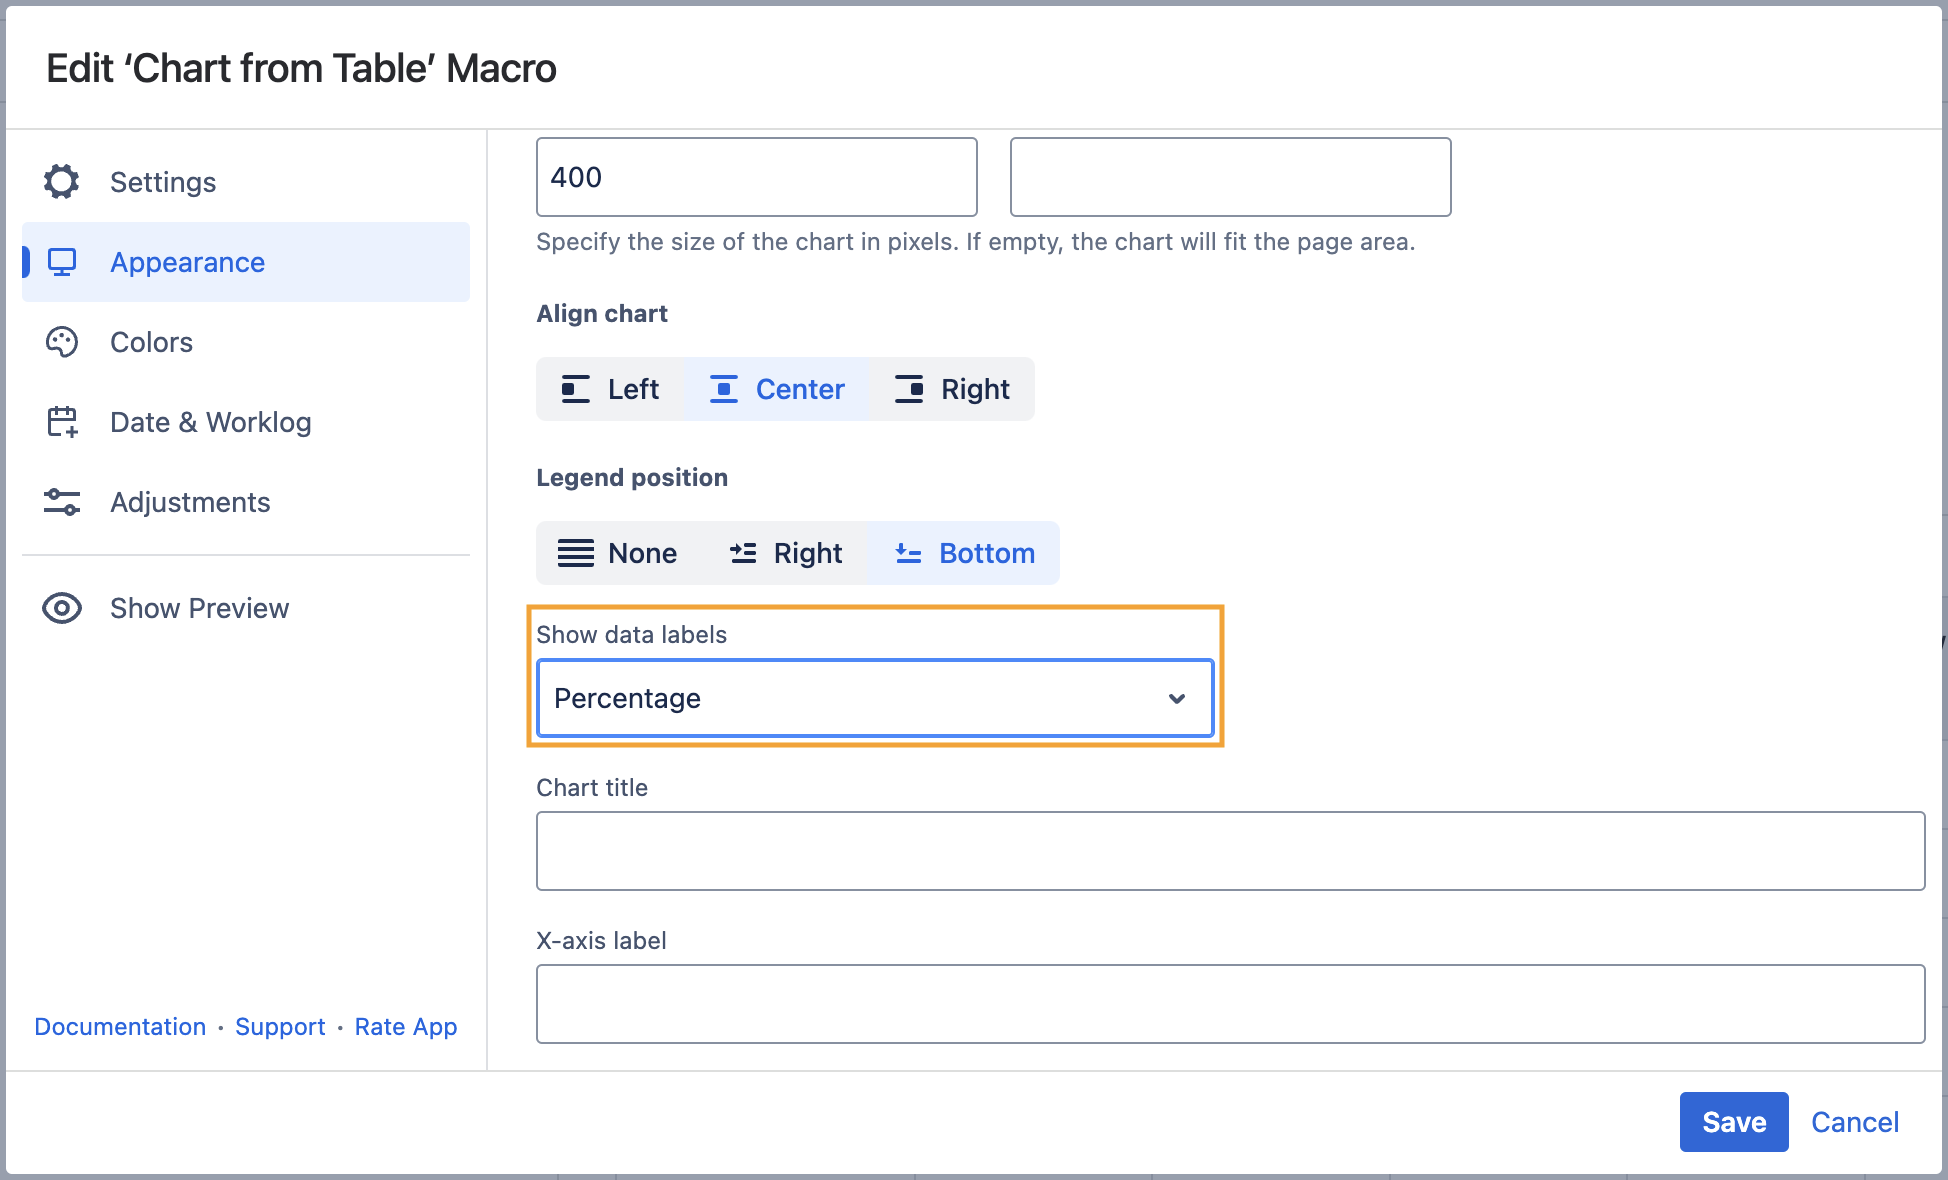
Align chart
- Switch the page to the edit mode.
- Select the macro and click Edit.
- Switch to the Appearance tab.
- Locate the Align chart option.
- Select the appropriate chart alignment, as follows:
- Left
- Center
- Right
- Save the macro and the page.
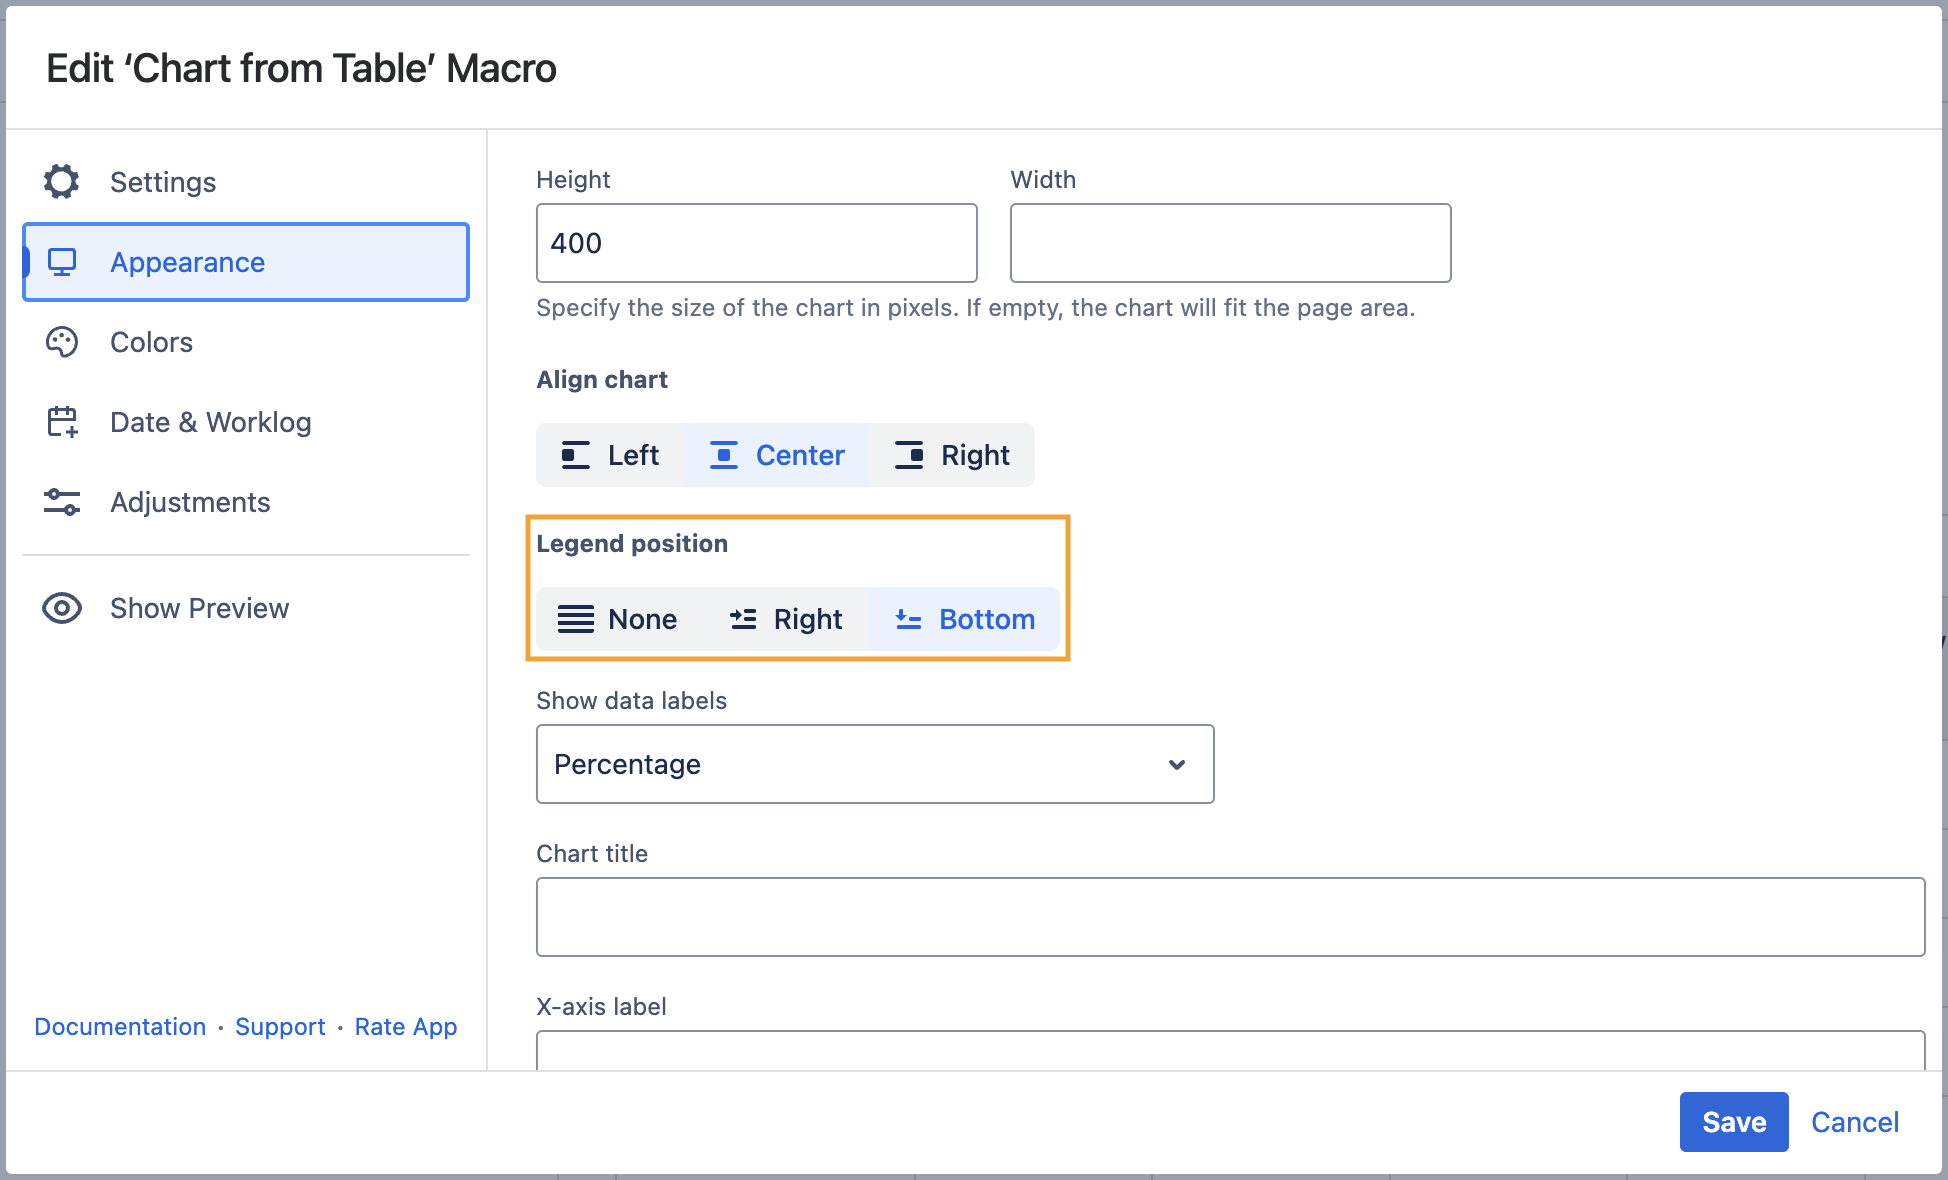
Set the legend position
- Switch the page to the edit mode.
- Select the macro and click Edit.
- Switch to the Appearance tab.
- Locate the Legend Position option.
- Select the appropriate legend position, as follows:
- None
- Right
- Bottom
- Save the macro and the page.
Show data labels
- Switch the page to the edit mode.
- Select the macro and click Edit.
- Switch to the Appearance tab.
- Locate the Show data labels option and select the appropriate option, as follows:
- None
- Value
- Percentage
- Value (Percentage)
- Percentage (Value)
- Save the macro and the page.
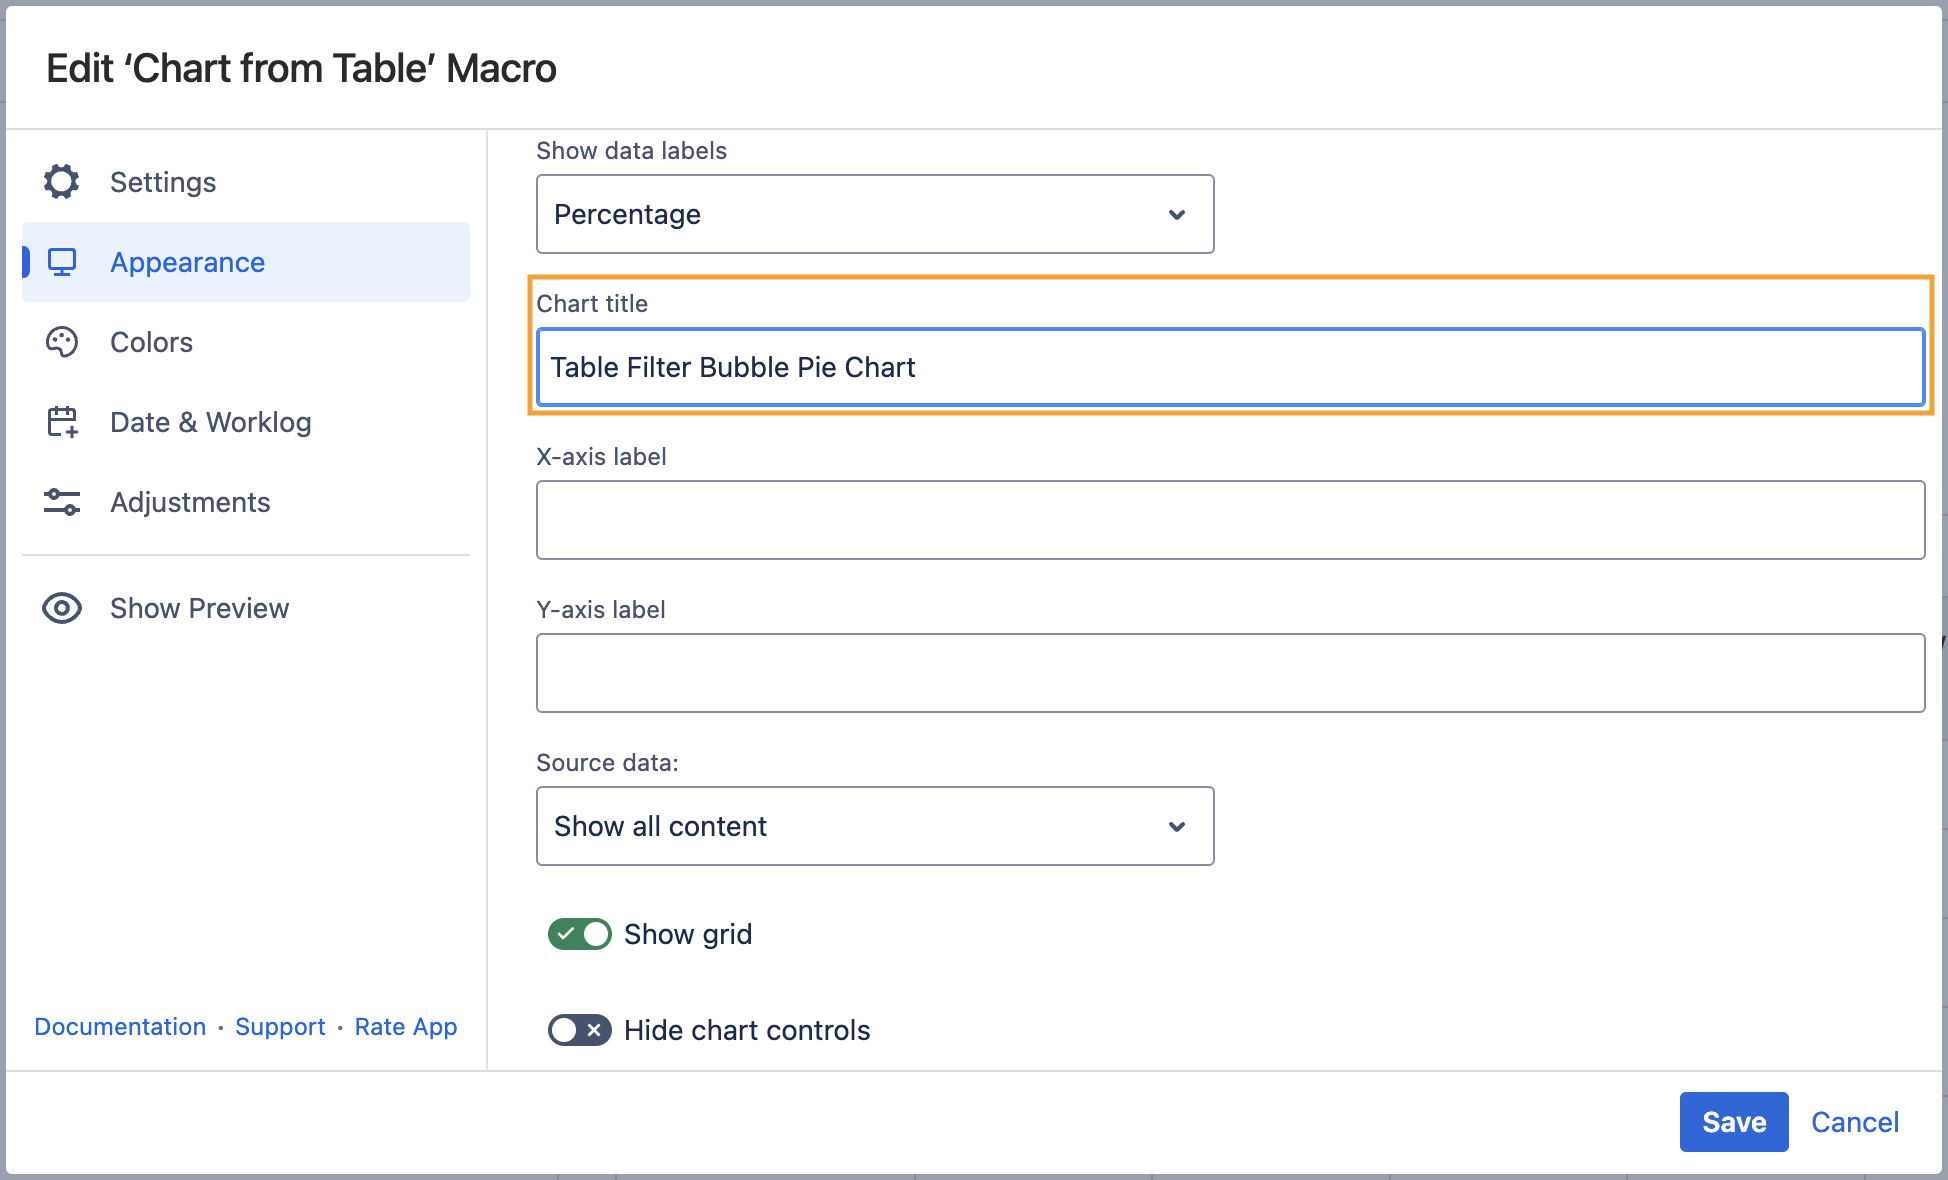
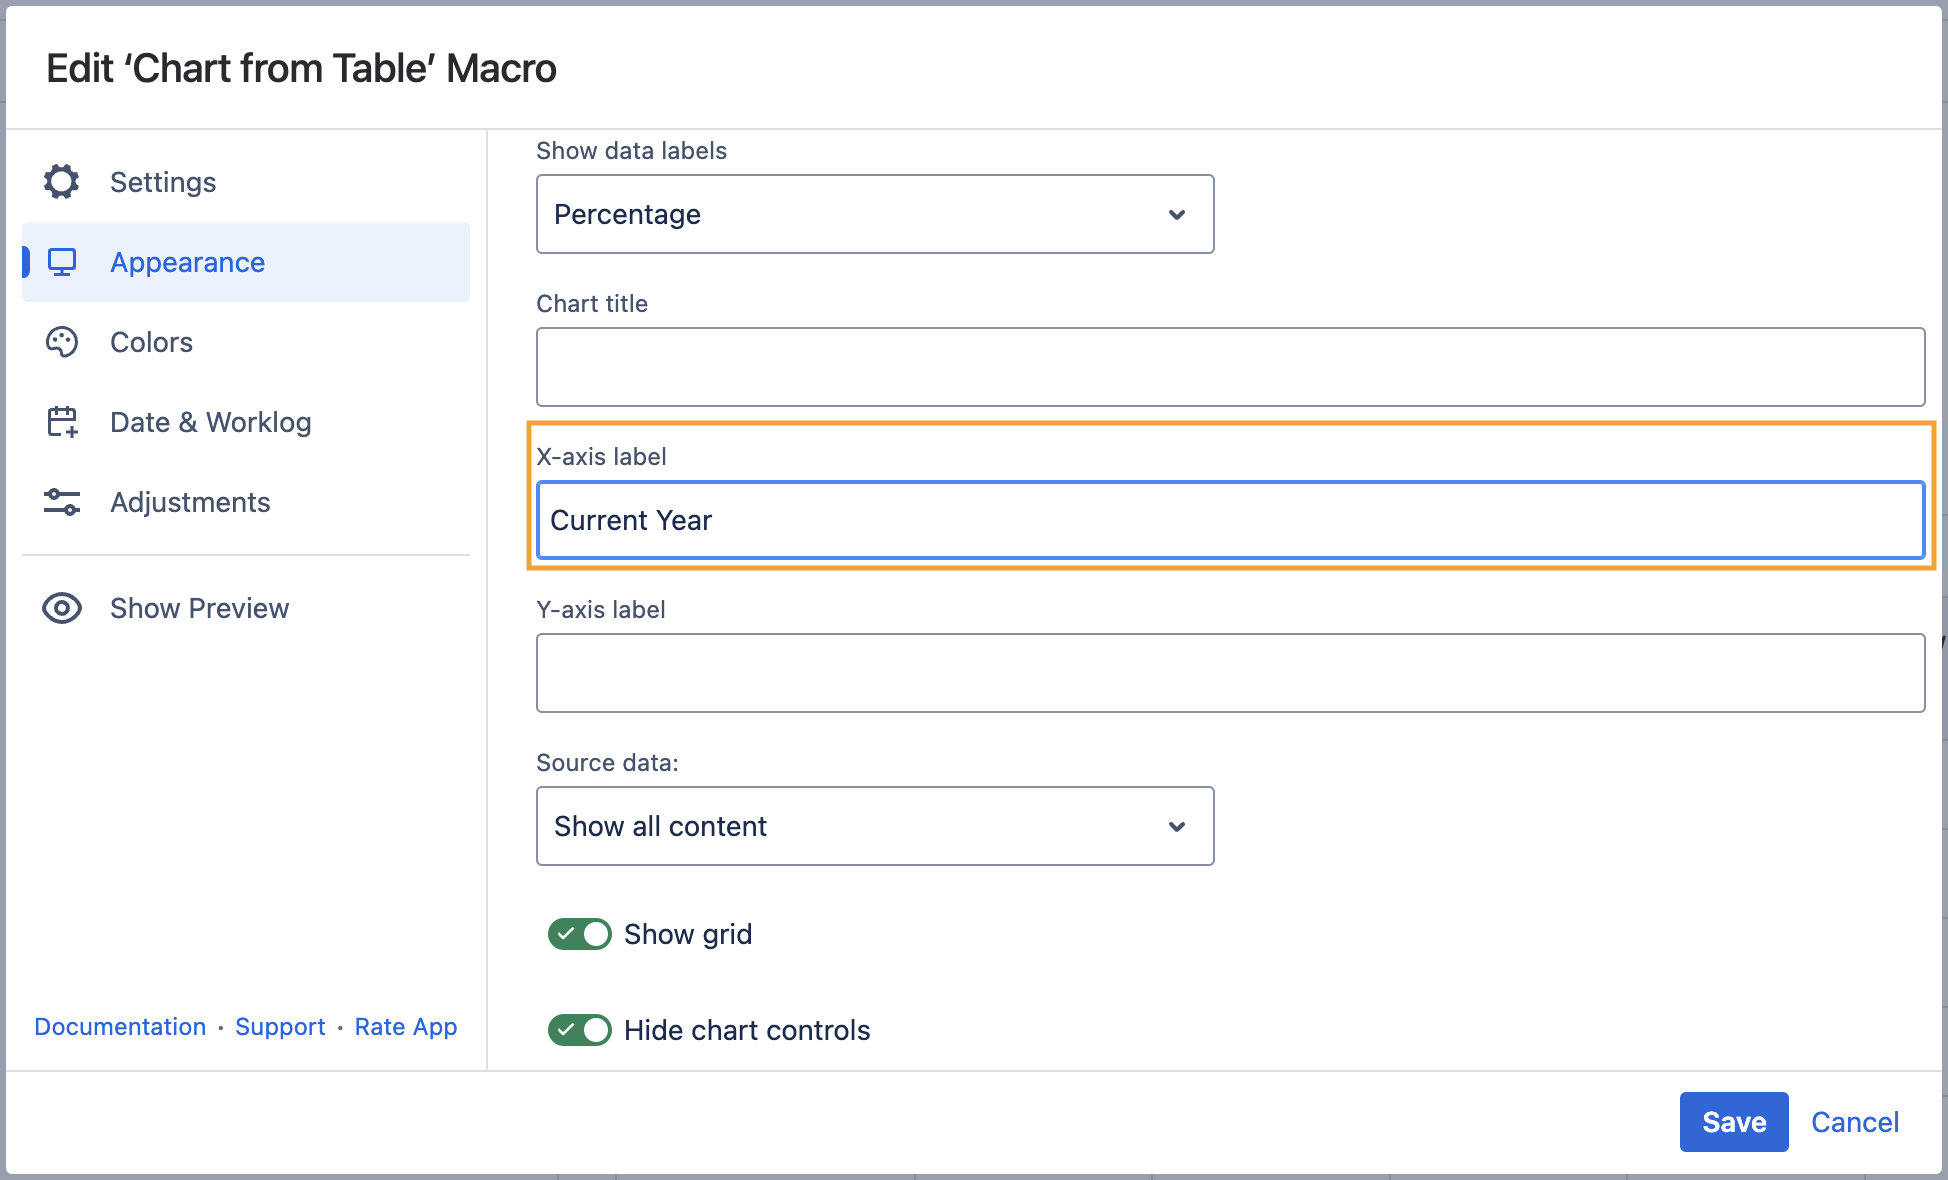
Set the chart title
- Switch the page to the edit mode.
- Select the macro and click Edit.
- Switch to the Appearance tab.
- Locate the Chart title option and enter the title.
- Save the macro and the page.
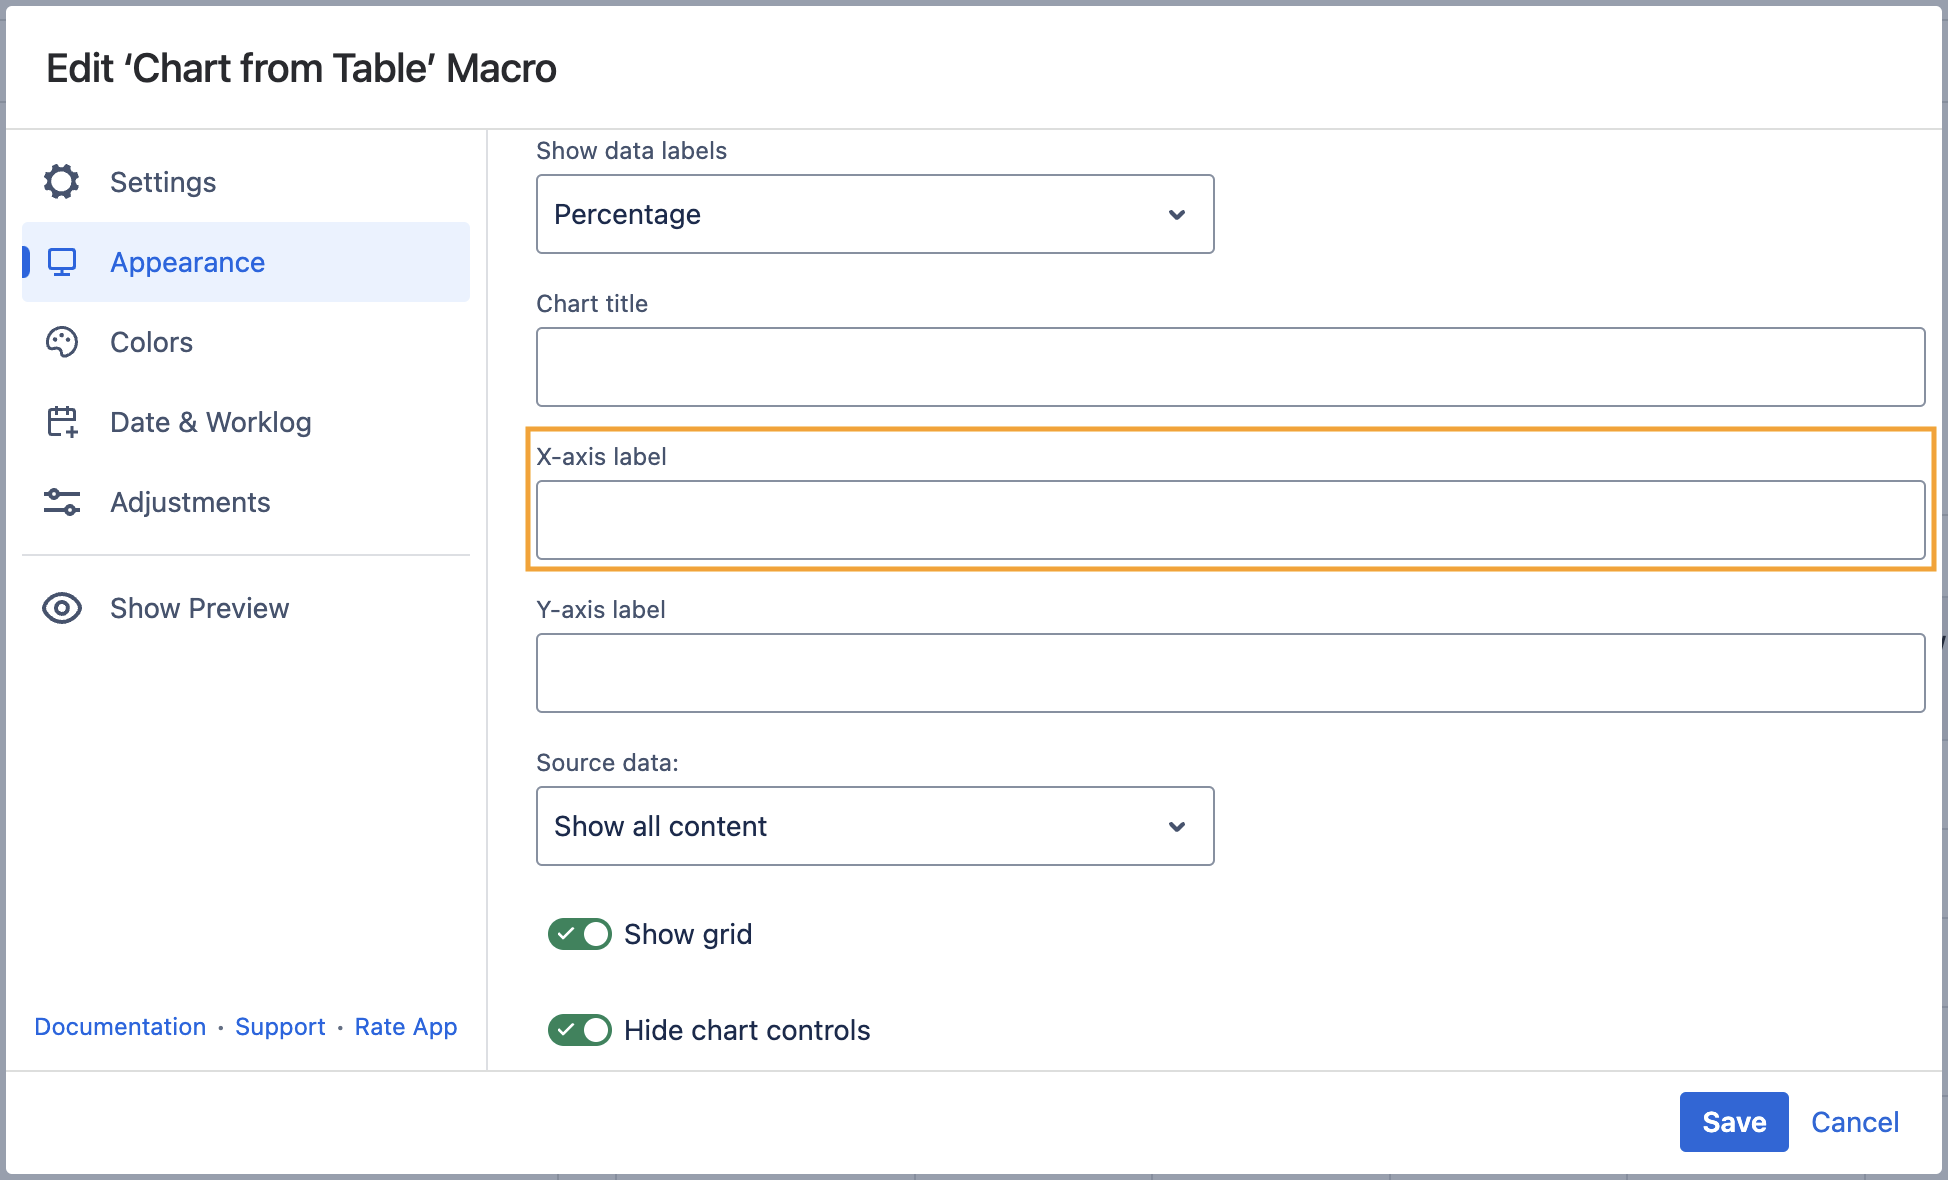
Set axis labels
- Switch the page to the edit mode.
- Select the macro and click Edit.
- Switch to the Appearance tab.
- Locate the X-axis label and Y-axis label options and enter the labels.
- Save the macro and the page.
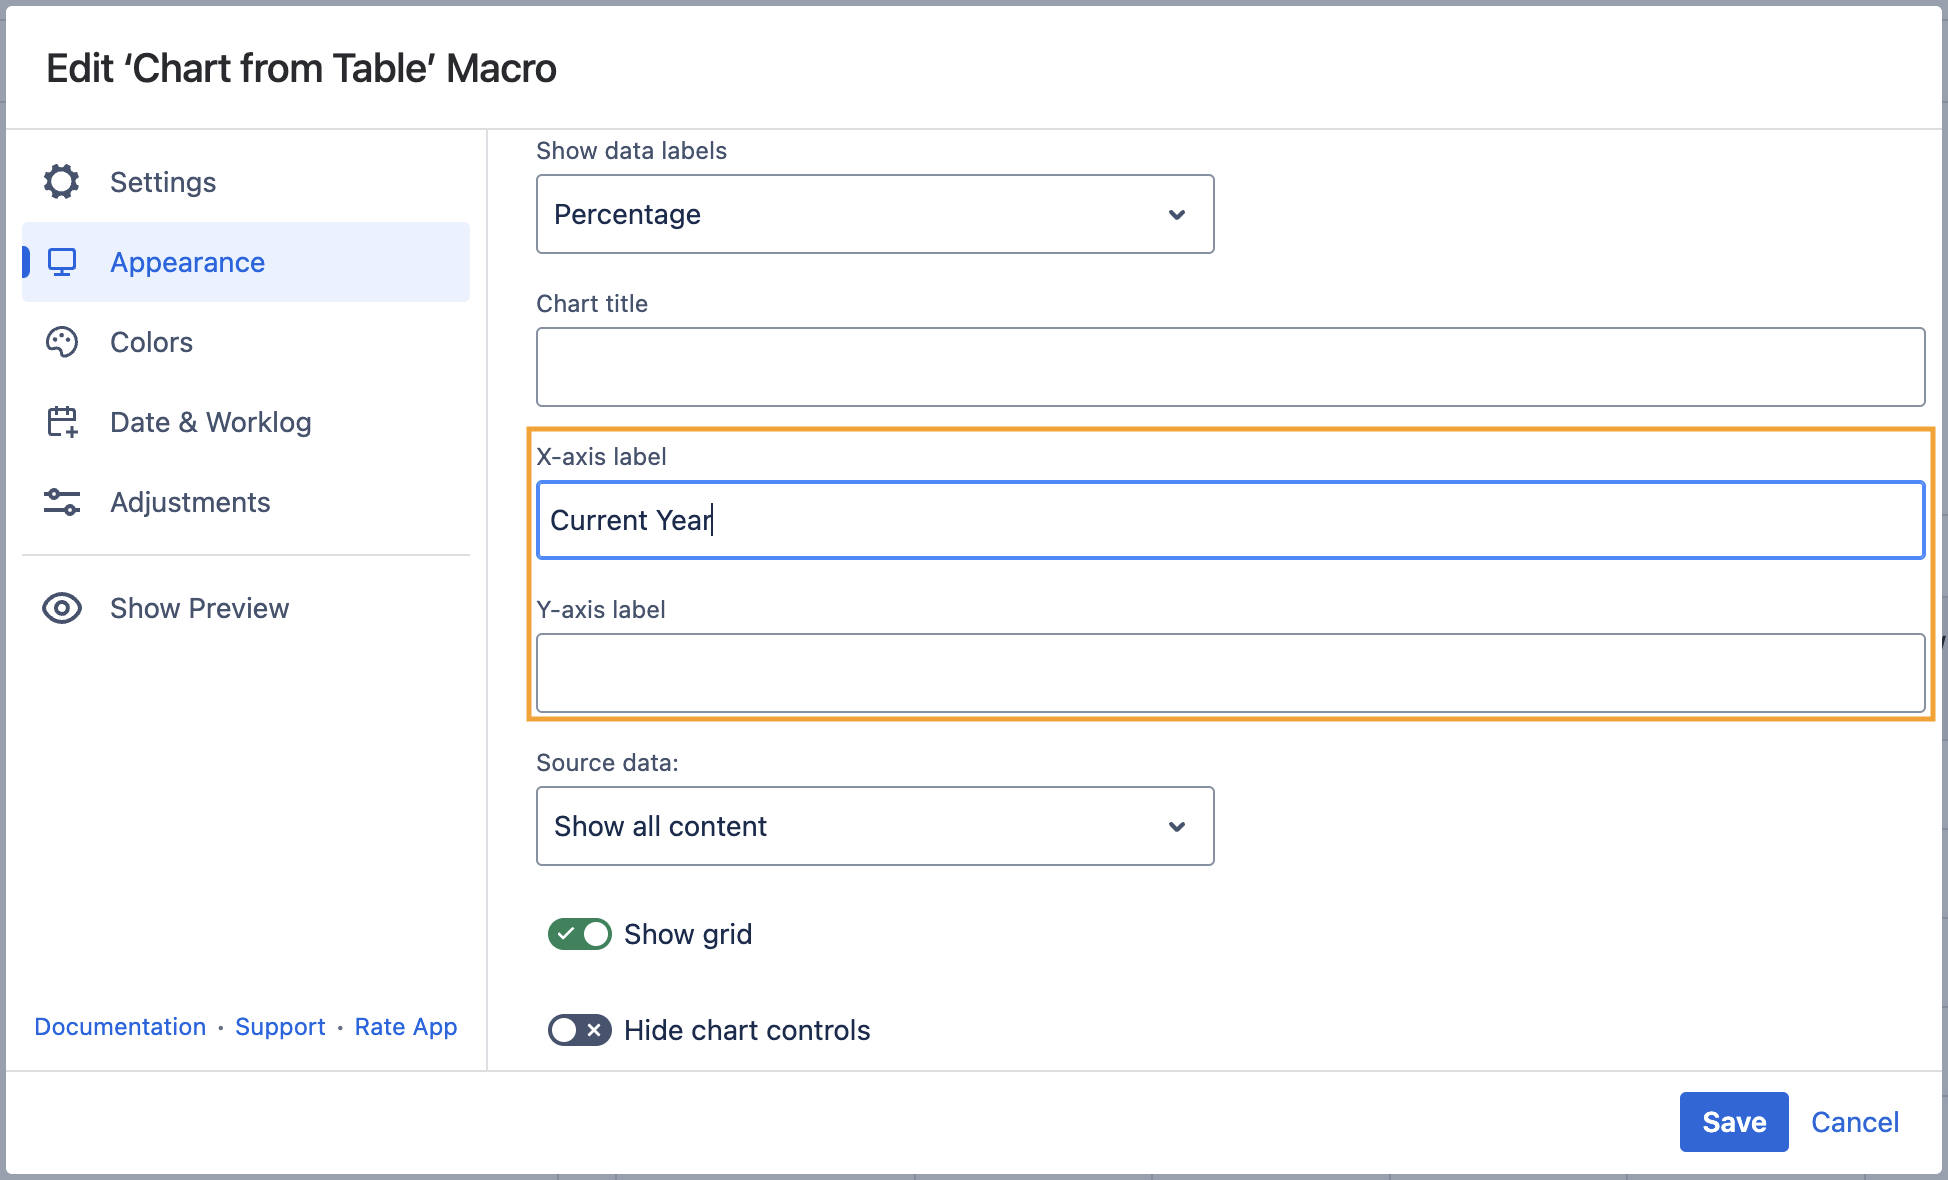
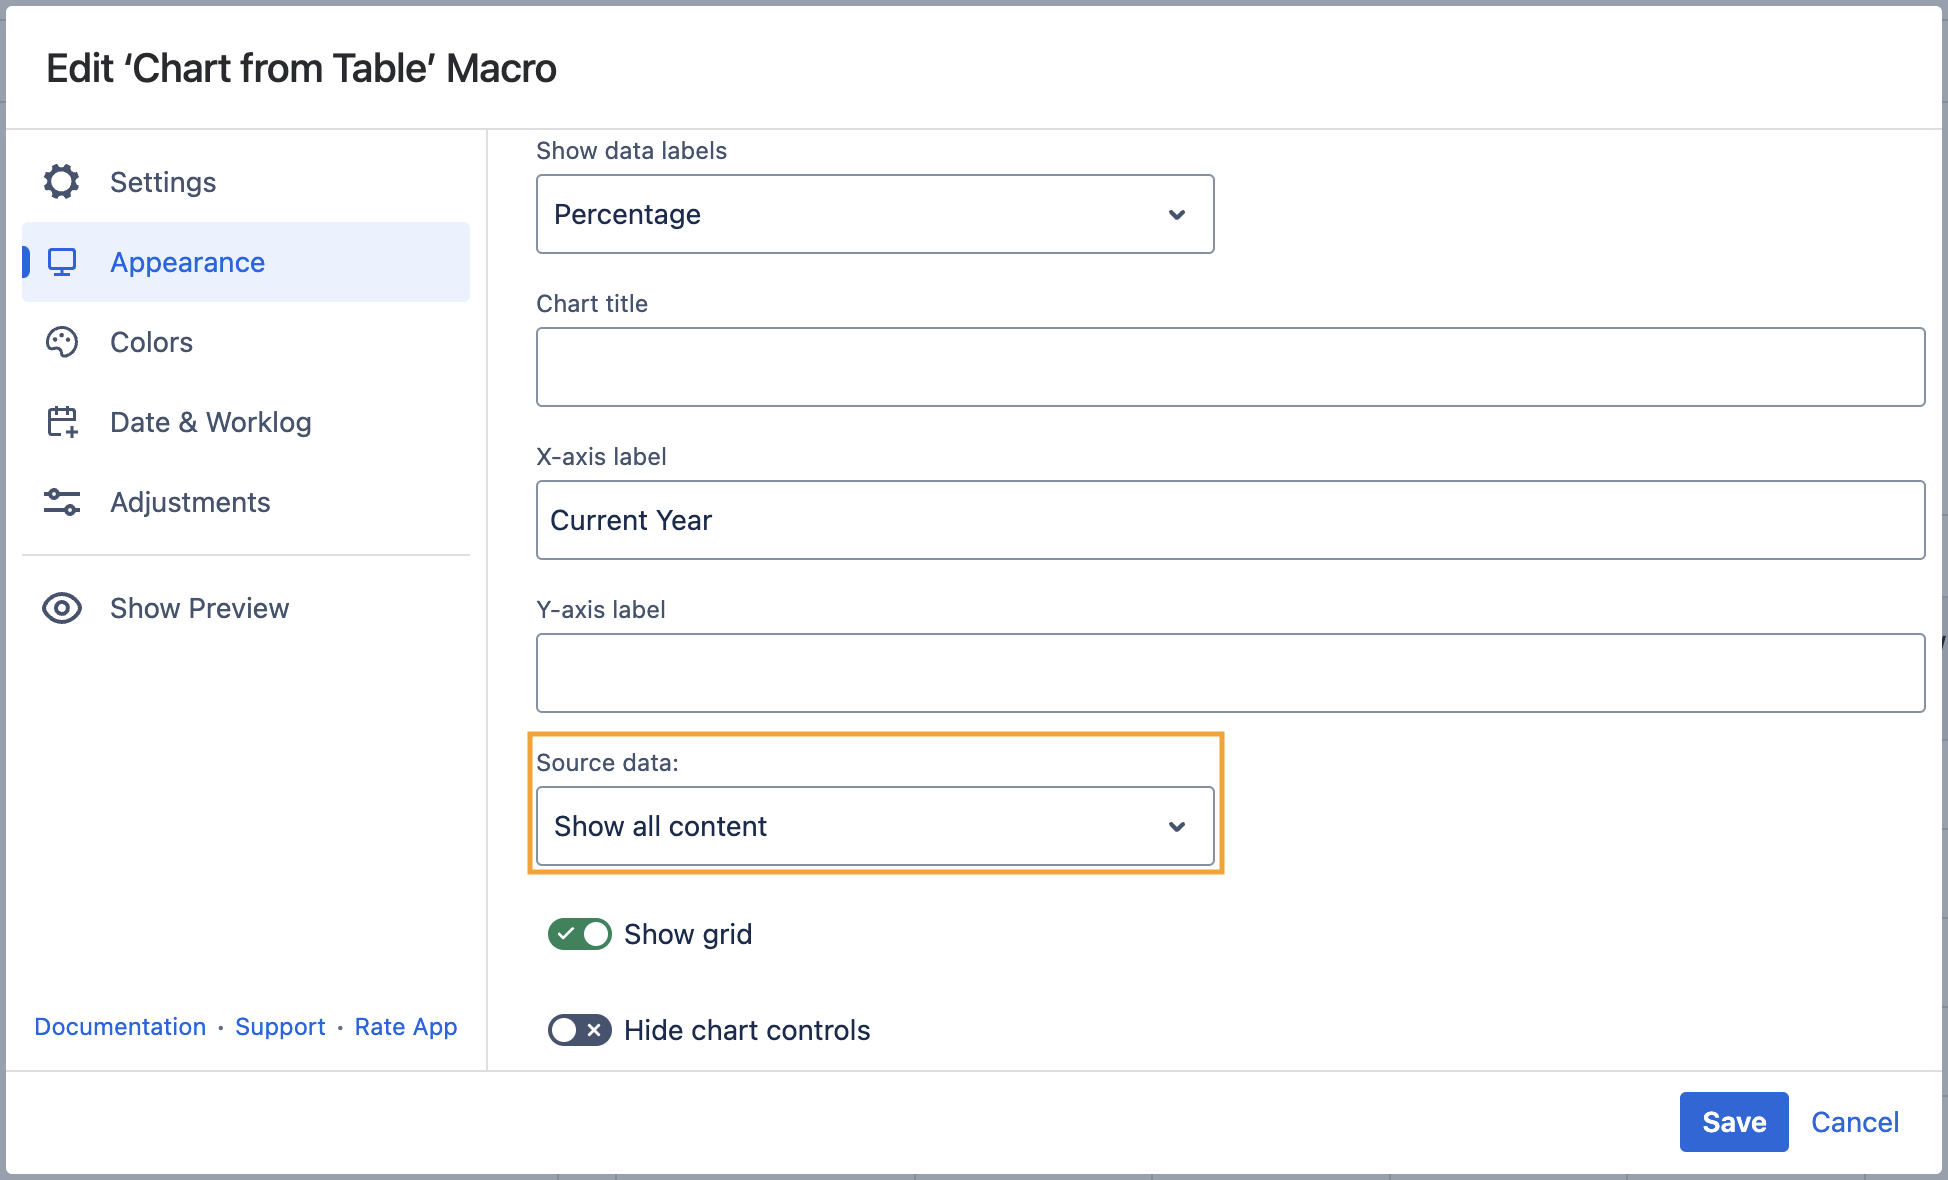
Show/Hide source data
- Switch the page to the edit mode.
- Select the macro and click Edit.
- Switch to the Appearance tab.
- Locate the Source data option and select the appropriate option, as follows:
- Show all content
- Hide tables
- Hide all content
- Save the macro and the page.
To show/hide source data in the page view mode:
- Hover over the chart controls on the right of the table.
- Click the cogwheel icon, select the Show source content, Hide source content (Hide tables, Hide all content) option.
- To save the modifications in the macro body, click the cogwheel icon and select Save changes.
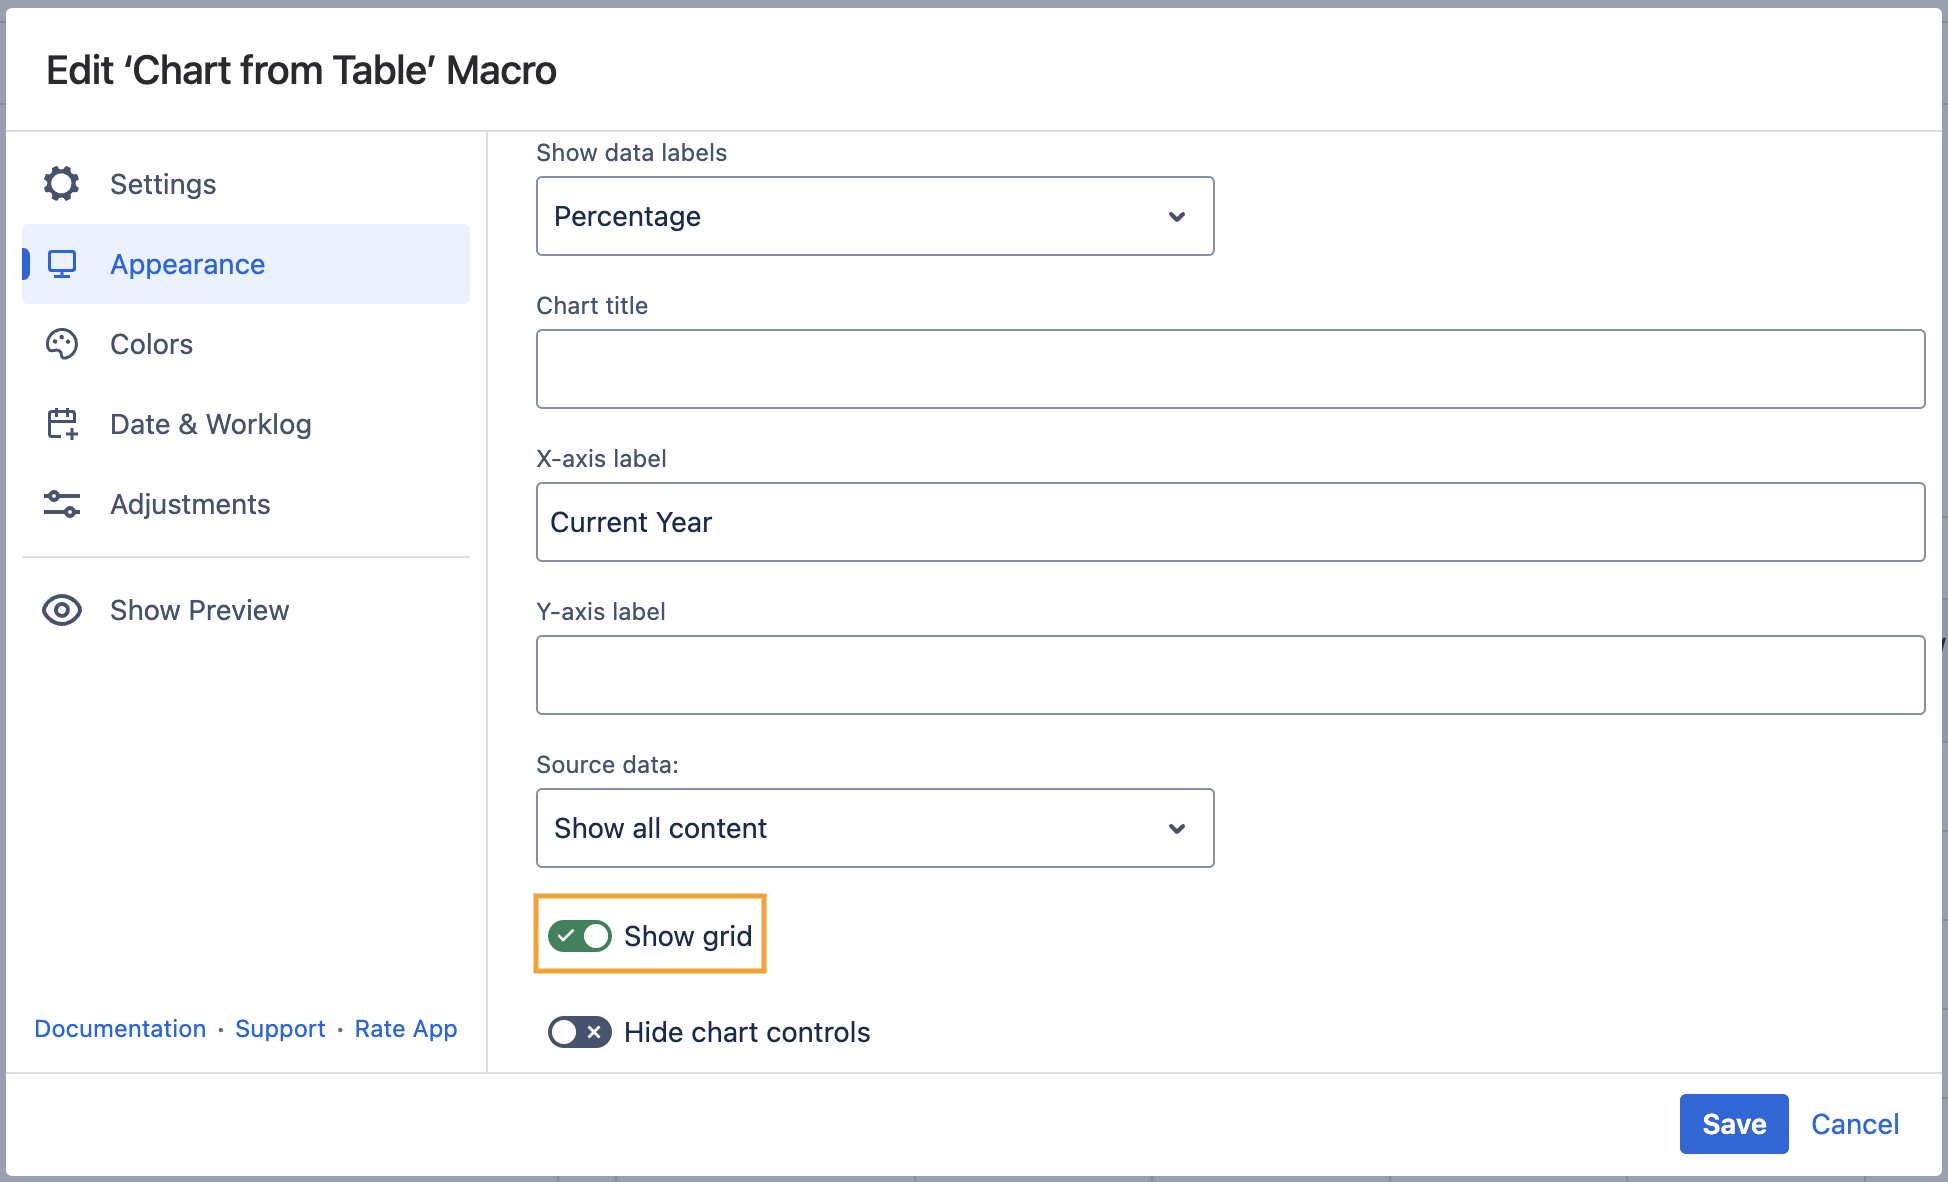
Show grid
- Switch the page to the edit mode.
- Select the macro and click Edit.
- Switch to the Appearance tab.
- Locate and enable the Show grid option.
- Save the macro and the page.
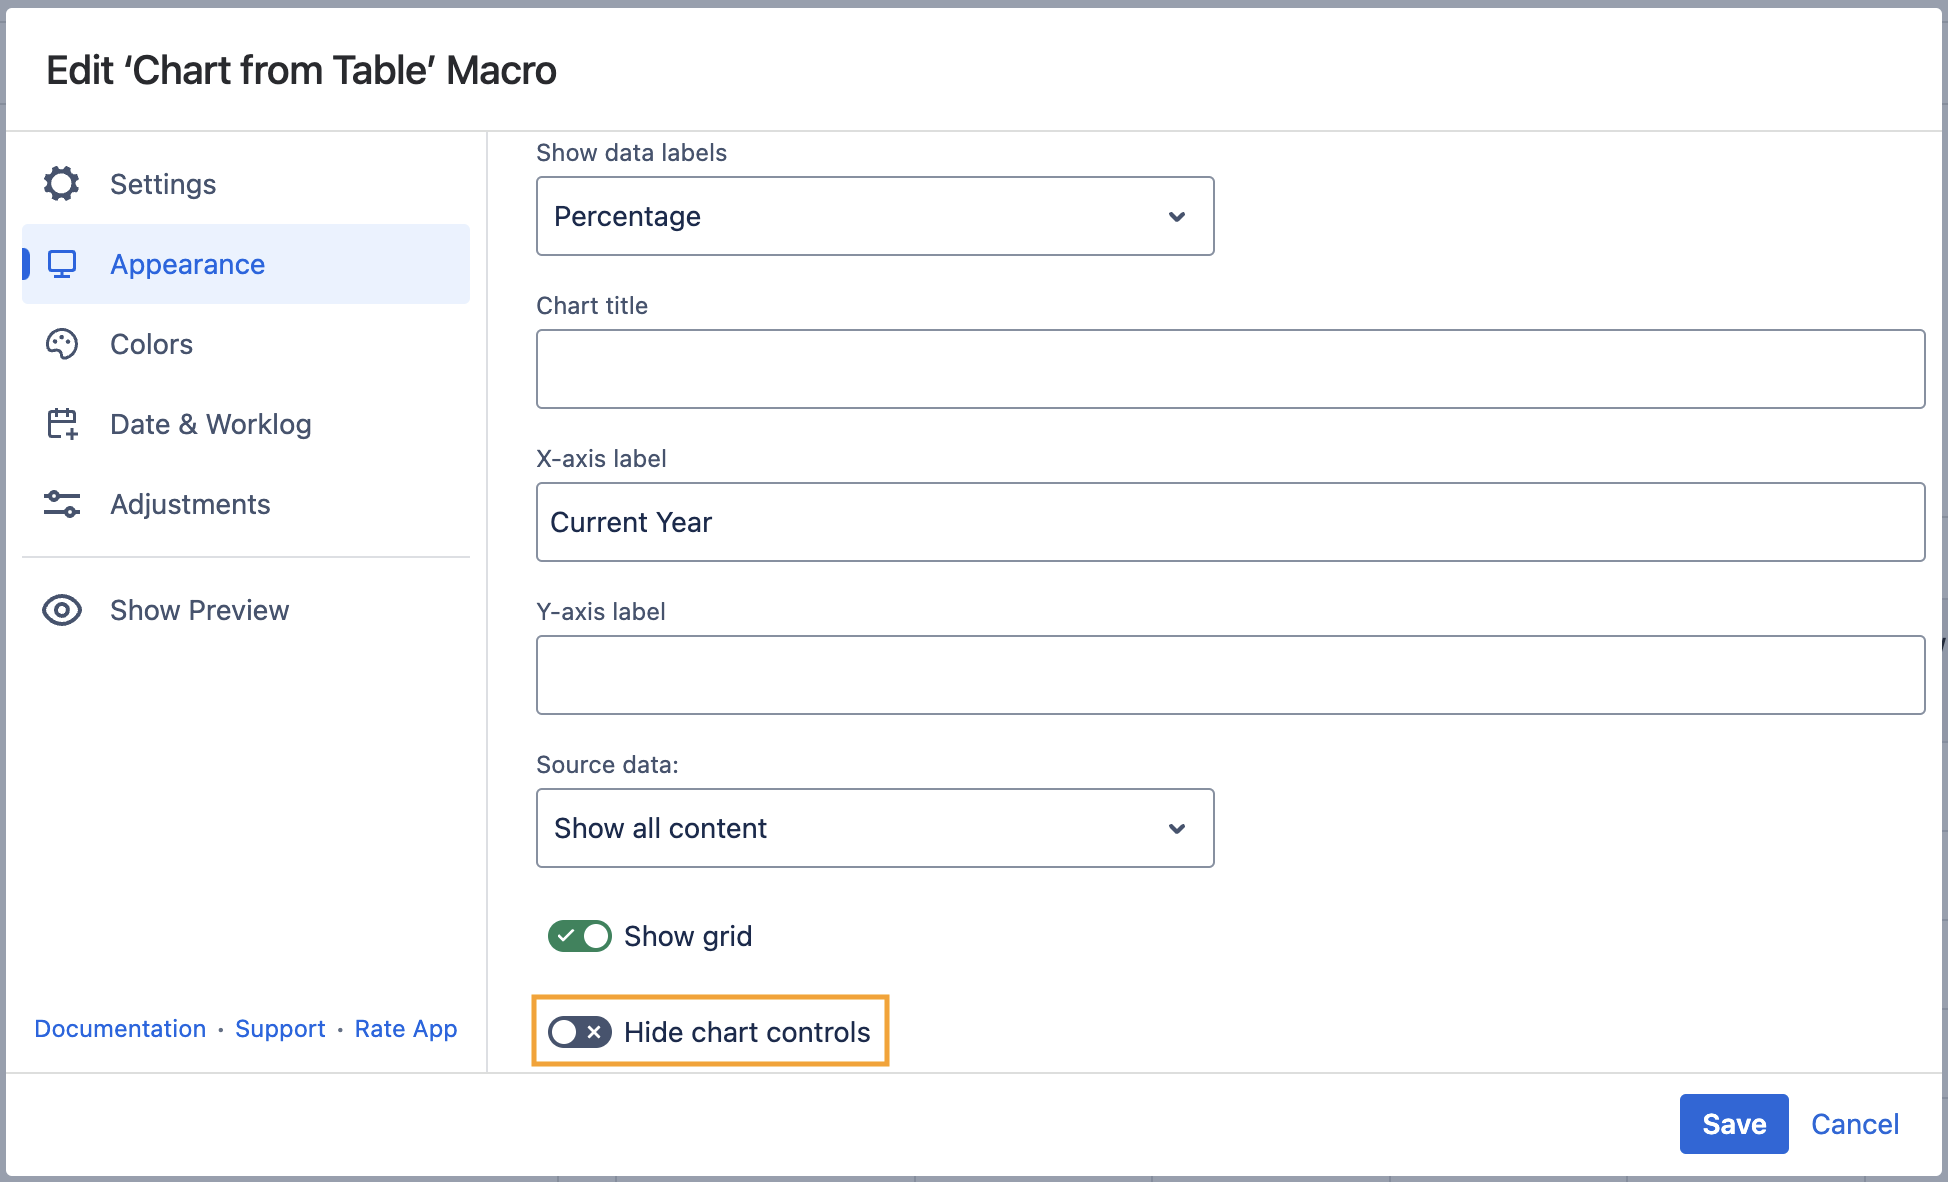
Hide chart controls
- Switch the page to the edit mode.
- Select the macro and click Edit.
- Switch to the Appearance tab.
- Locate and enable the Hide chart controls option.
- Save the macro and the page.
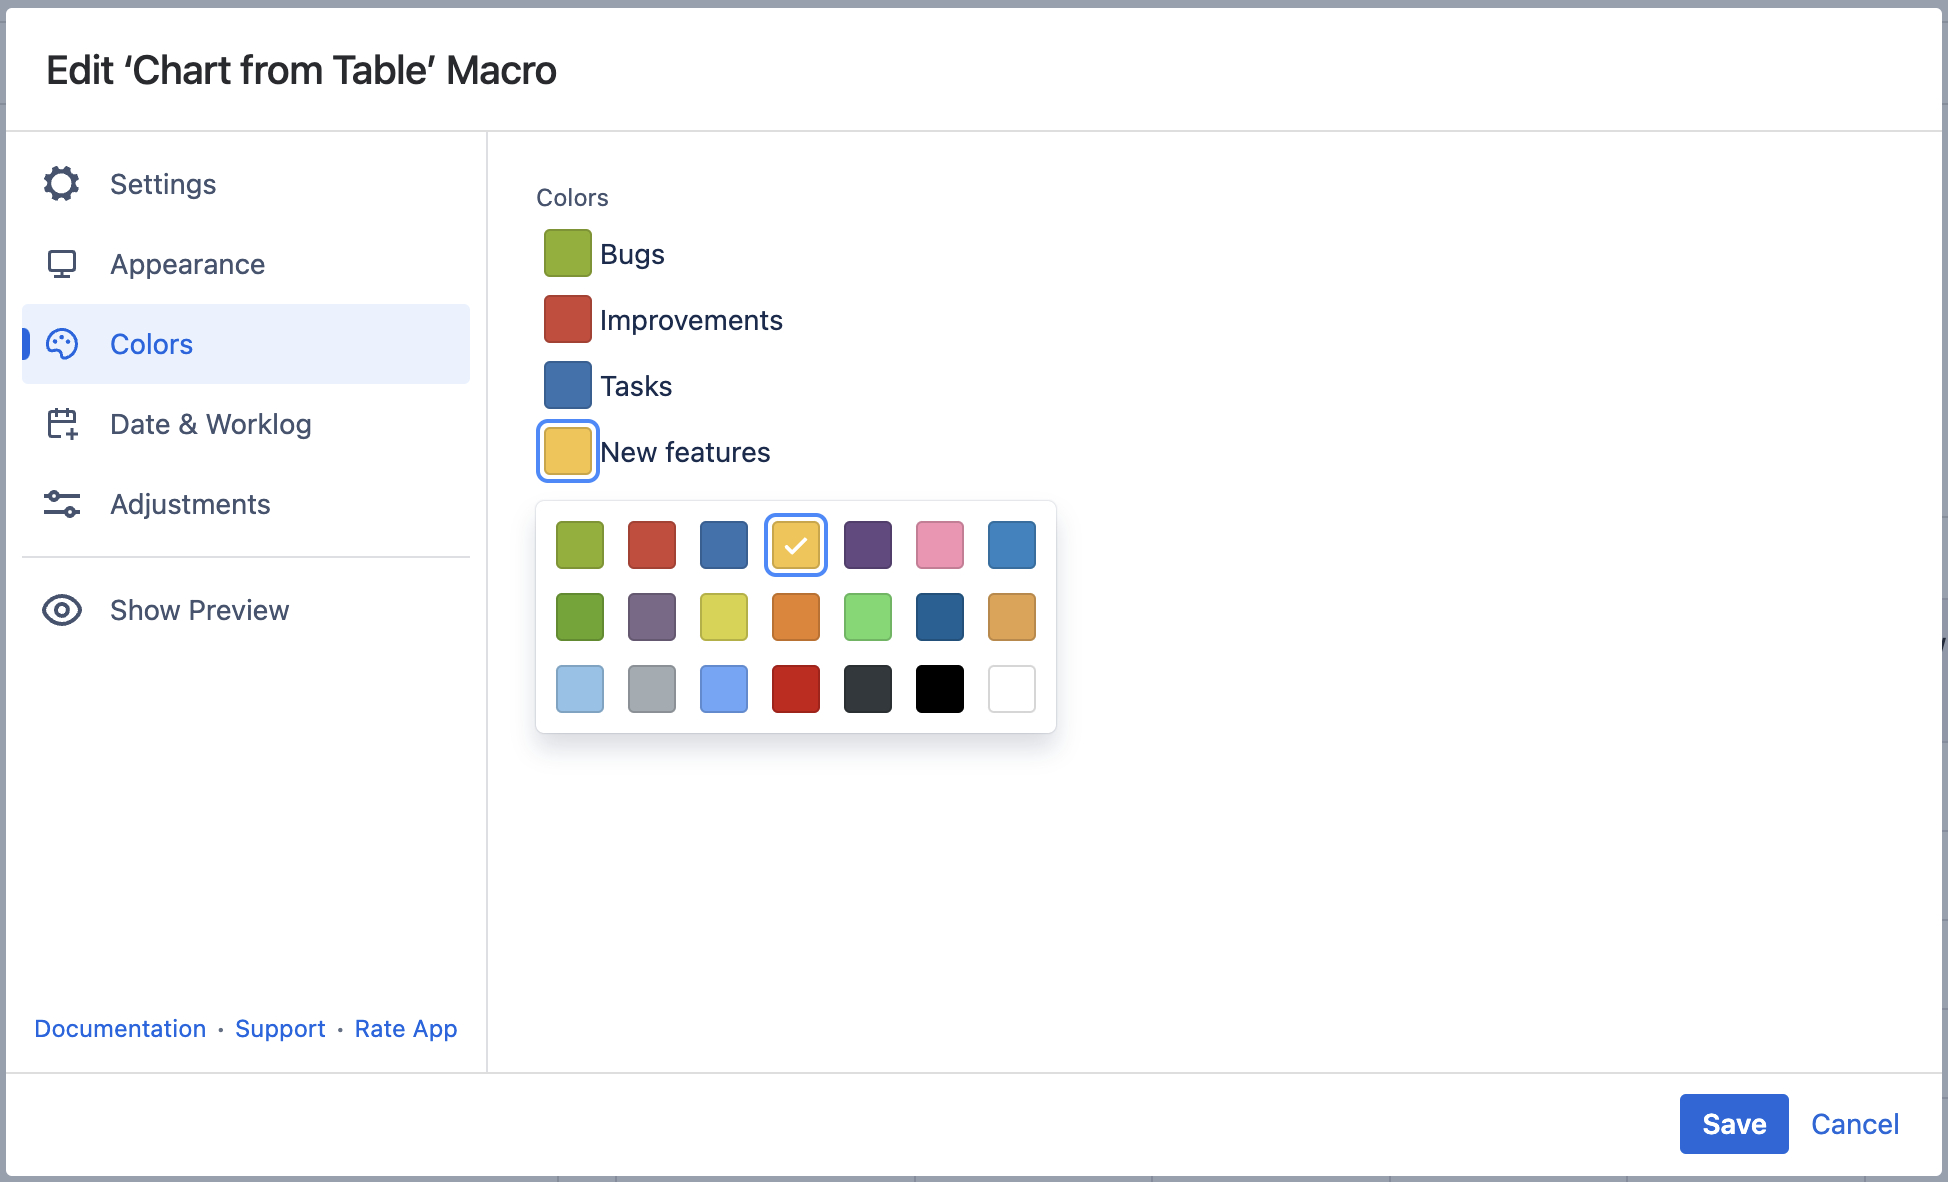
Colors
Set colors
- Switch the page to the edit mode.
- Select the macro and click Edit.
- Switch to the Colors tab.
- Select the appropriate colors for each label.
- Save the macro and the page.
To set the colors in the page view mode:
- Hover over the chart controls on the right of the table.
- Click the cogwheel icon, locate the Select colors option. After selecting colors click Save. The chart will be automatically regenerated.
- To save the modifications in the macro body, click the cogwheel icon and select Save changes.
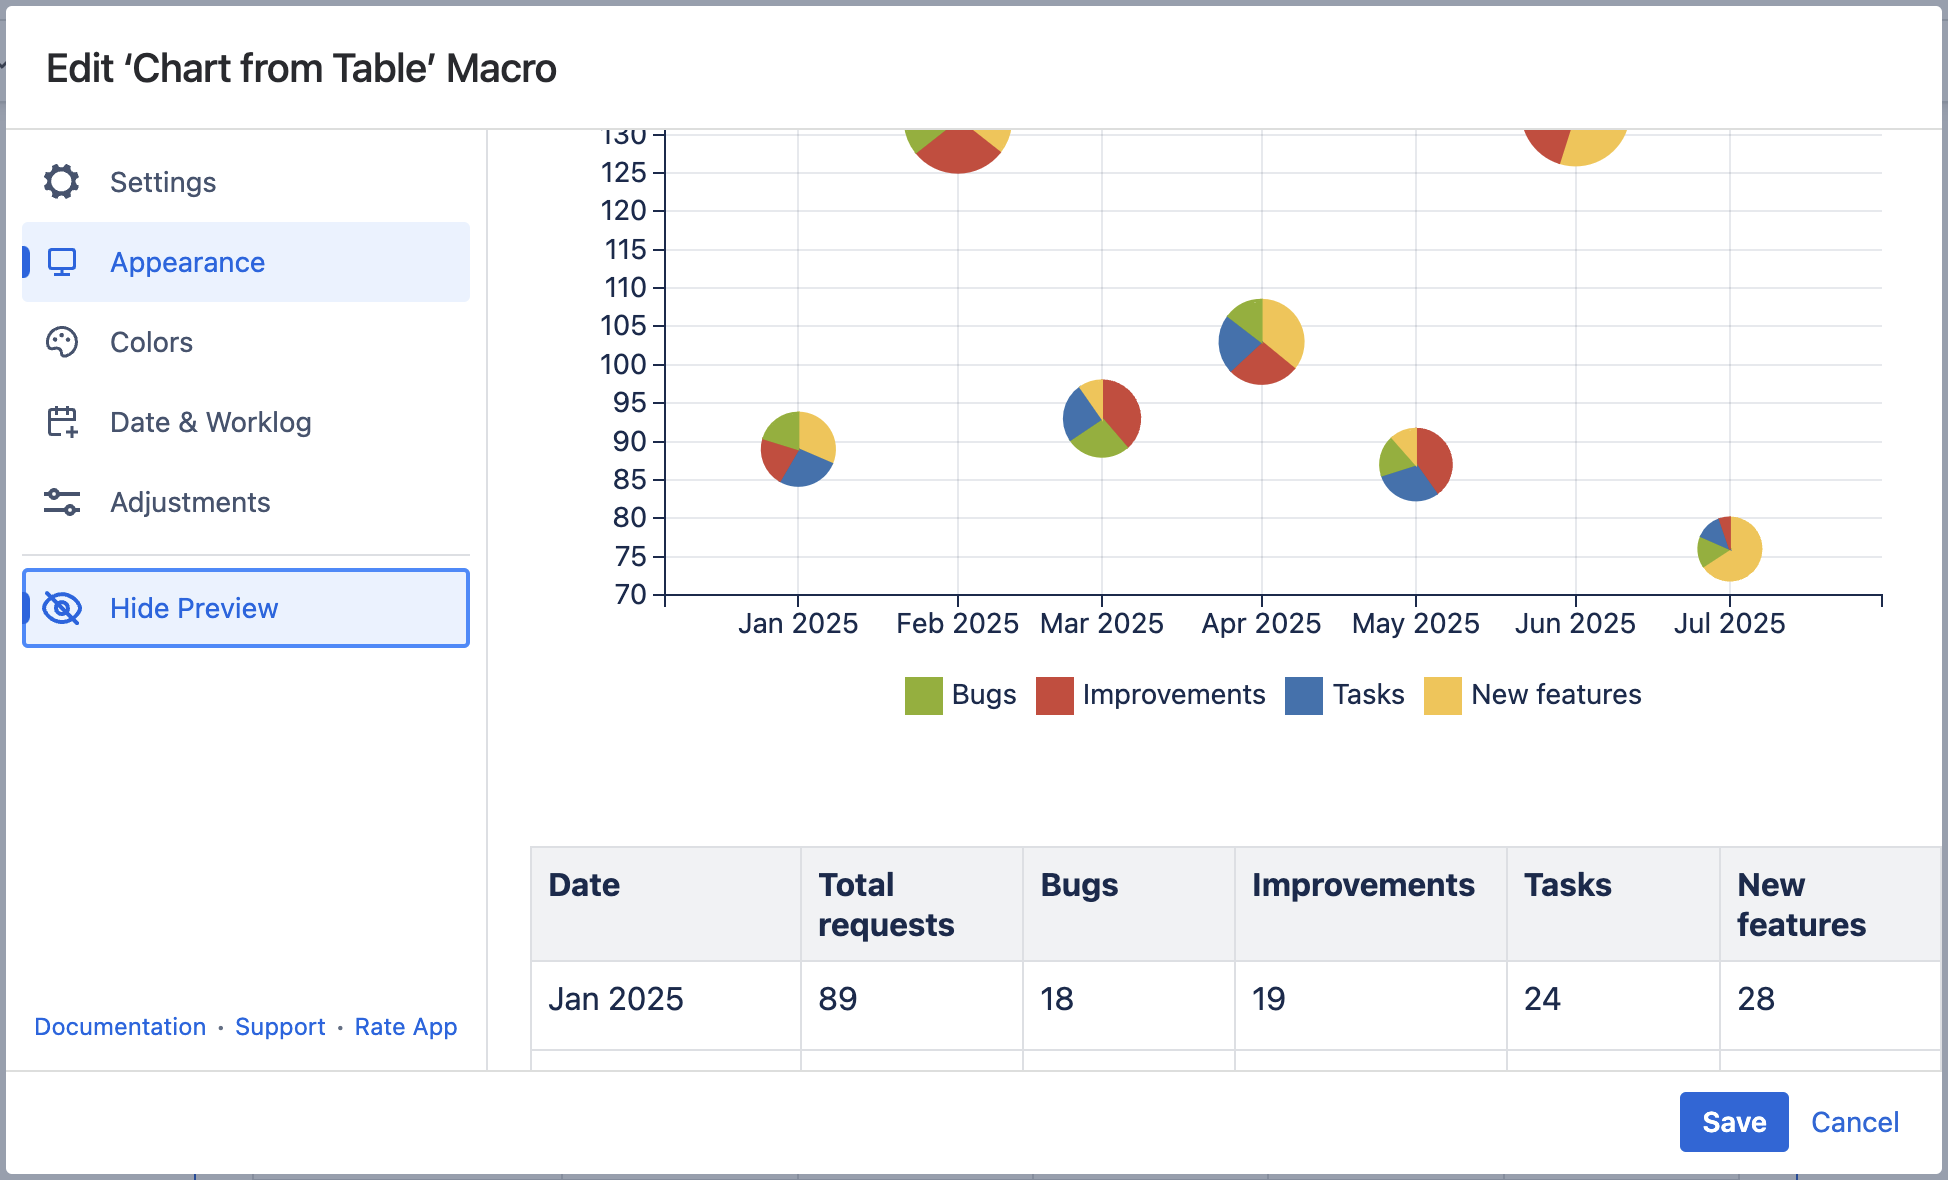
Preview Option
While working in the edit mode, use the Show/hide preview option to adjust the required settings before saving the macro and publishing the page.
Filter the Source Table
- Select one or more chart columns/sectors/bars.
- Only the related rows of the source table are displayed.
- Deselect all the columns/sectors/bars to display the whole source table.