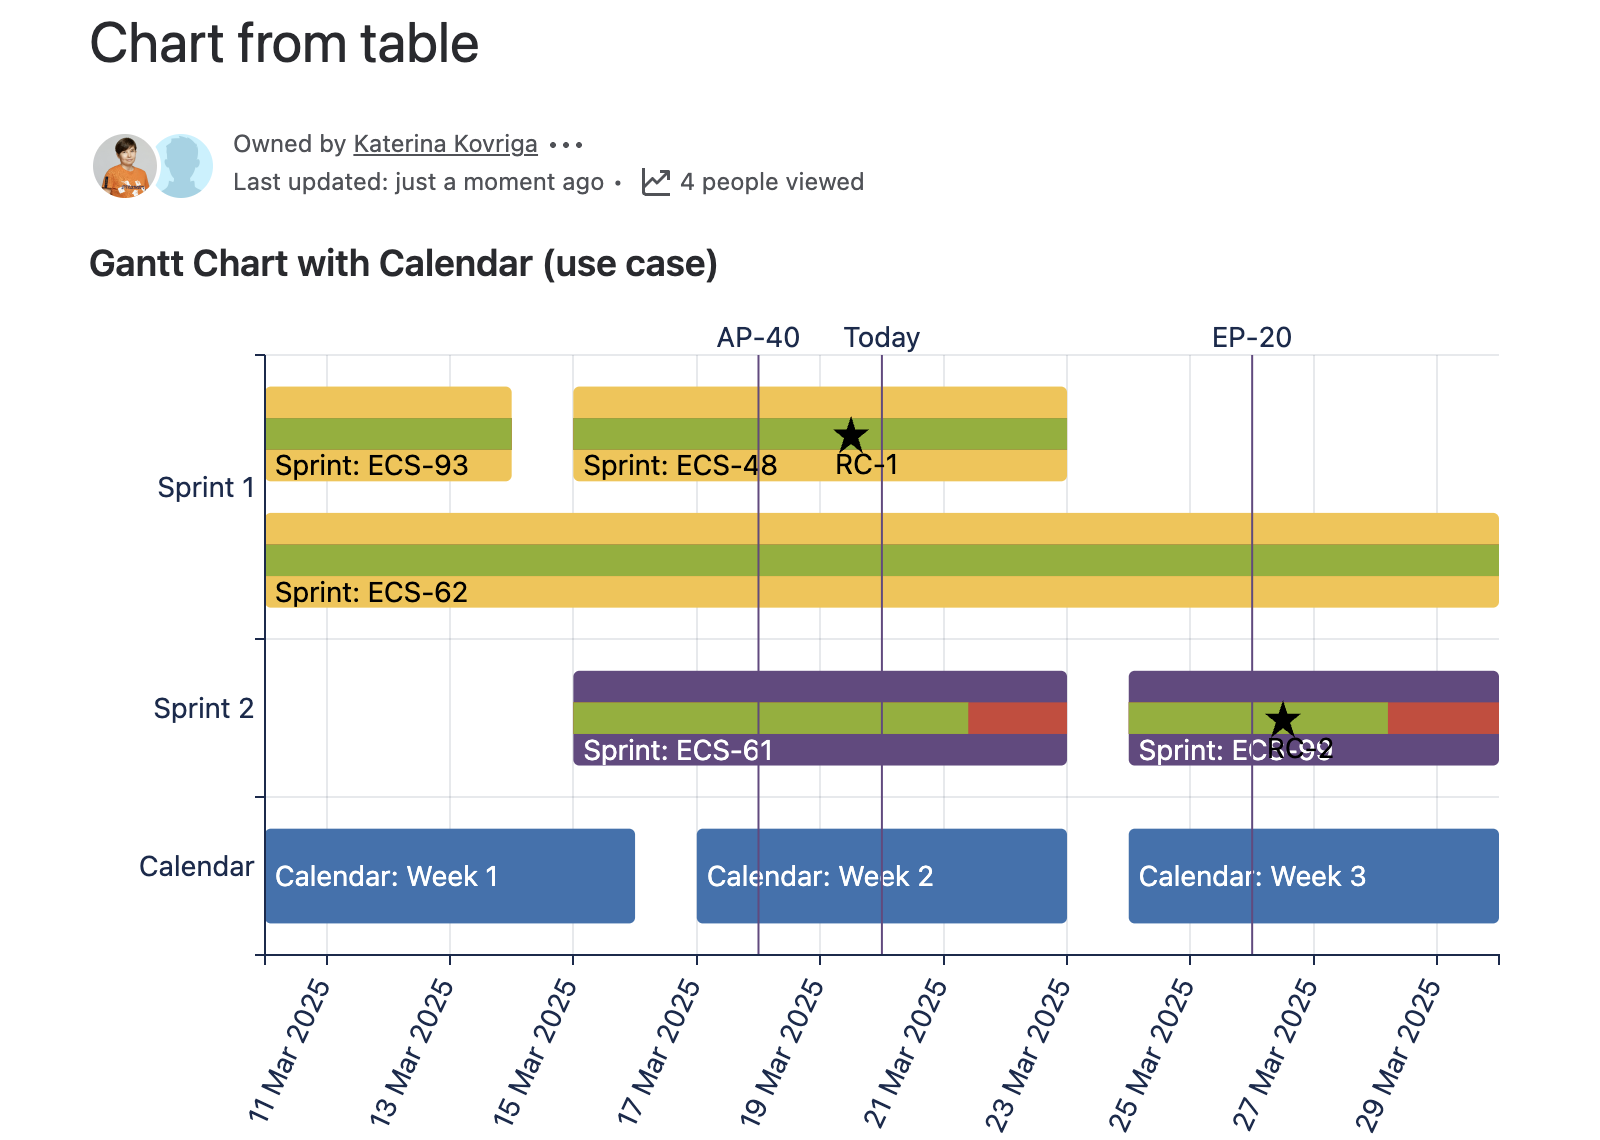
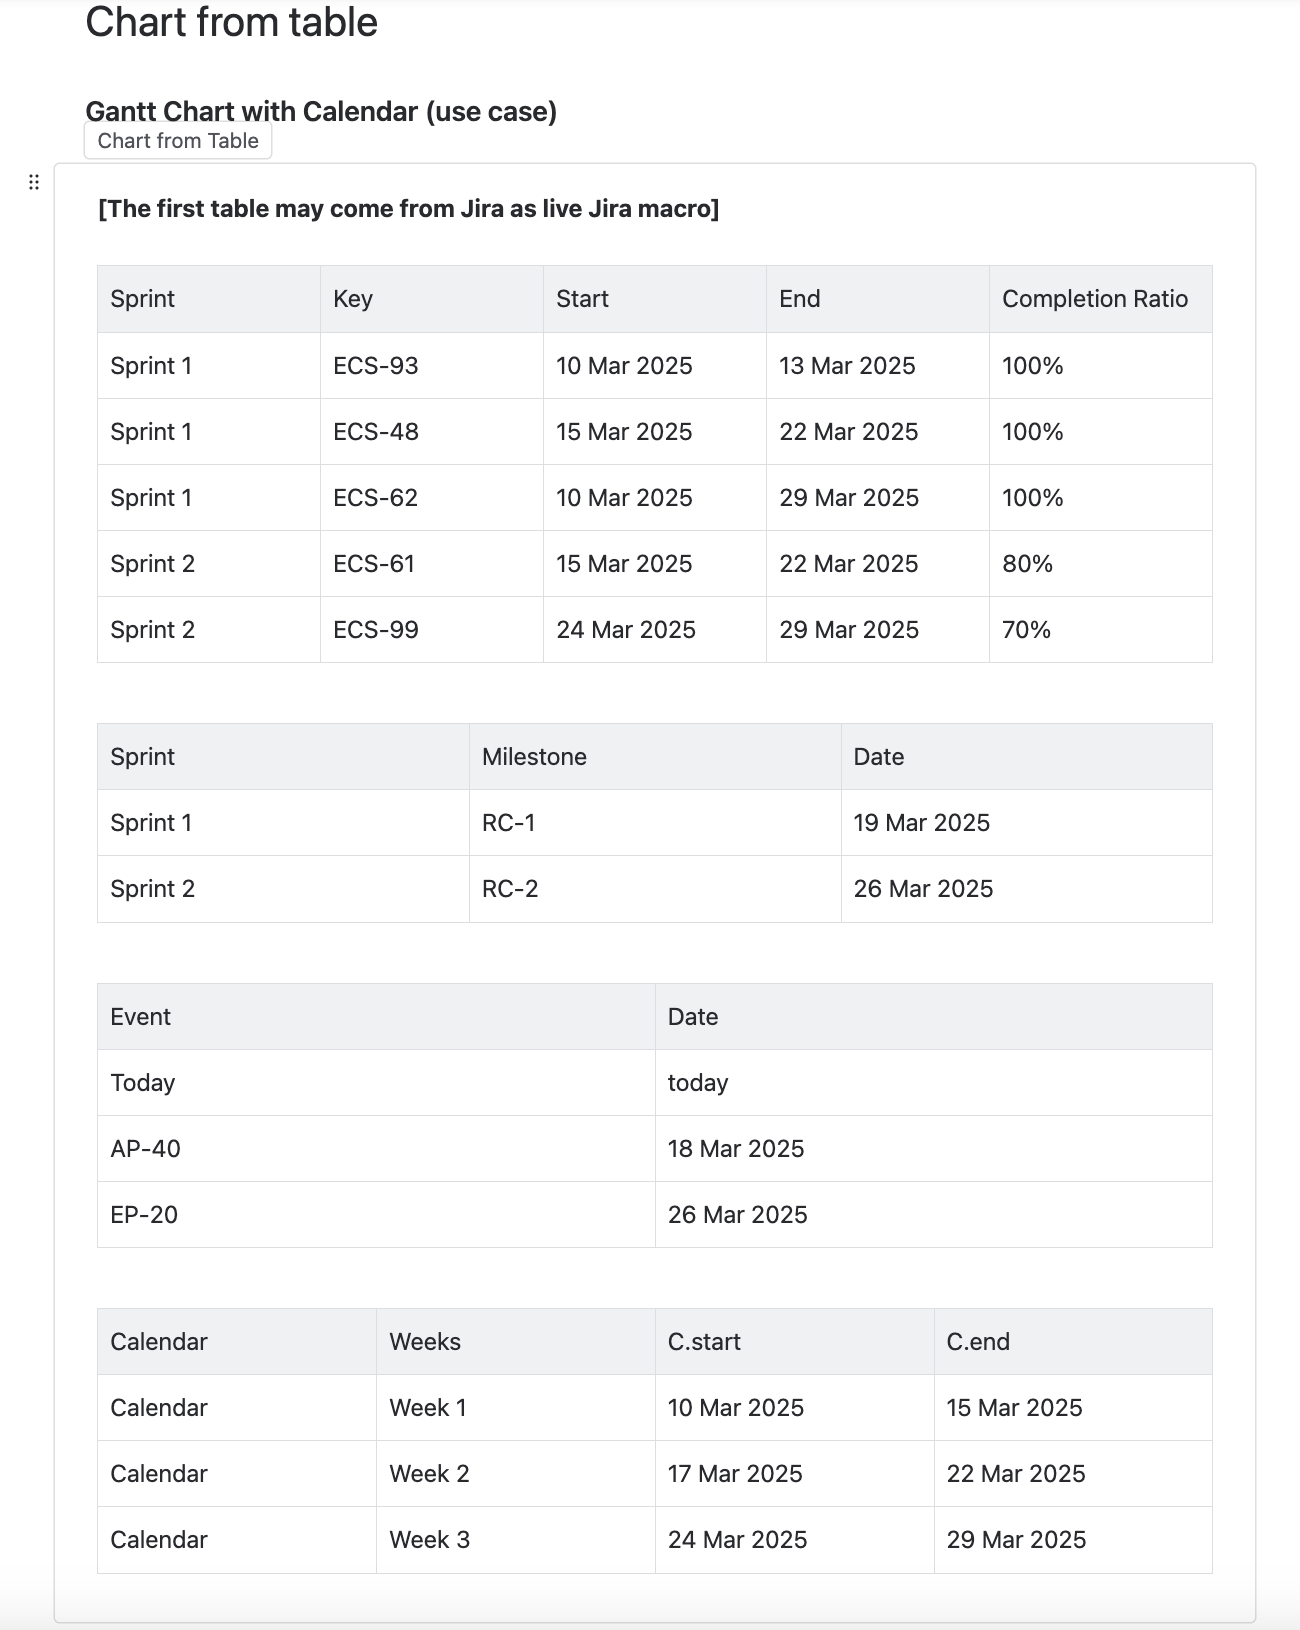
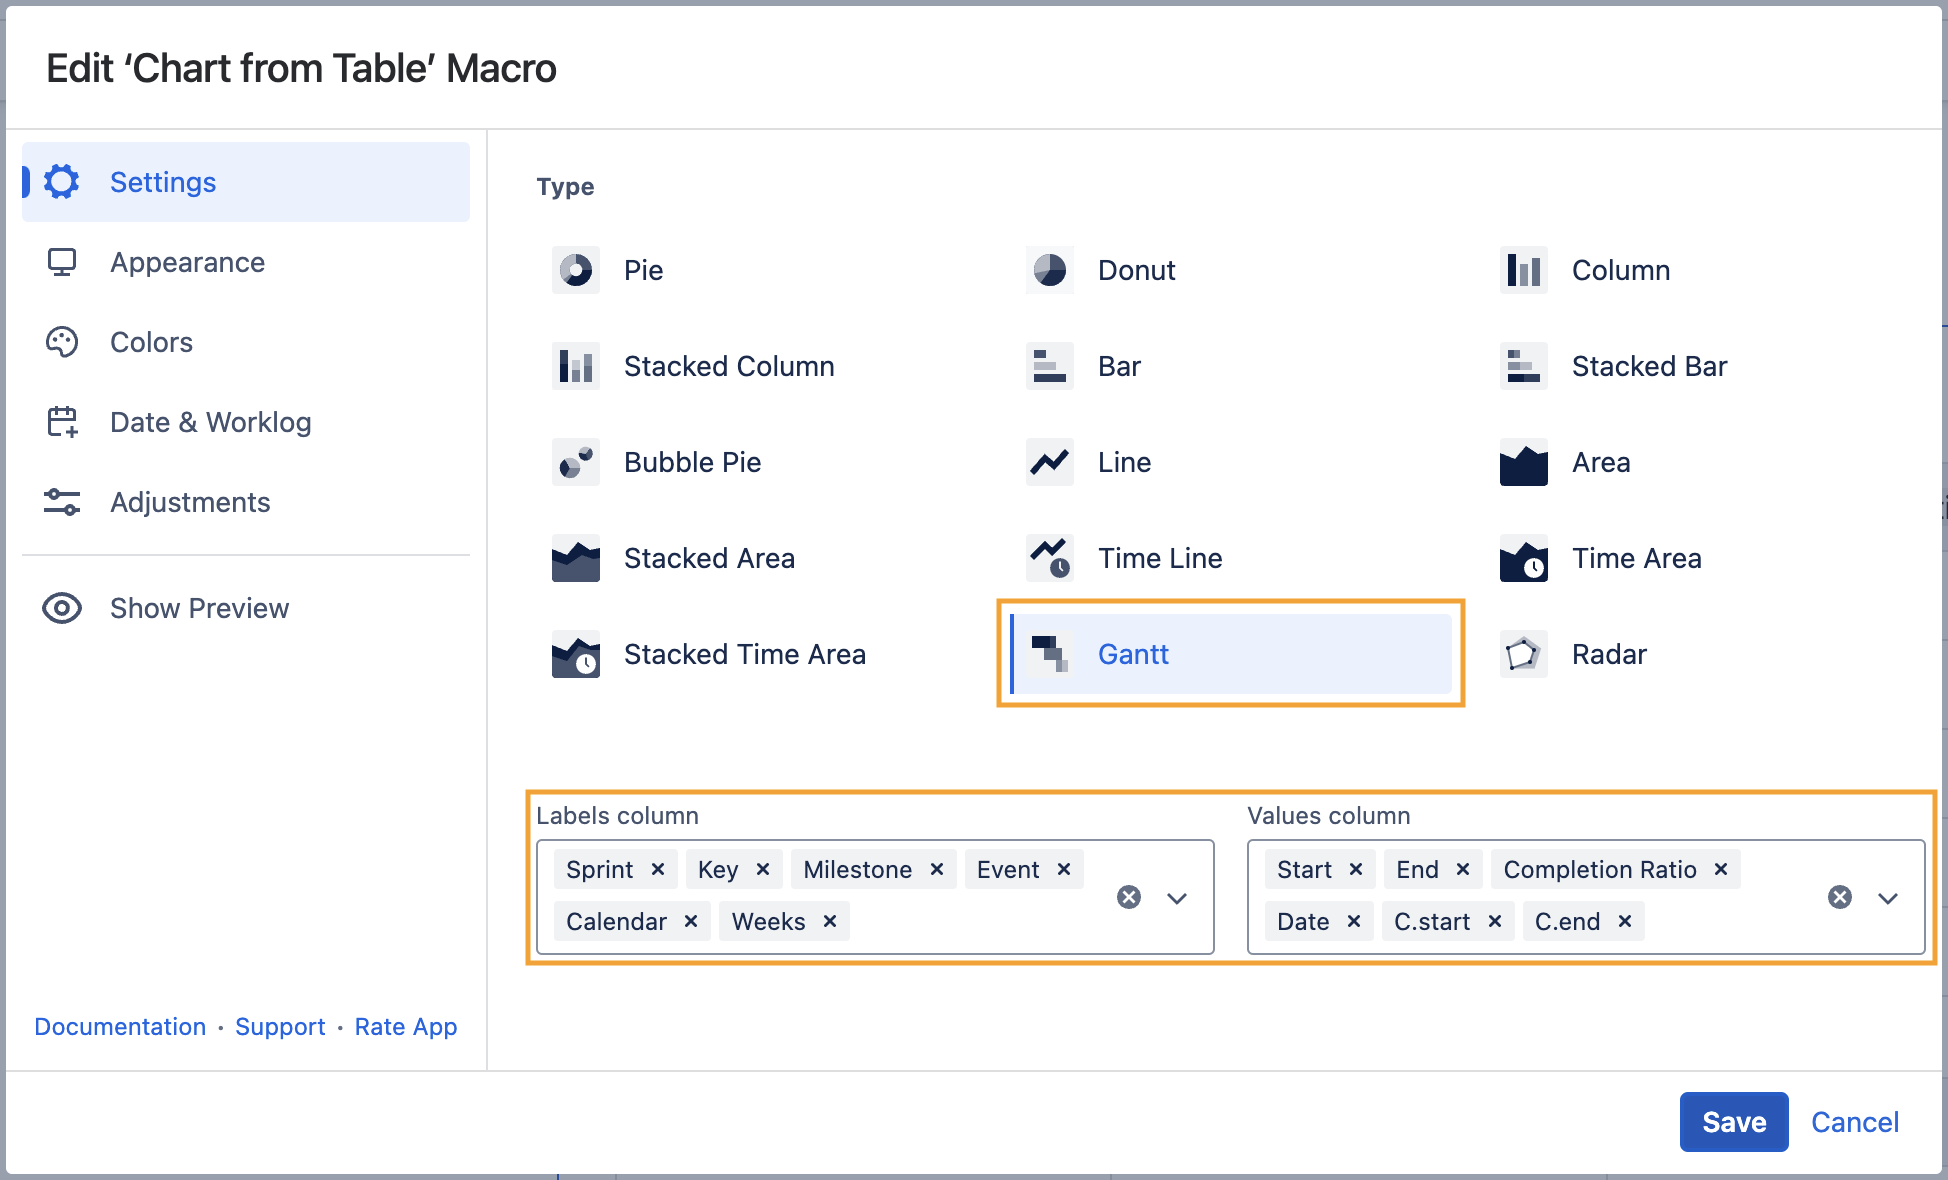
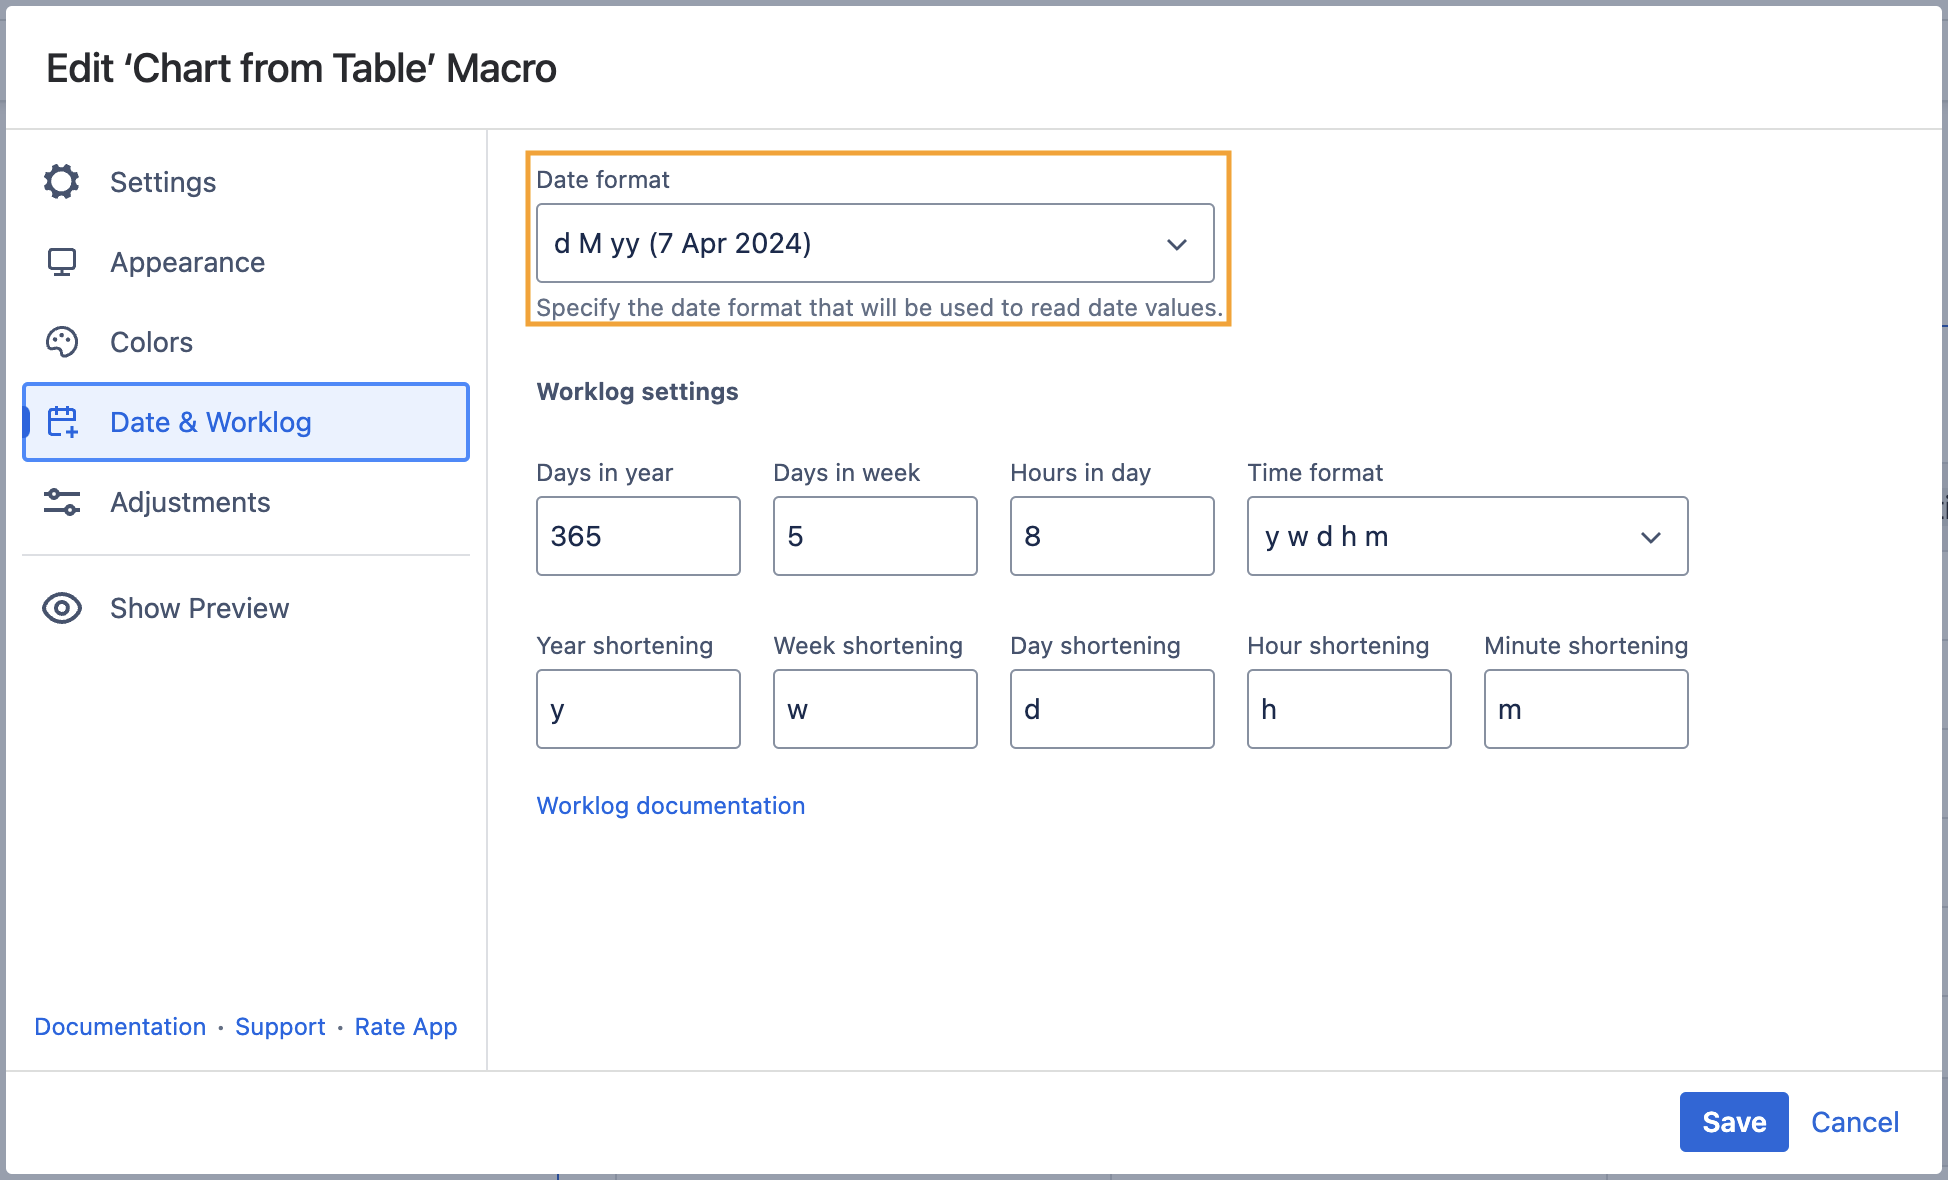
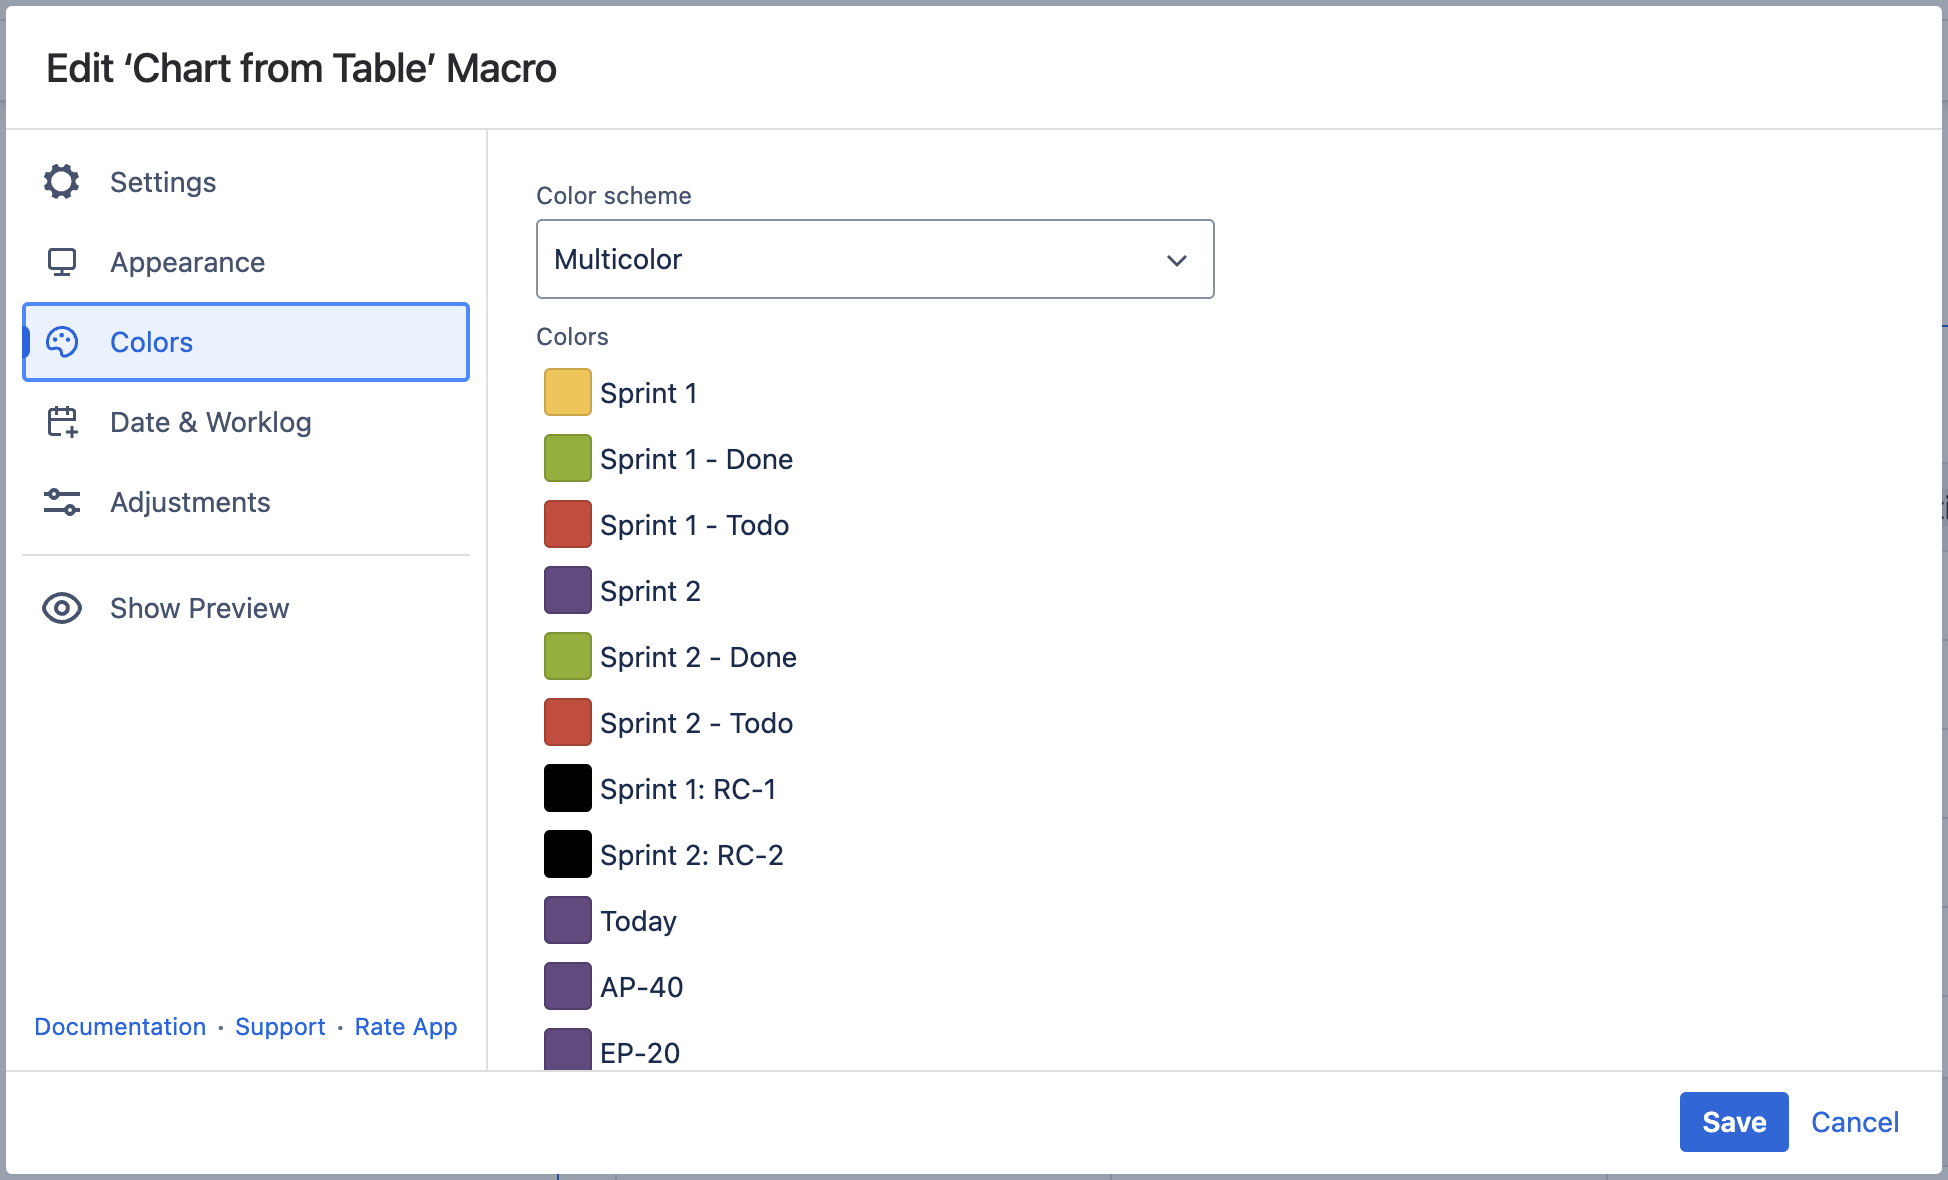
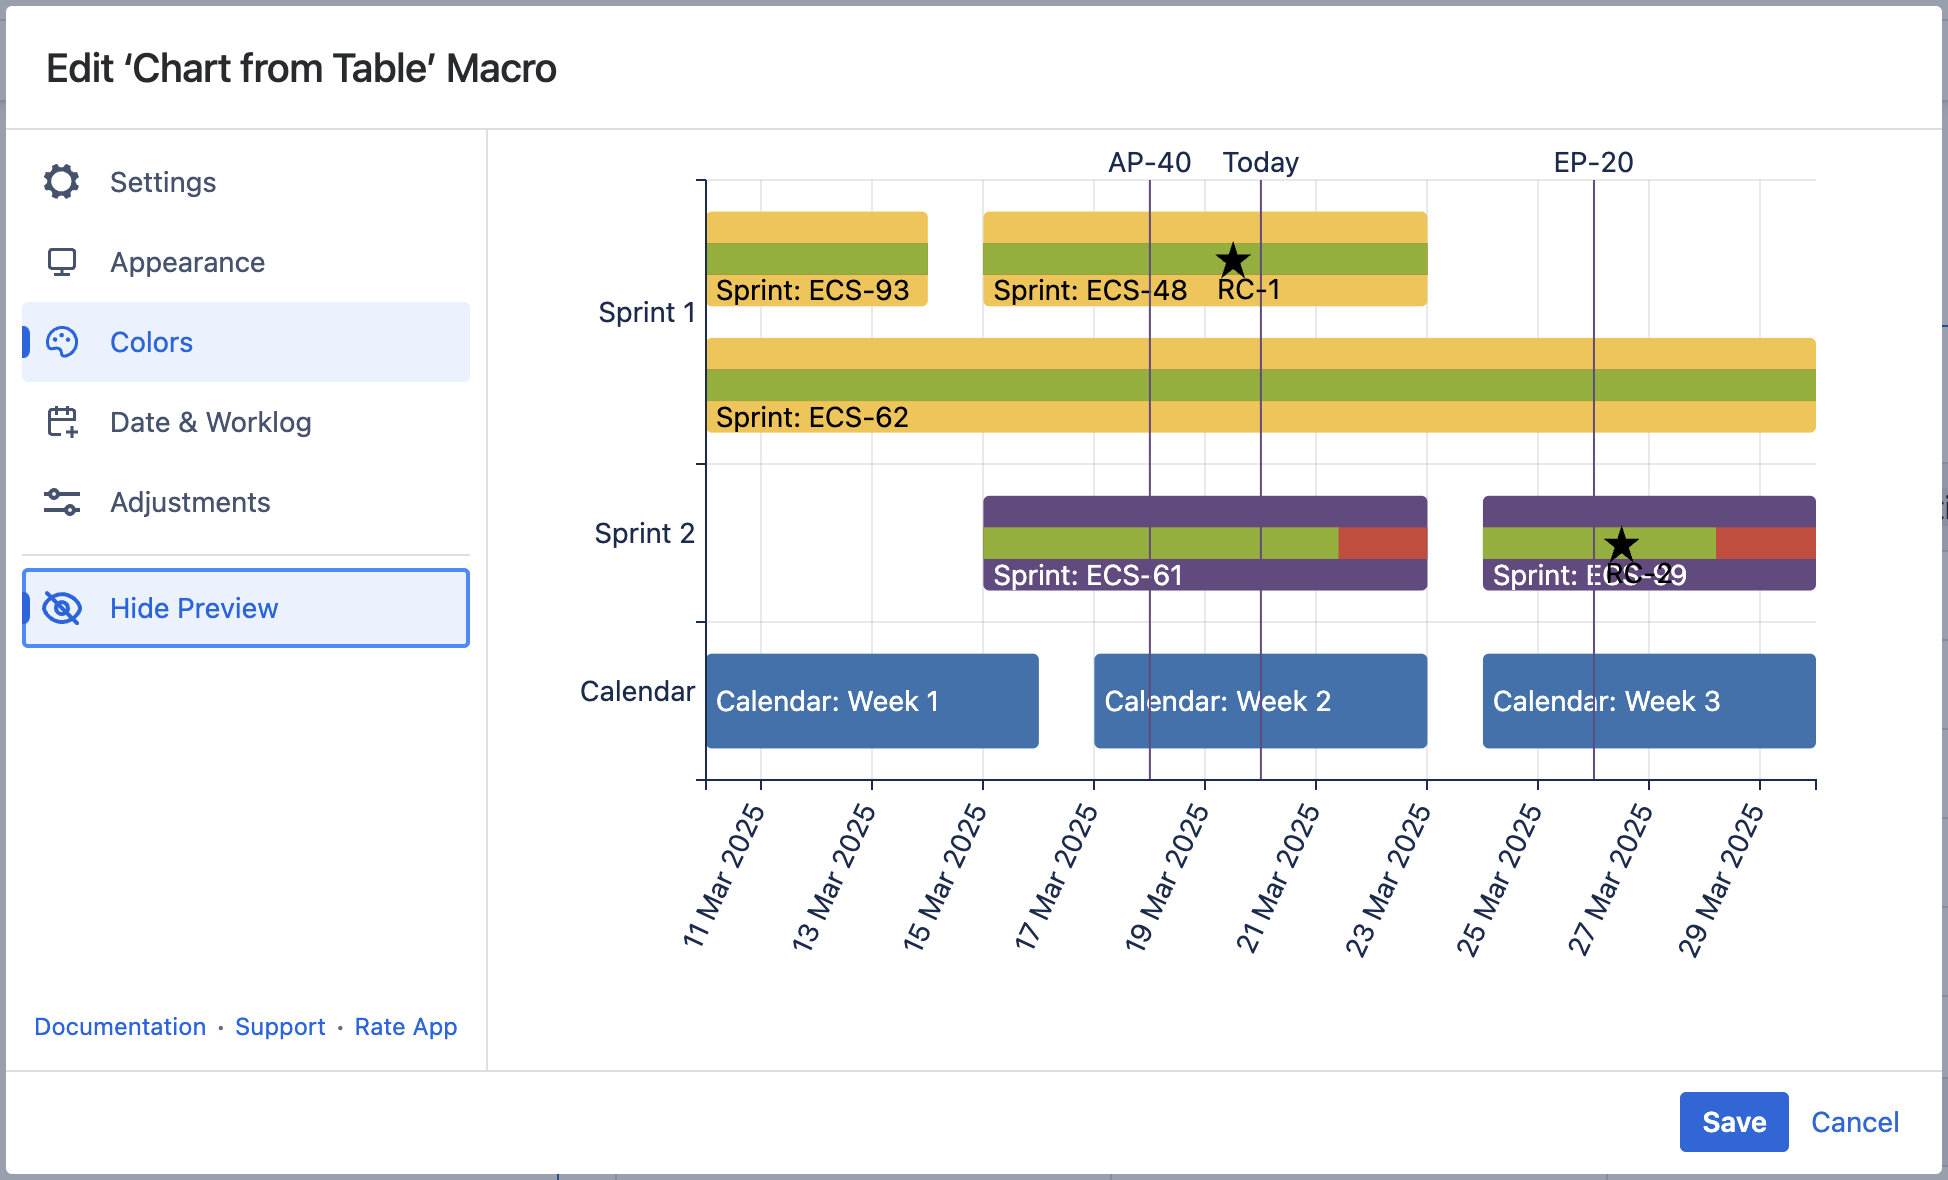
Table Filter, Charts & Spreadsheets for Confluence User guide Chart from Table Current: Gantt chart with calendar (use case) PDF Download PDF Download page Gantt chart with calendar (use case). Current page All pages Gantt chart with calendar (use case) You can build a Gantt chart with calendar with the help of the Gantt chart type. Use caseYou need to create a Gantt chart with calendar (to show working days by weeks at the bottom of the chart). Source tableYour source tables look like the tables below. The first one can be manually created or come from Jira (you can use the Jira Issues macro, we mean). SprintKeyStartEndCompletion RatioSprint 1ECS-9310 Mar 202513 Mar 2025100%Sprint 1ECS-4815 Mar 202522 Mar 2025100%Sprint 1ECS-6210 Mar 202529 Mar 2025100%Sprint 2ECS-6115 Mar 202522 Mar 202580%Sprint 2ECS-9924 Mar 202529 Mar 202570% SprintMilestoneDateSprint 1RC-119 Mar 2025Sprint 2RC-226 Mar 2025 EventDateTodaytodayAP-4018 Mar 2025EP-2026 Mar 2025 CalendarWeeksC.startC.endCalendarWeek 110 Mar 202515 Mar 2025CalendarWeek 217 Mar 202522 Mar 2025CalendarWeek 324 Mar 202529 Mar 2025 Solution Wrap all the source tables (and Jira macros) with the Chart from Table macro. Choose the Gantt chart type. Set the required Labels and Values columns.Specify the correct Date format and other options if needed. ×