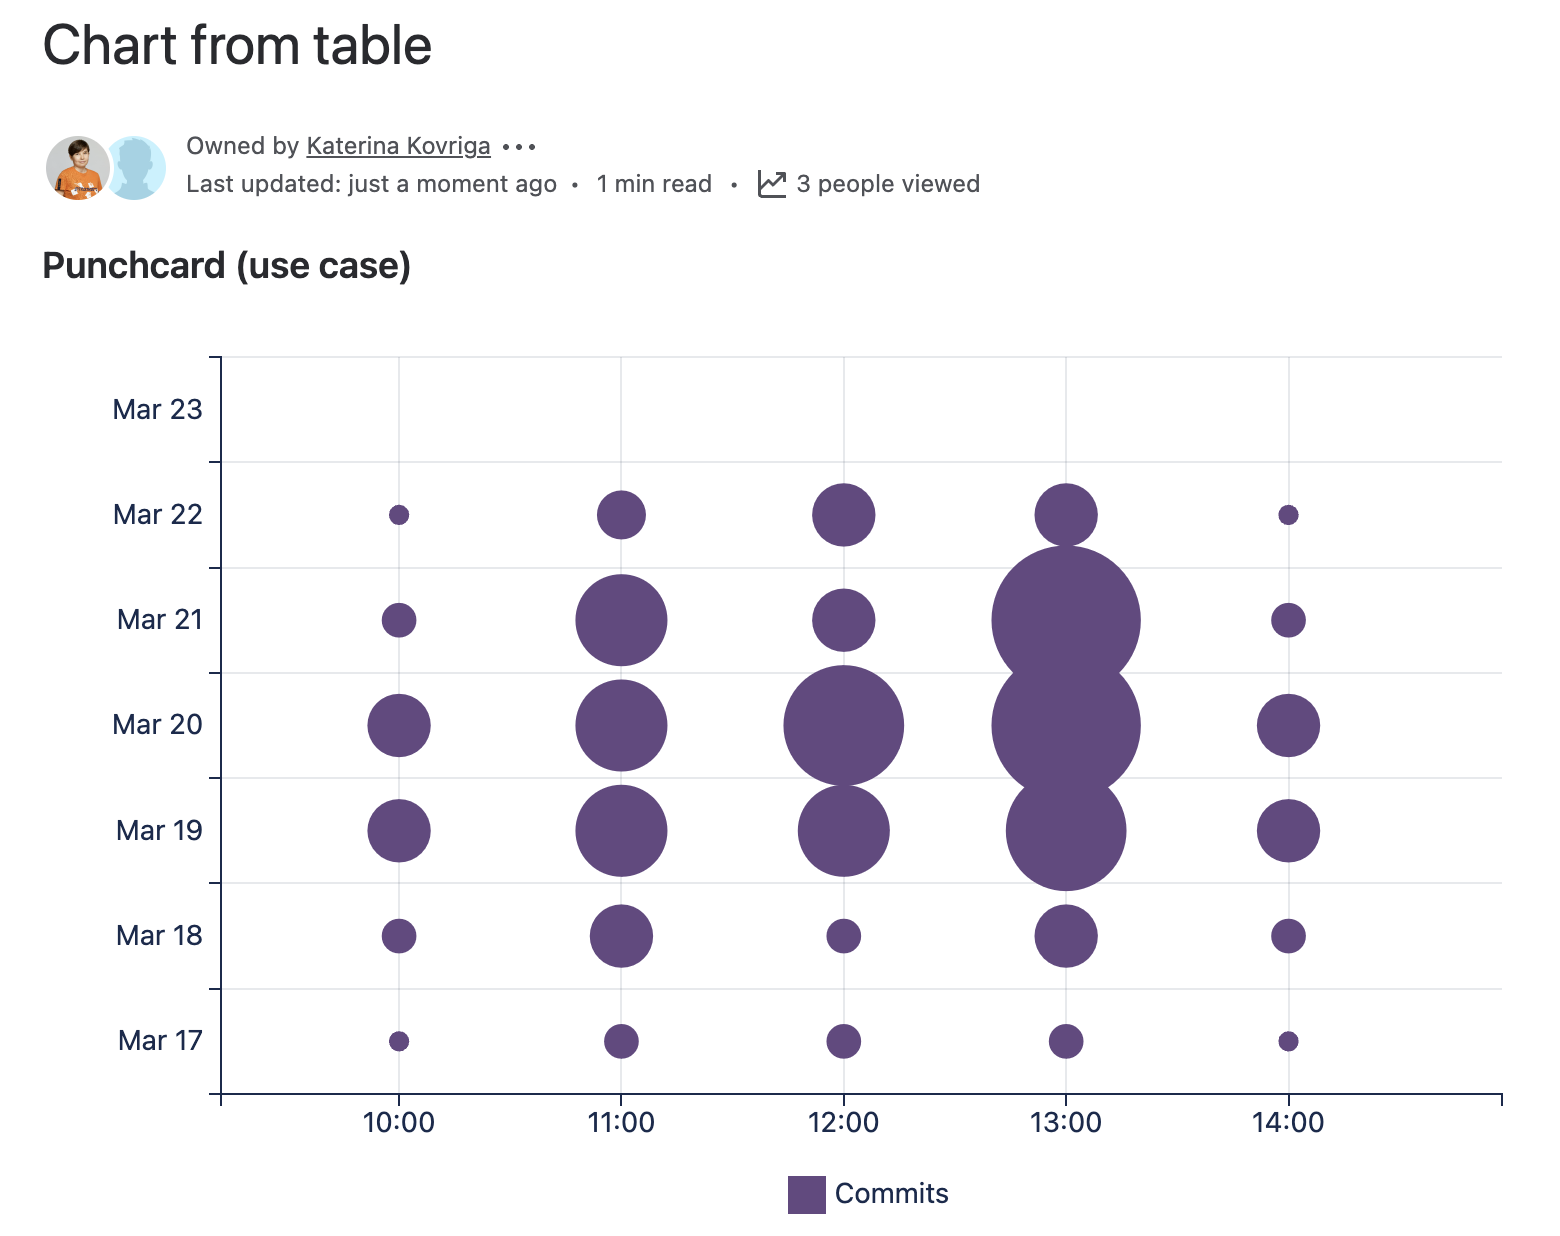
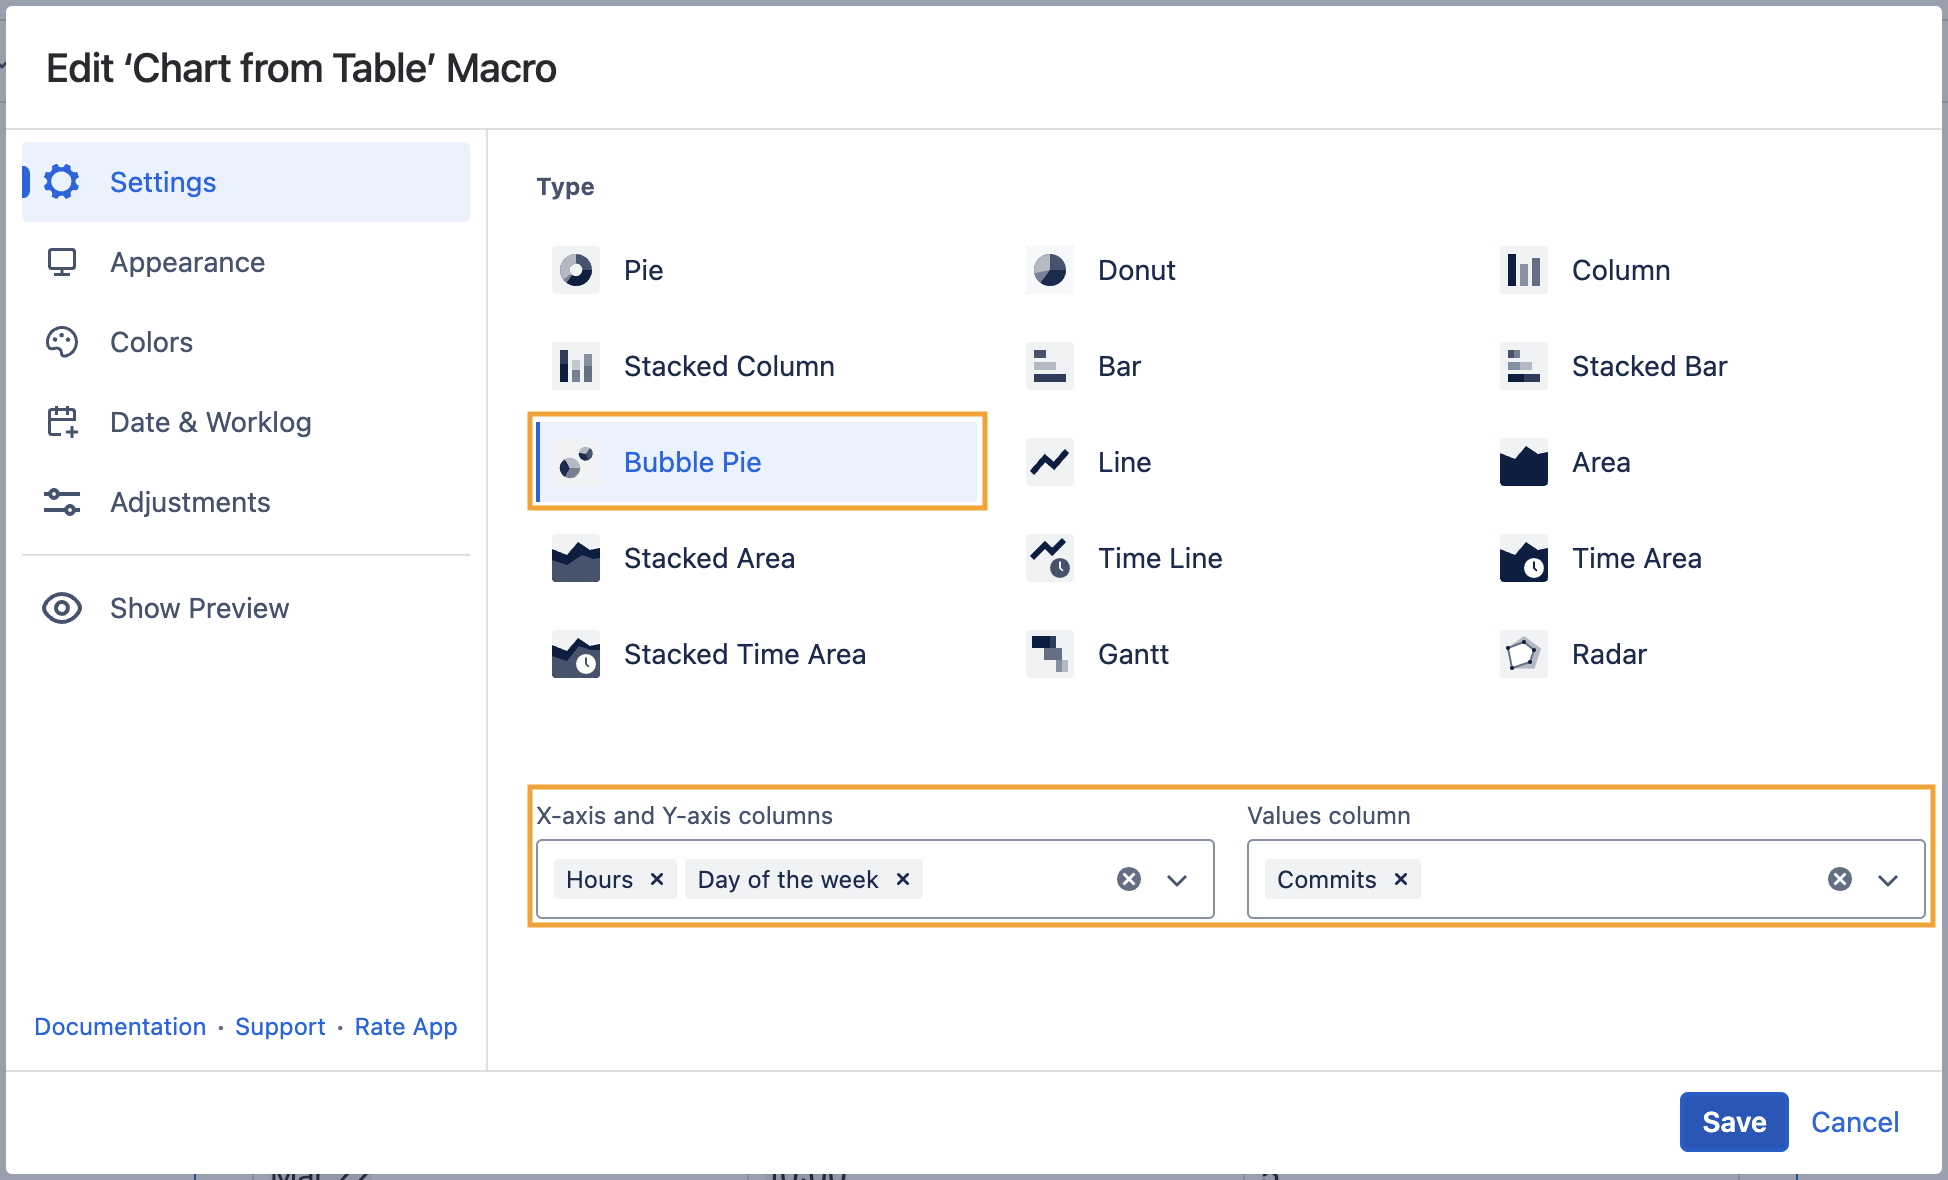
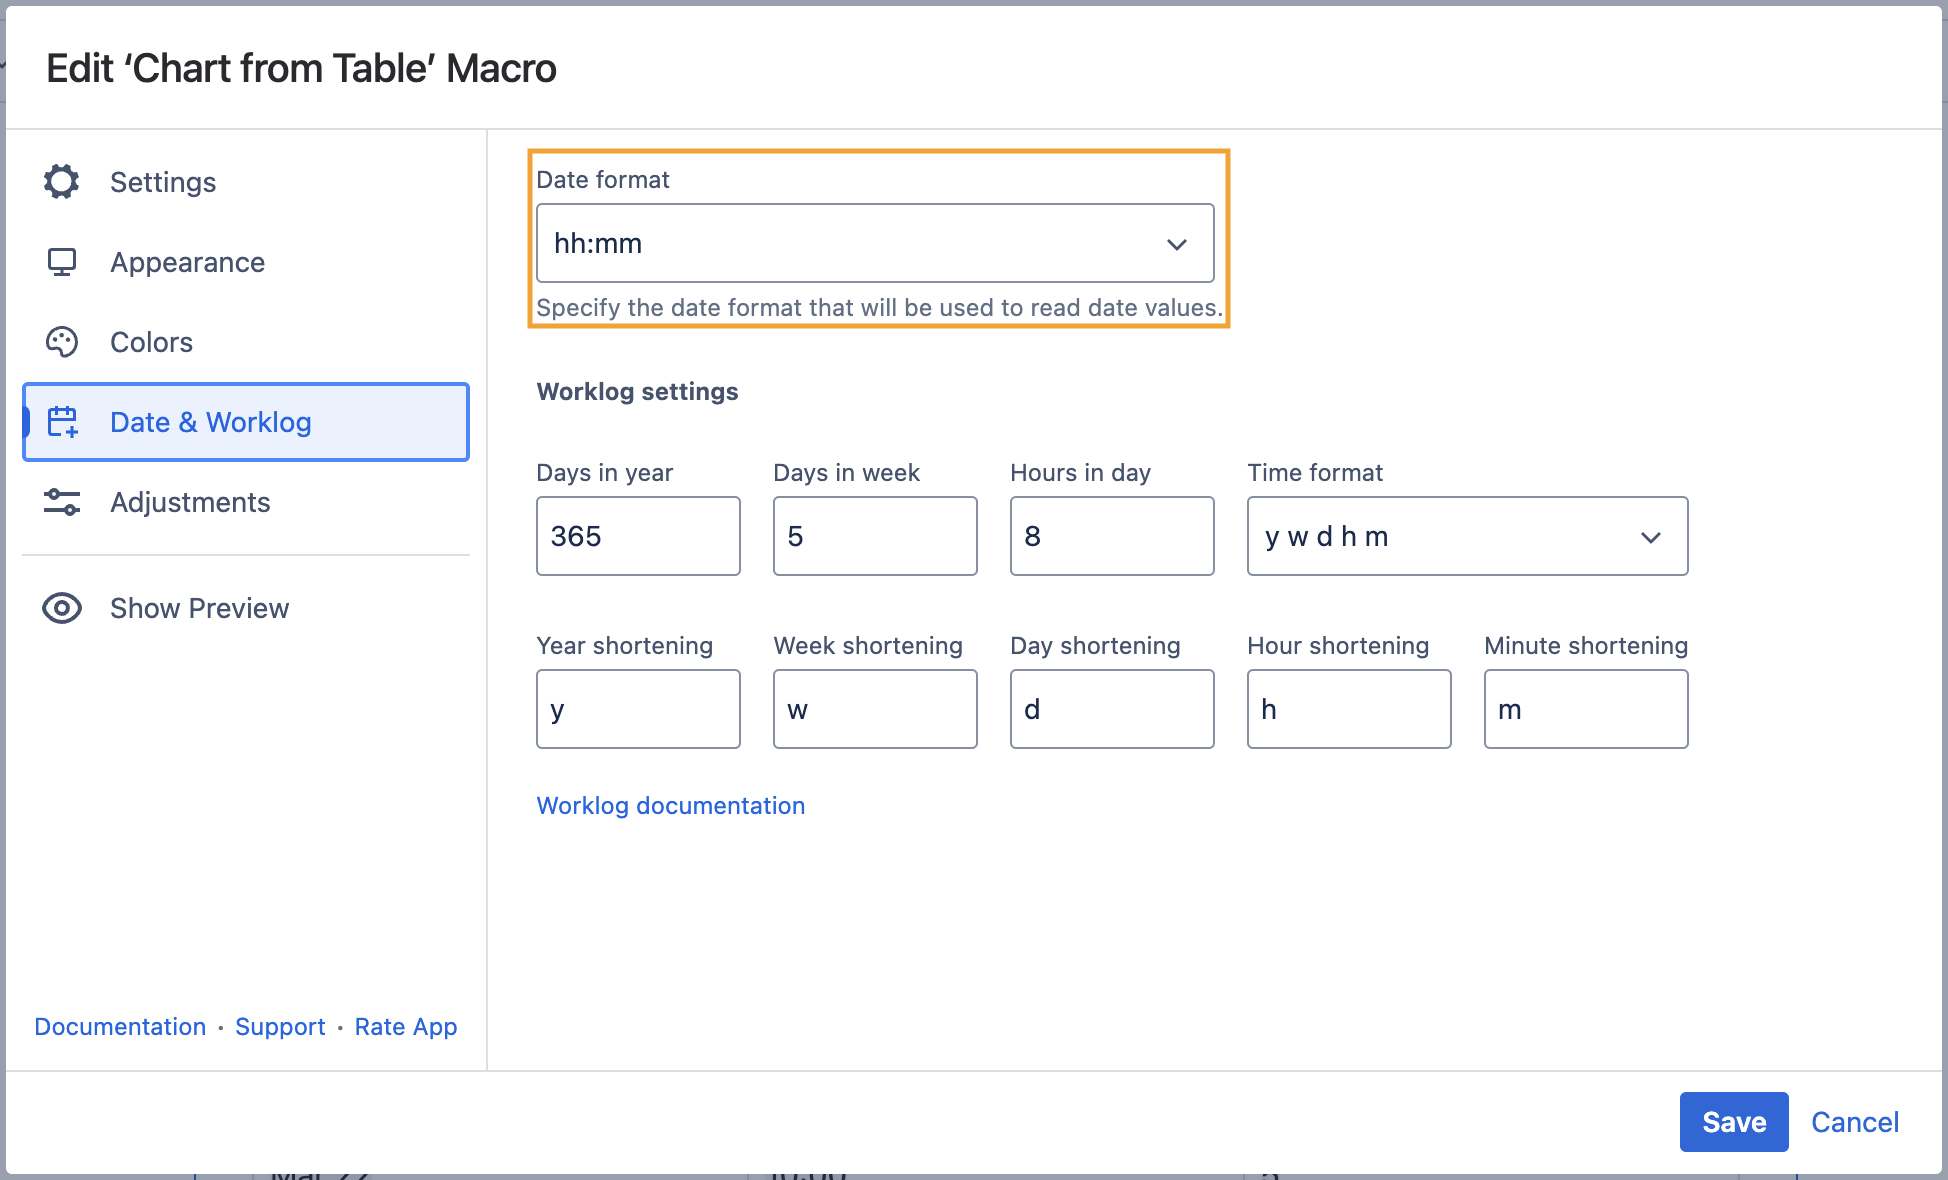
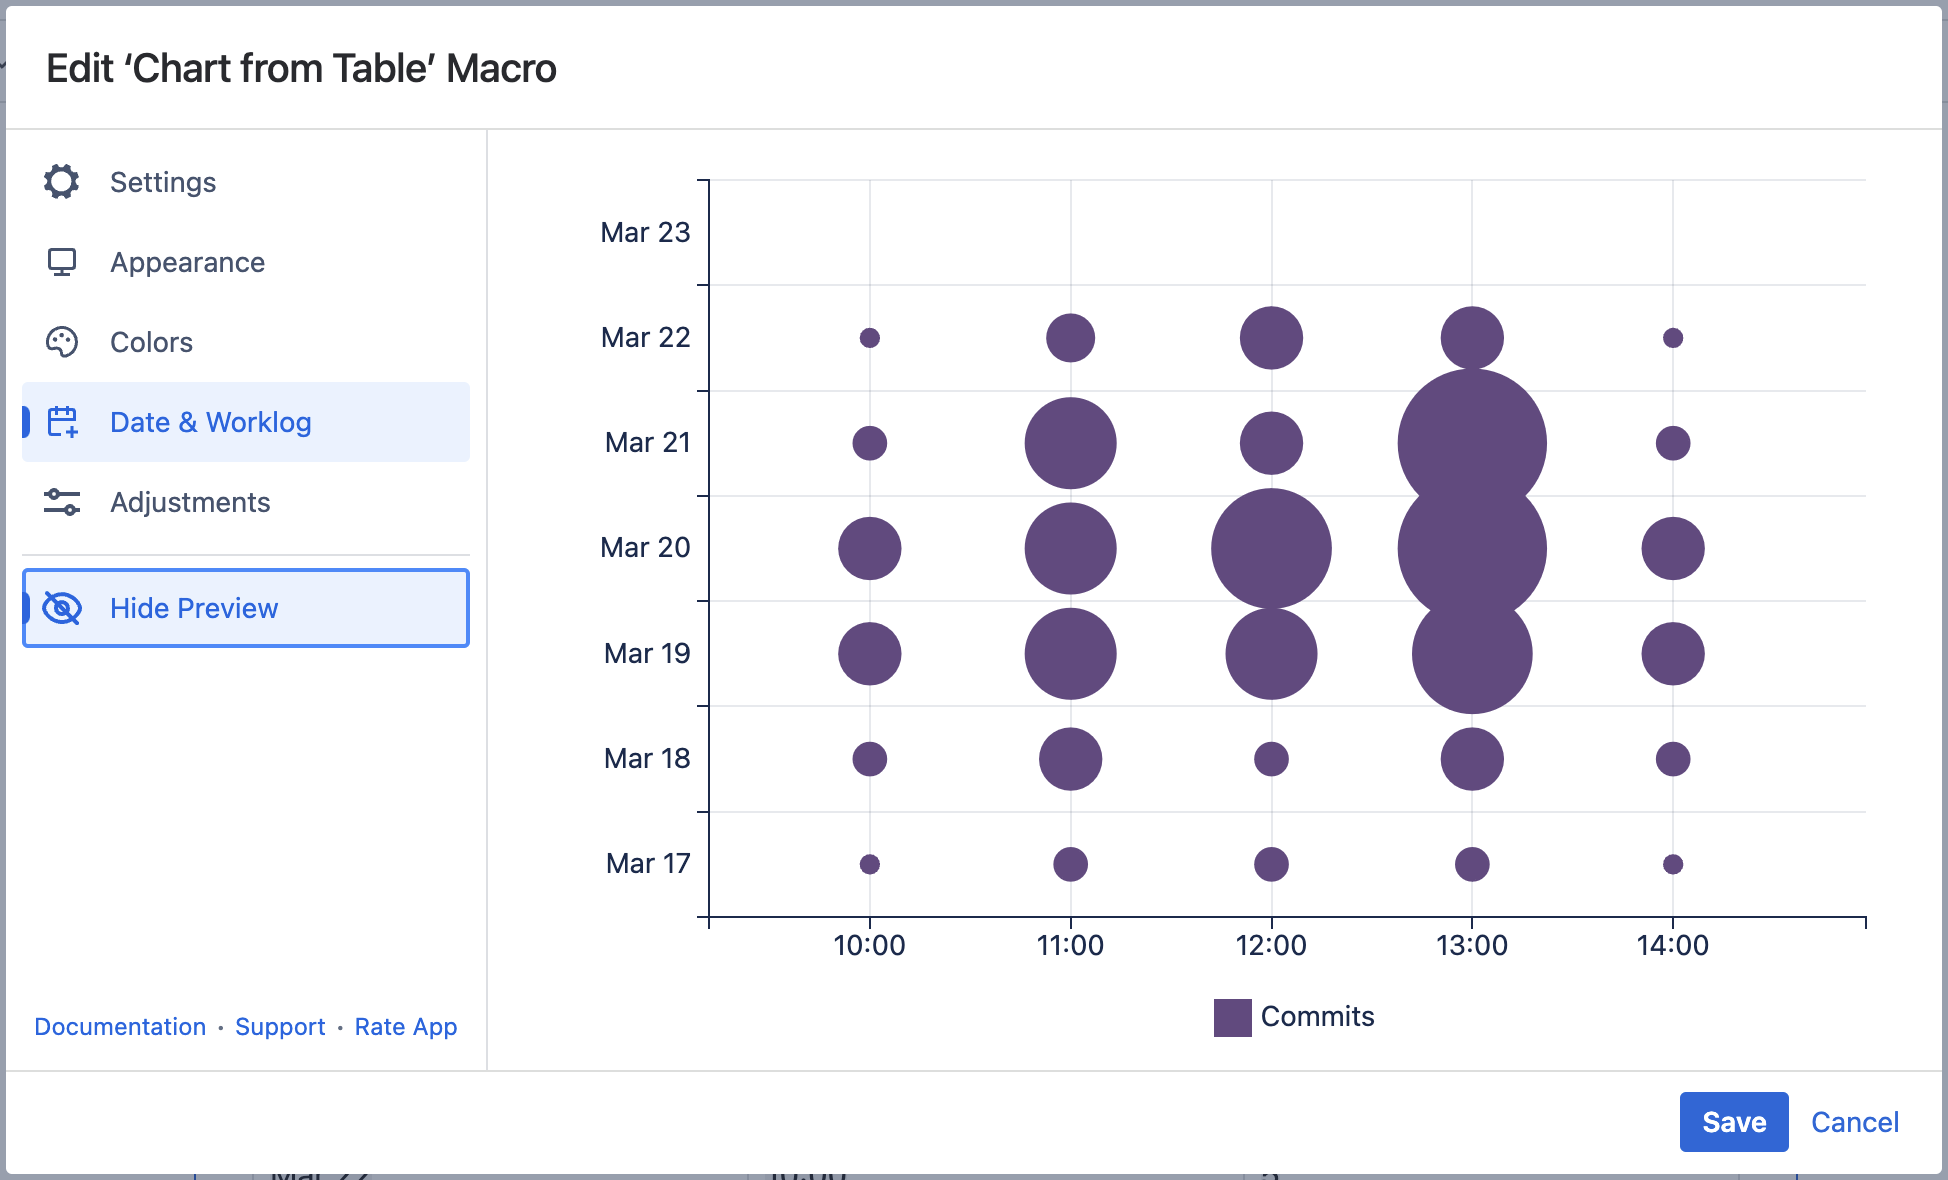
Table Filter, Charts & Spreadsheets for Confluence User guide Chart from Table Current: Punchcard (use case) PDF Download PDF Download page Punchcard (use case). Current page All pages Punchcard (use case) You can build a Punchcard with the help of the Bubble Pie chart type. Use сaseThe table includes information on the number of commits by date and hour. You need to get a commit summary with the help of a Punchcard. Source tableYour source table looks like the table below. Day of the weekHoursCommitsMar 1710:005Mar 1810:0010Mar 1910:0020Mar 2010:0020Mar 2110:0010Mar 2210:005Mar 2310:000Mar 1711:0010Mar 1811:0020Mar 1911:0030Mar 2011:0030Mar 2111:0030Mar 2211:0015Mar 2311:000Mar 1712:0010Mar 1812:0010Mar 1912:0030Mar 2012:0040Mar 2112:0020Mar 2212:0020Mar 2312:000Mar 1713:0010Mar 1813:0020Mar 1913:0040Mar 2013:0050Mar 2113:0050Mar 2213:0020Mar 2313:000Mar 1714:005Mar 1814:0010Mar 1914:0020Mar 2014:0020Mar 2114:0010Mar 2214:005Mar 2314:000 Solution Wrap the table with the Chart from Table macro. Choose the Bubble Pie chart type. Set the required X-axis, Y-axis columns and values column. Specify the correct Date format and other options if needed. ×