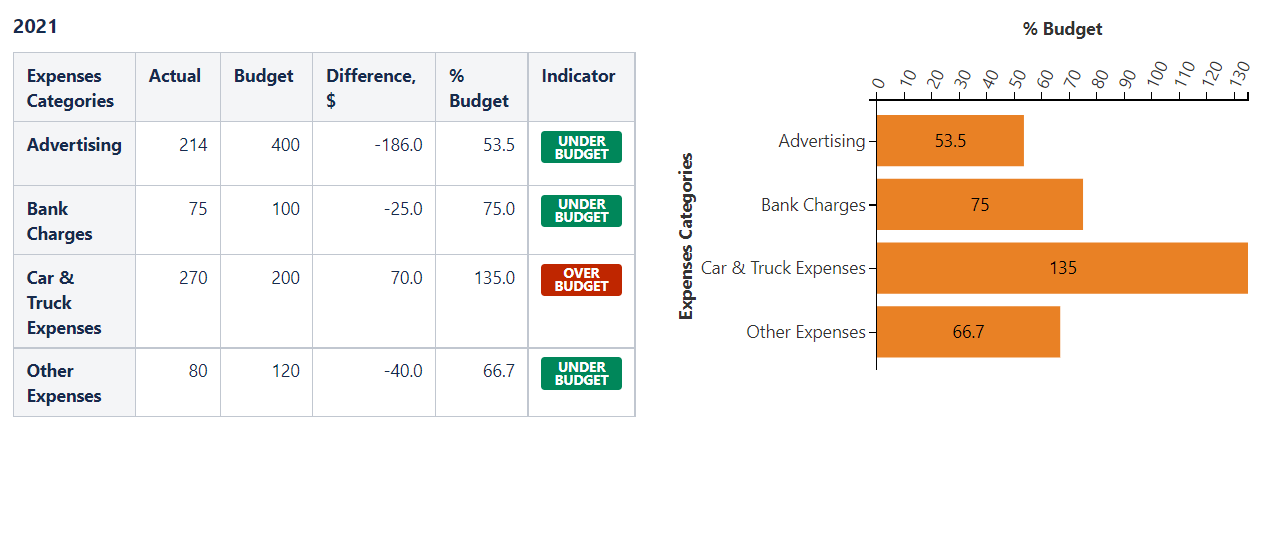
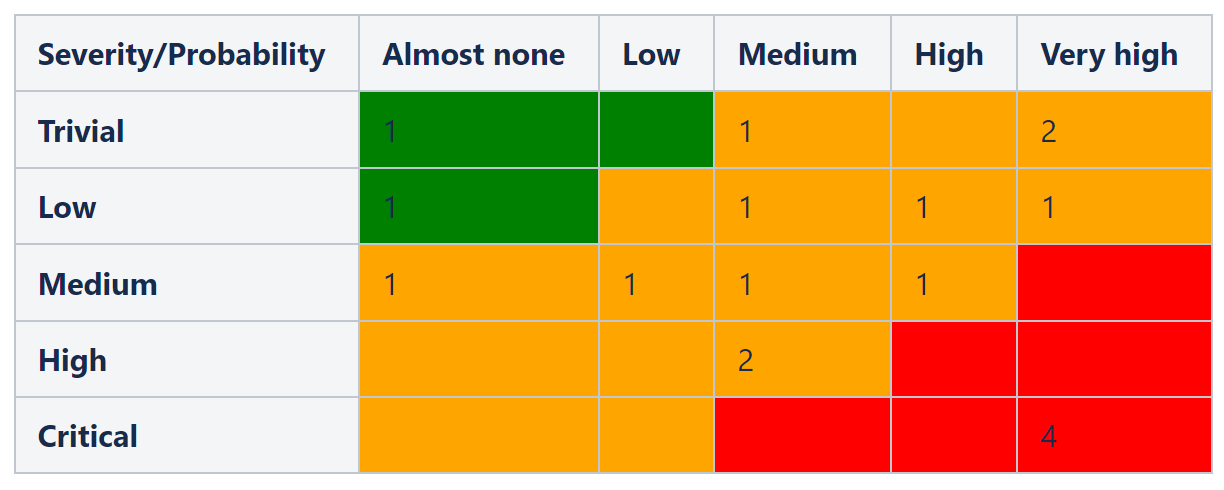
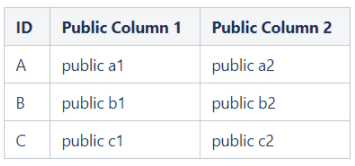
Table Filter, Charts & Spreadsheets for Confluence User guide Current: Use cases PDF Download PDF Download page Use cases. Current page Include child pages All pages Use cases Discover use cases with the combination of macros from Table Filter, Charts & Spreadsheets.Video use cases — Part 1:A real-time feed from Google Sheets in Confluence (via URL)Reusing one table on many Confluence pagesA quick project summary from multiple Confluence pages Video use cases — Part 2:Calculating employee tenure based on the start dateInteractive project budget tracker inside a spreadsheetCombined Jira + Confluence project timeline in one Gantt chart Use cases: Reusing table dataCollecting table data across pages into a single datasetReusing the same table for Confluence dashboards and reportsBuilding focused table views from one master tableUse cases: Combining multiple tablesCombining same-structured tables across pages for a consolidated reportJoining team members and project assignments tables by one shared columnMerging Jira Issue tables by linked issues and keysCombining CSV table with a Confluence table Accounting for the Yearly Budget Nikita Kamai Creating a Risk Matrix Nikita Kamai Setting restrictions for columns/rows Nikita Kamai ×