New in this release
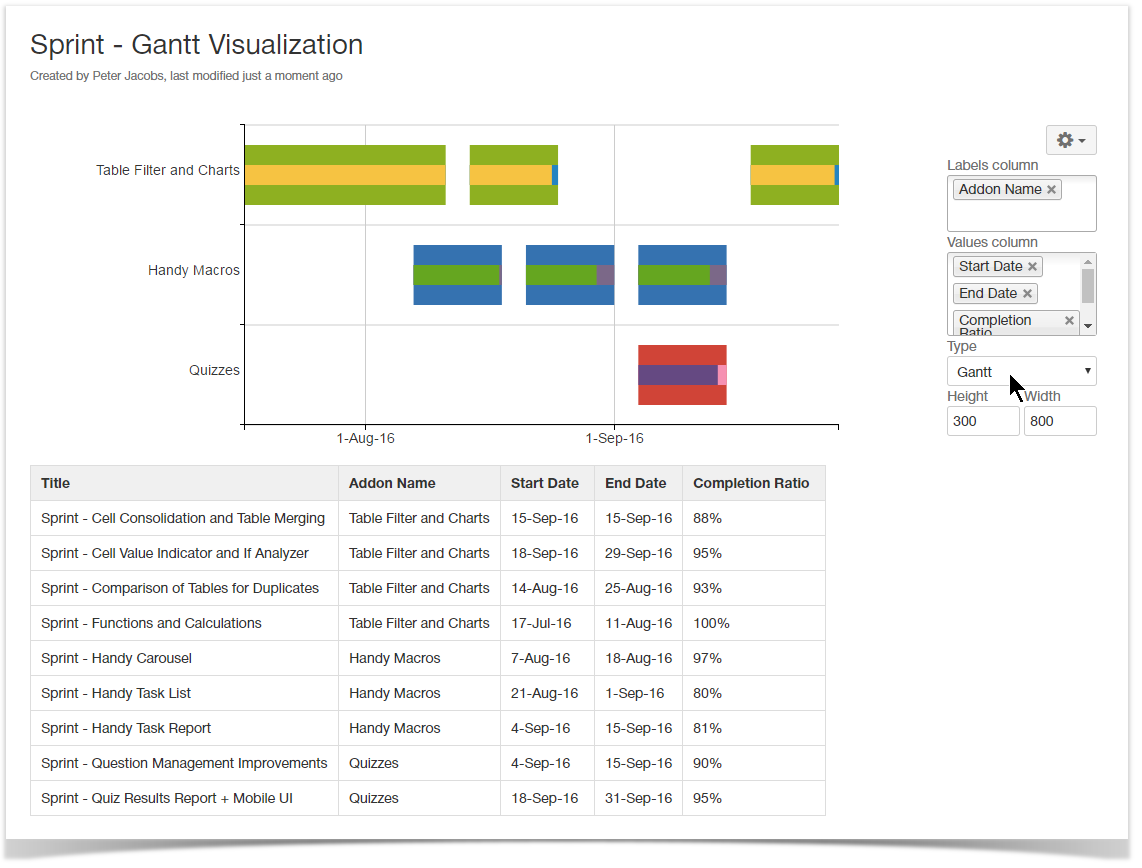
Added a capability to create a Gantt chart.
Now you can quickly and easily visualize the project schedule and better plan the work resources for its accomplishment.
The new version of add-on also includes the following features:
- Added an option to show the legend below the chart.
- Added display of values in the bar and column charts, including their stacked variants.
- Added the automatic retention of collapsed / expanded status for rows and columns of multi-dimensional pivot tables.
- Added an option to show the value with its percentage for aggregated data values of pivot tables.
- Added a capability to set the trendline on line and date line charts.
- Added an option to show or hide values with their relative percentage on pie, bar, and column charts.
- Added a capability to build multiple pie charts on the basis of a single data table.
- Added support for empty table columns when filtering or setting default values.
- Added a capability to freeze any table column or row for horizontal or vertical scrolling.
- Improved aggregation of table data in its initial HTML view.
- Added a capability to show the Total column with minimal, maximal, average or with the count or sum of values in the Table Filter macro.
Fixed in this release
- Resolved the issue with generation of a pie chart when the source table if the first cell is empty.
- Resolved the issue with showing the incorrect number of filtered results when using the Show first N rows option with the dynamic value construction (for example, '3+').