Awesome Graphs is a data-providing and reporting app that offers engineering analytics in Bitbucket. We help teams around the world evaluate team performance, find bottlenecks, and deliver faster with data-driven insights.
How to install the app
The Awesome Graphs app can be installed into Bitbucket on a workspace level by a user who holds admin rights to this workspace. There are 3 ways to approach the installation process:
Bitbucket Settings (recommended)
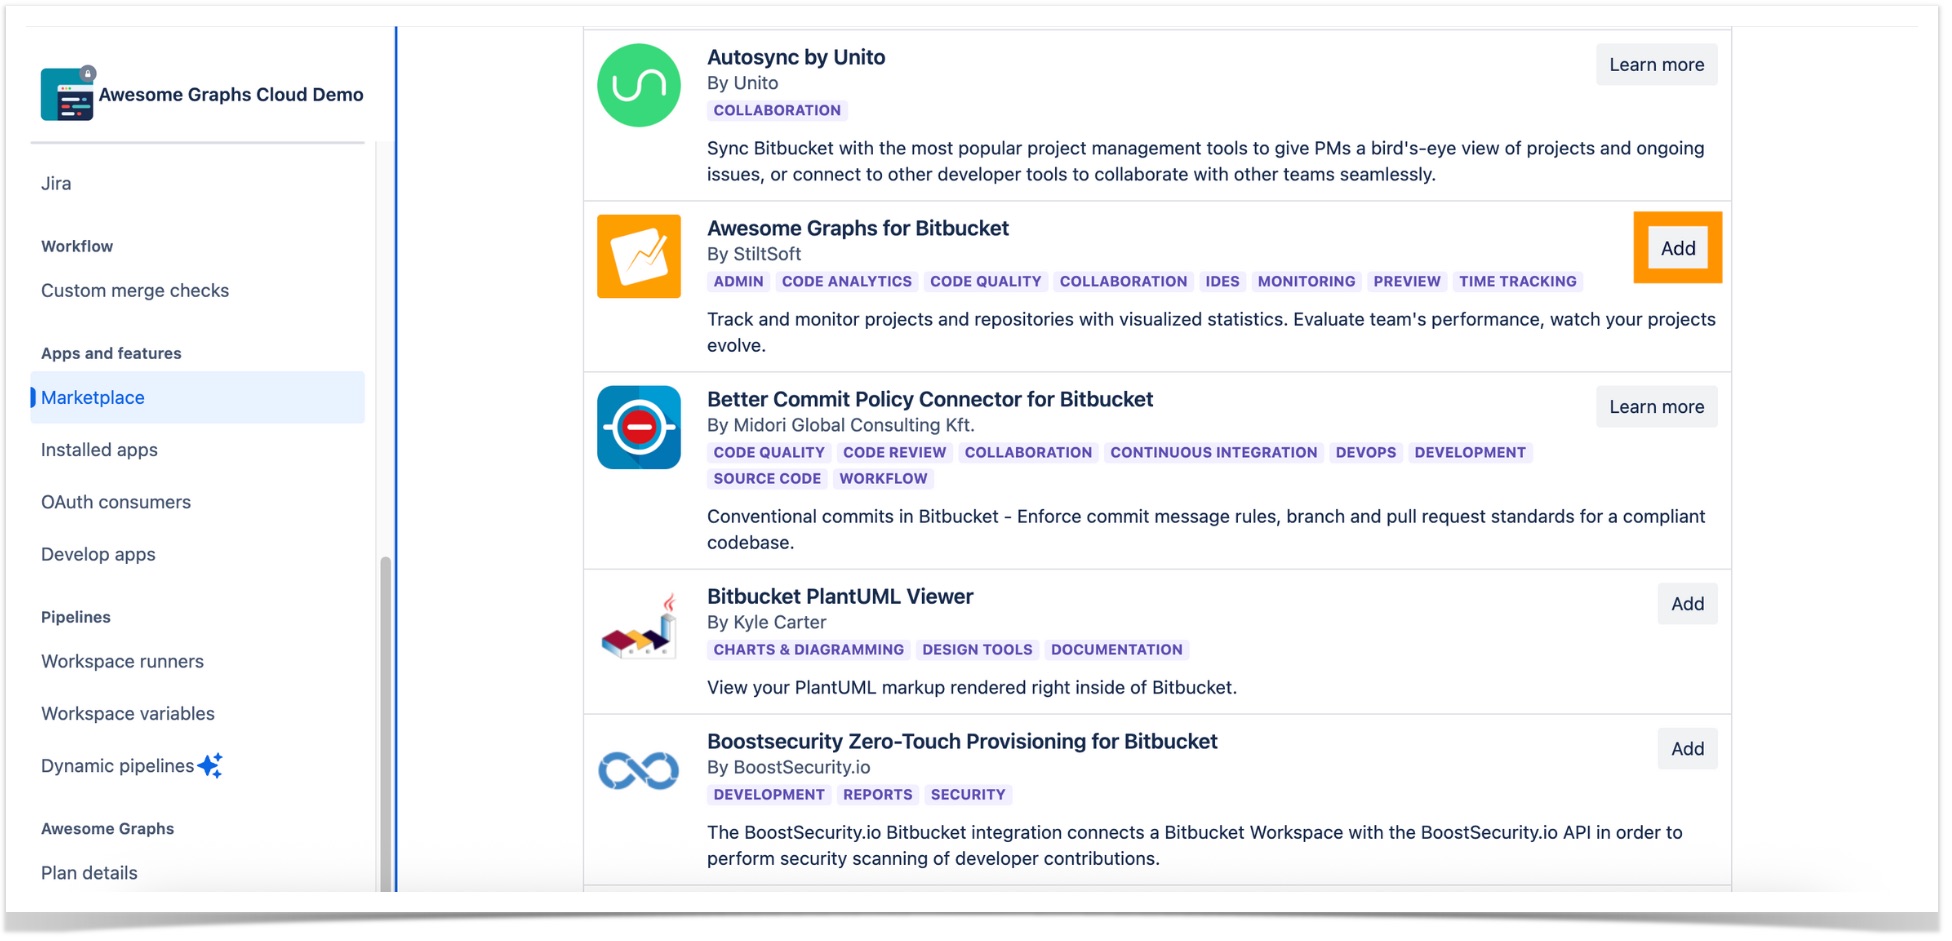
- Open the settings of a workspace you want to install Awesome Graphs into by clicking Settings in the left sidebar.
- Click Marketplace under the Apps and Features section.
- Locate Awesome Graphs for Bitbucket in the list and click Add.
Installation Link
- Follow the installation link.
- Make sure to select the correct workspace in the workspace authorization section.
- Click Grant access.
Atlassian Marketplace
- Go to the Awesome Graphs listing on the Atlassian Marketplace and click Try it free.
- Once in Bitbucket, make sure that you are located in the correct workspace.
- Click Add or switch to the correct workspace and follow the instructions here.
How to activate a free trial
After the app is installed, a free 14-day trial will automatically be enabled for your instance. There are no additional steps required to start the evaluation period.
How to navigate the app
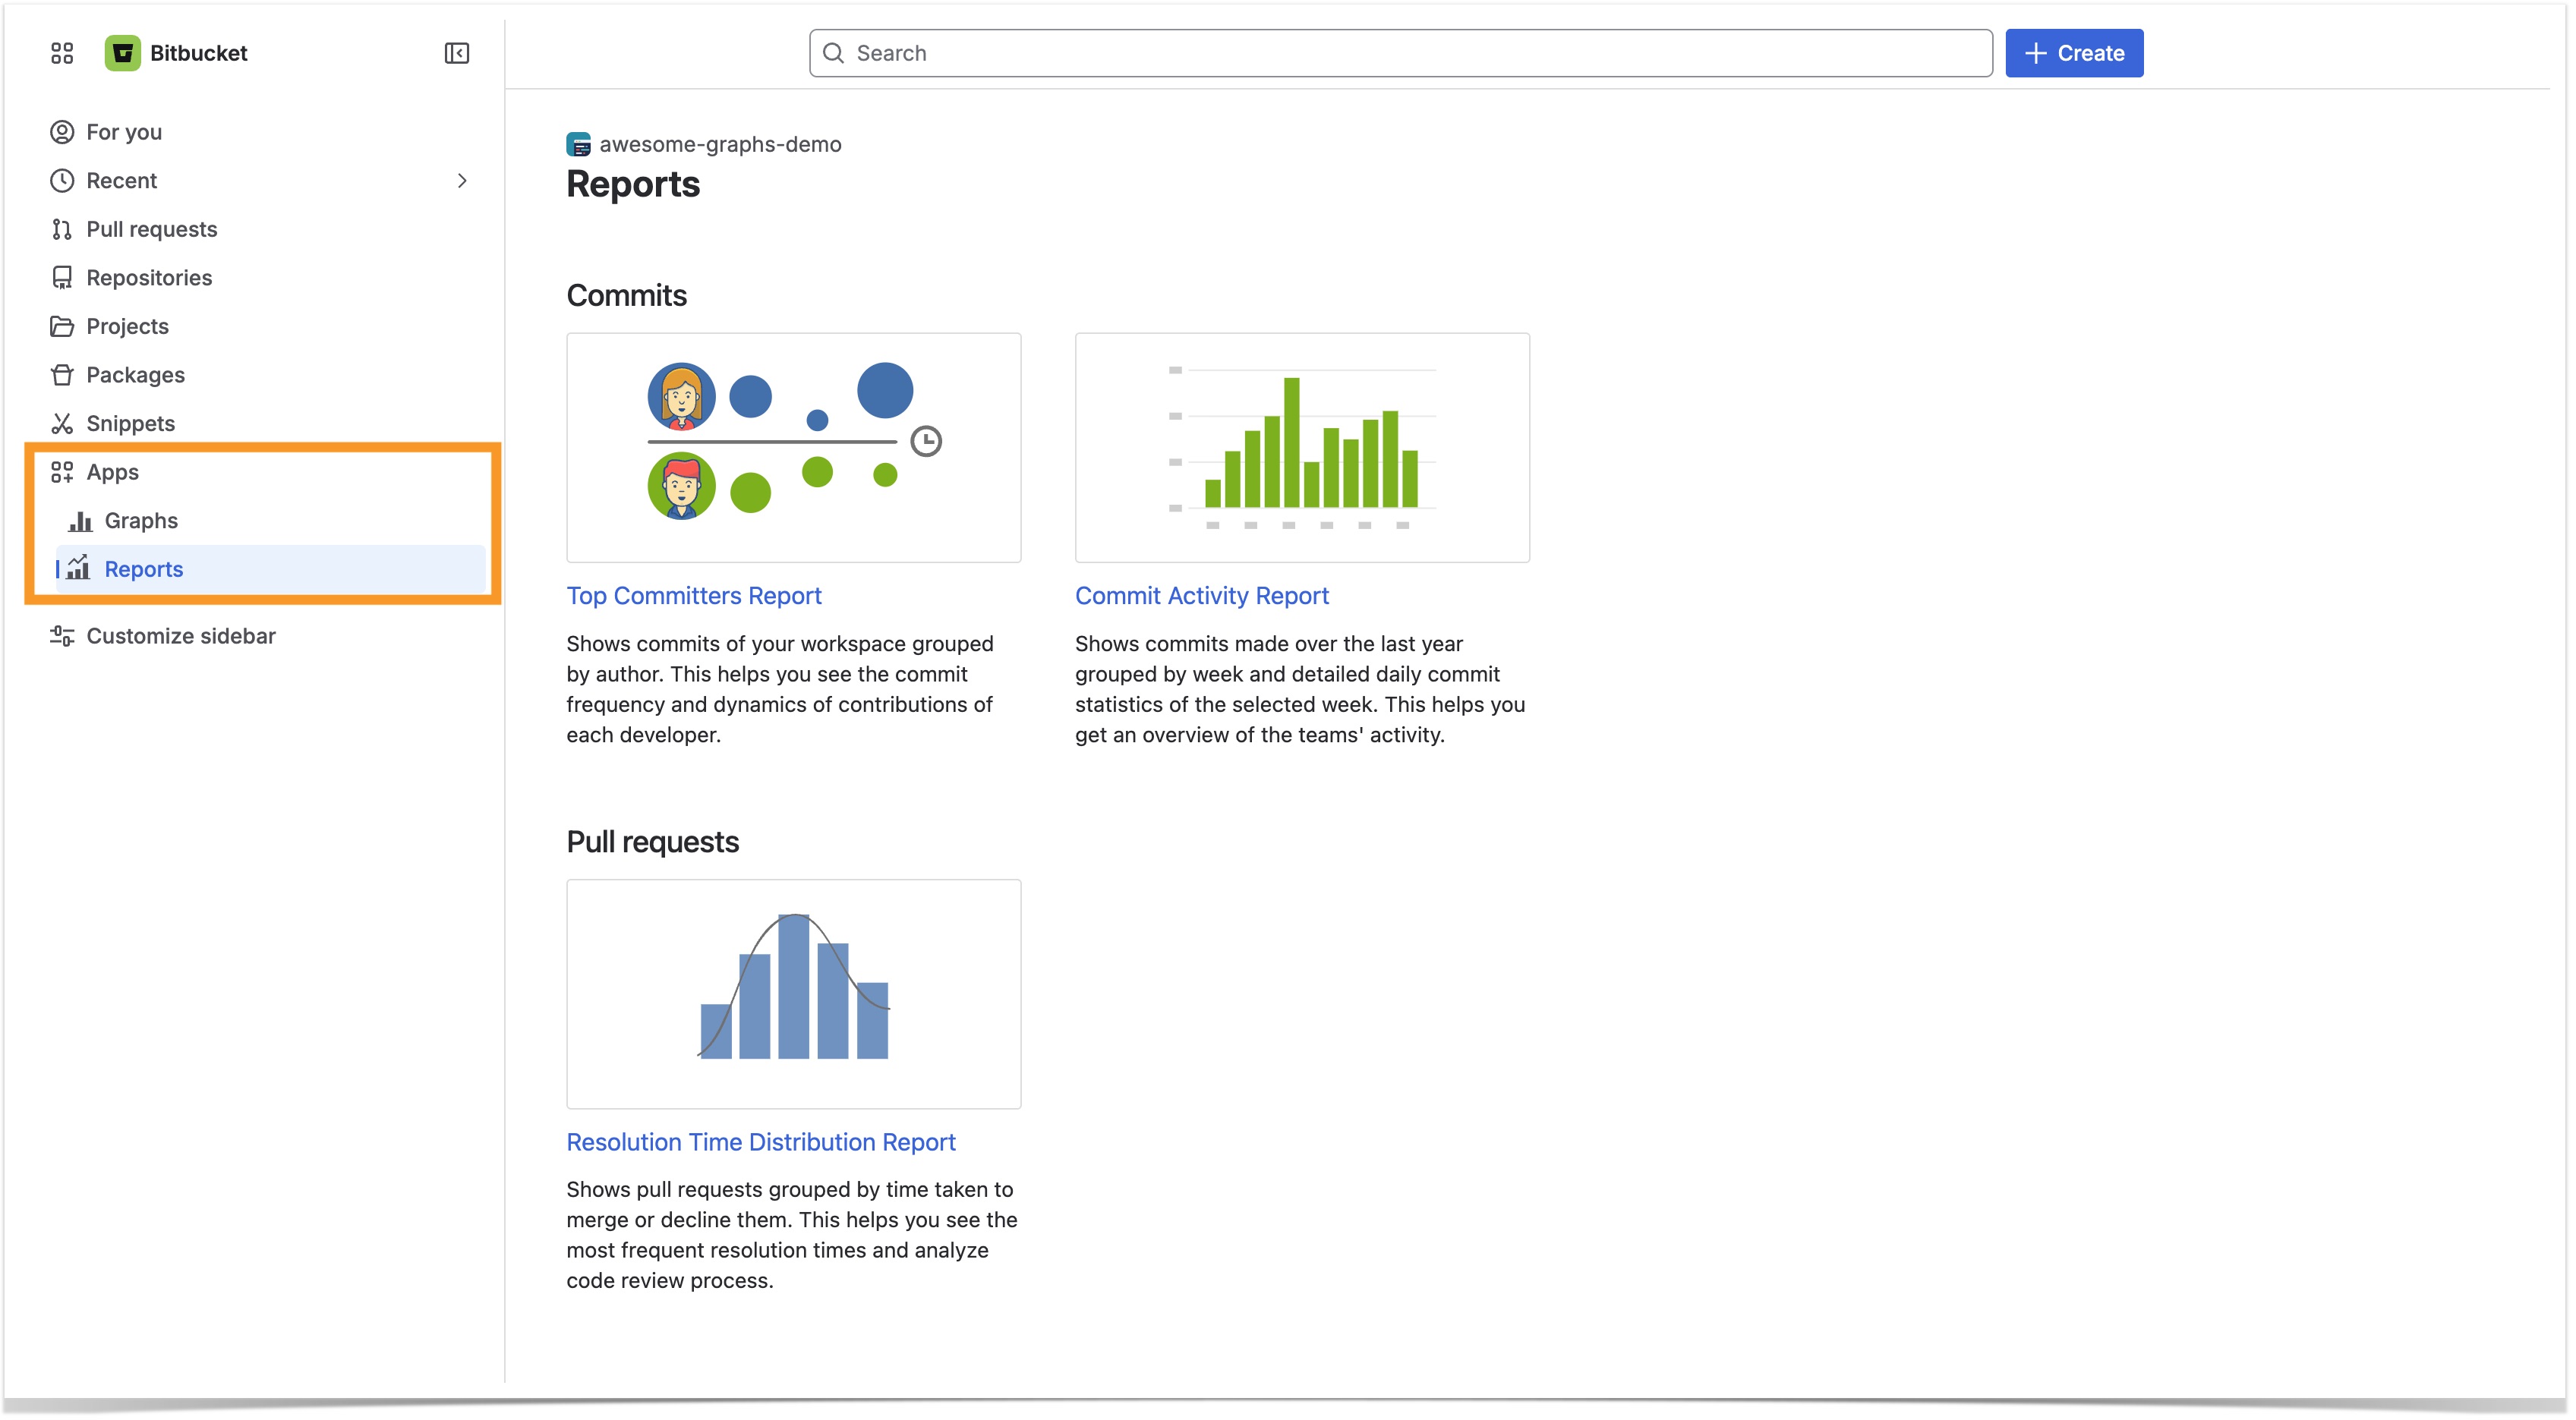
After the initial indexing is finished, you can use Awesome Graphs for Bitbucket to its full potential. The app provides you with a set of graphs and reports to analyze activity in your workspaces, projects, and repositories. You can learn more about each one on the Commits Analytics and Pull Request Analytics pages.
How to get to the Graphs or Reports sections
To access the app's functionality on a repository level, go to the repository of your choice and click on the Graphs or Reports icon under Apps in the navigation bar on the left side of the screen.
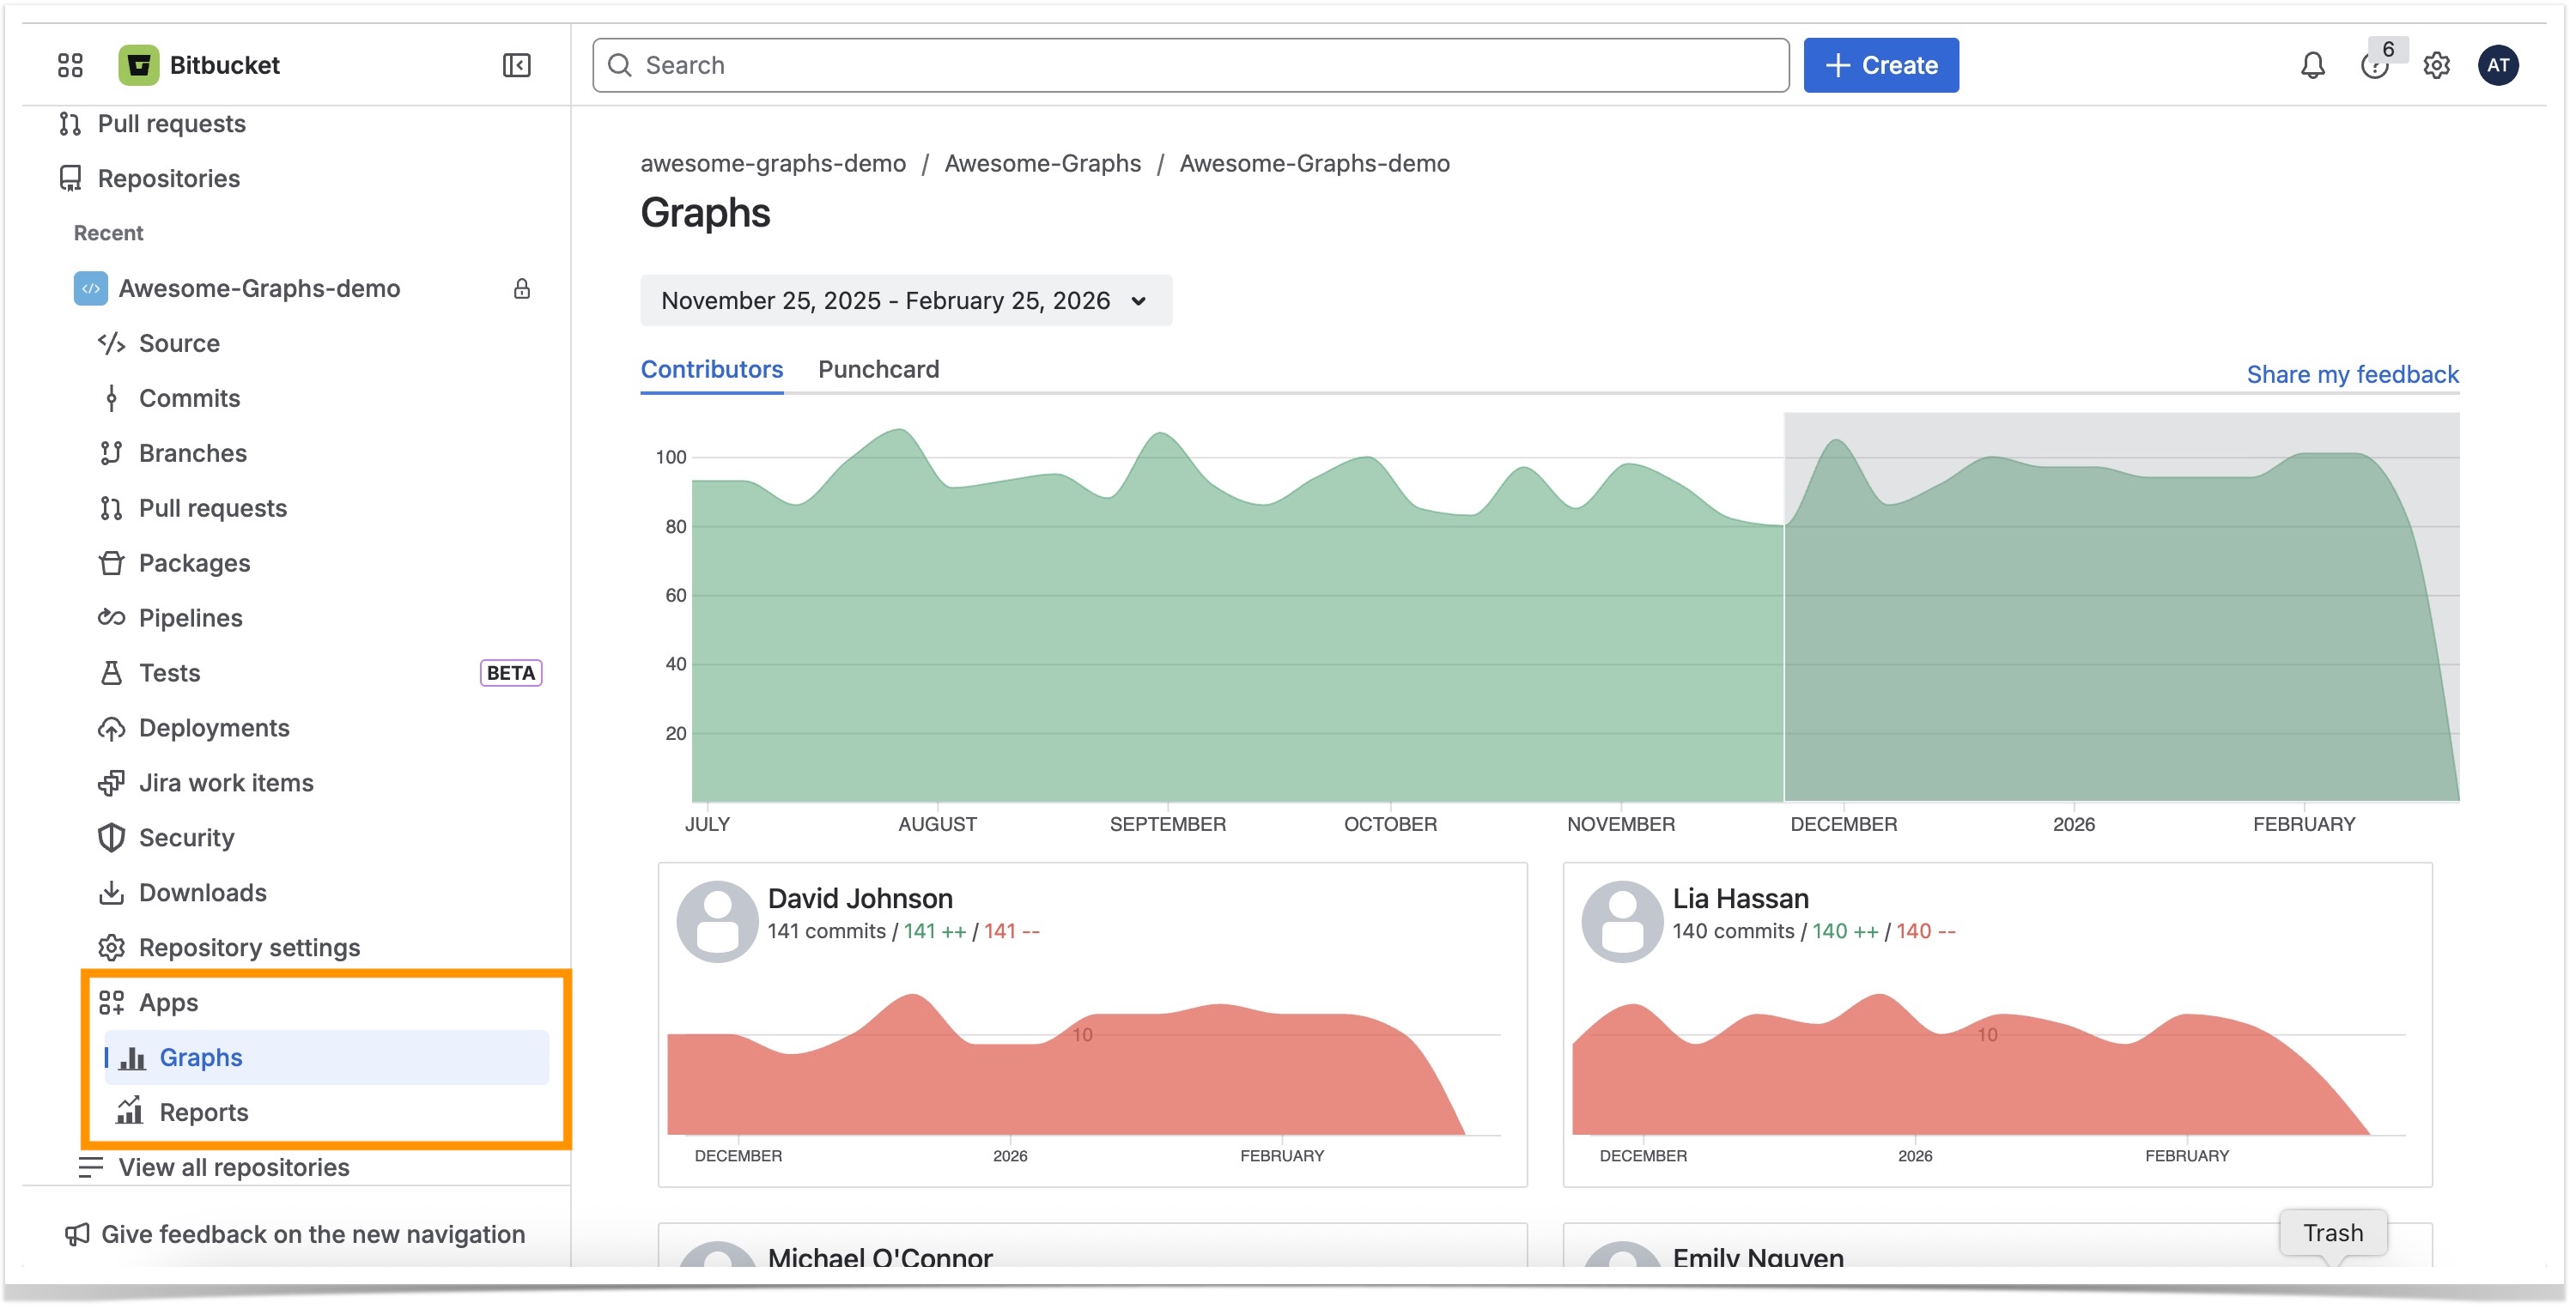
To view the graphs on the project and workspace level, click on the Graphs or Reports icon under Apps in the navigation bar on the left side of the screen. For each graph and report on this level, you can use project filters to view the data for specific projects.
How to purchase the app
To continue using the app after your 14-day trial expires, you will need to purchase a license. Awesome Graphs is priced at $3 per user per month. The cost is applied to the total number of users who have access to your Bitbucket workspace.
To make a purchase, navigate to Workspace settings - Awesome Graphs - Plan details.
Please note that Workspace settings can only be accessed by Workspace admins in Bitbucket.
On the Plan details page, you will find information about the end date for your trial license, pricing, and your user tier.
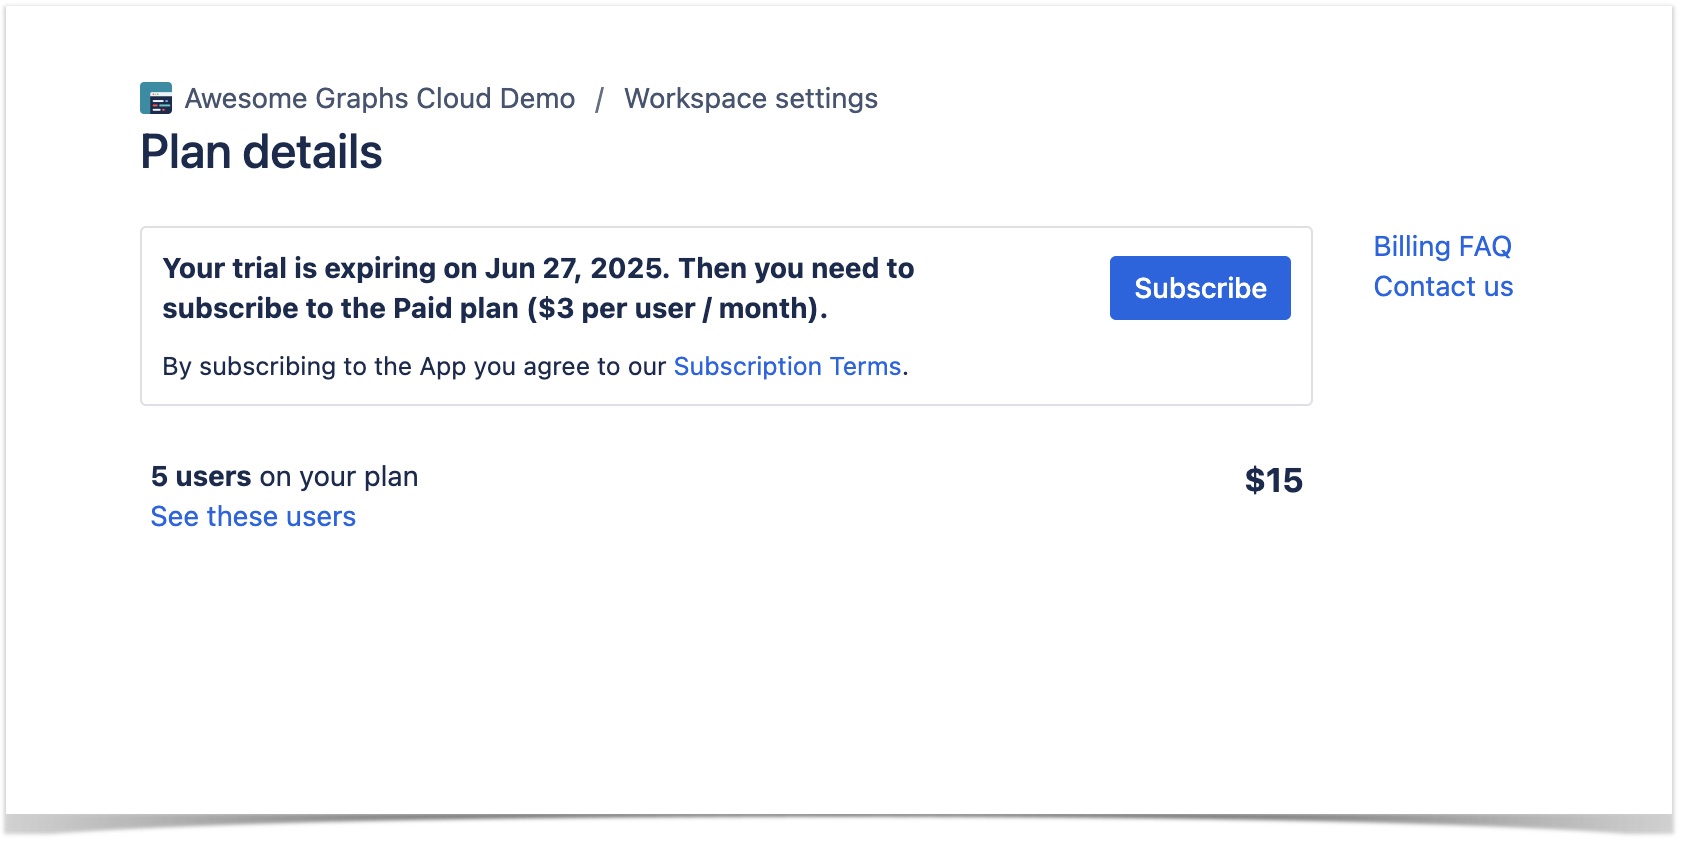
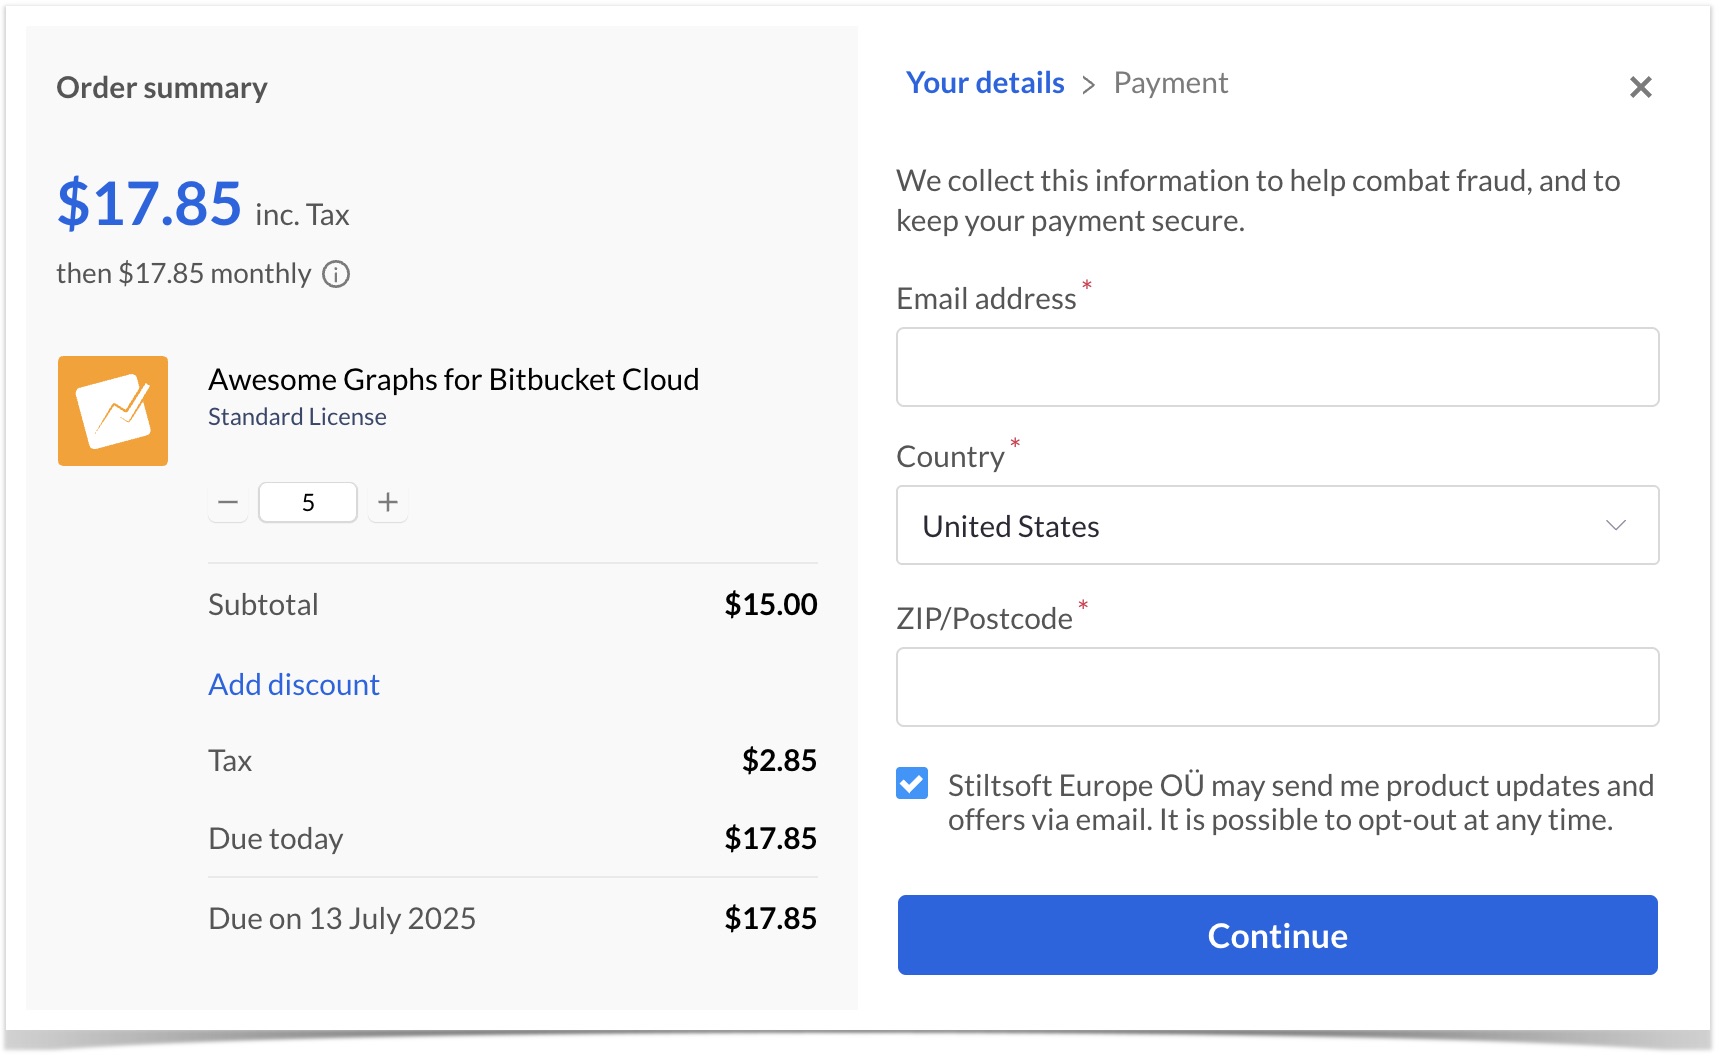
After clicking on Subscribe, you will be prompted to input necessary information such as Contact Email, Country, and Zip/Postcode. Make sure that the box at the bottom of the page is selected if you would like to receive product updates from us.
If you have more questions about how Awesome Graphs' billing and licensing work, check out our Billing FAQ page for more details.