Added lines of code statistics in Contributors graph.
Added the account app context.
Availability for teams.
Added lines of code statistics in Contributors graph
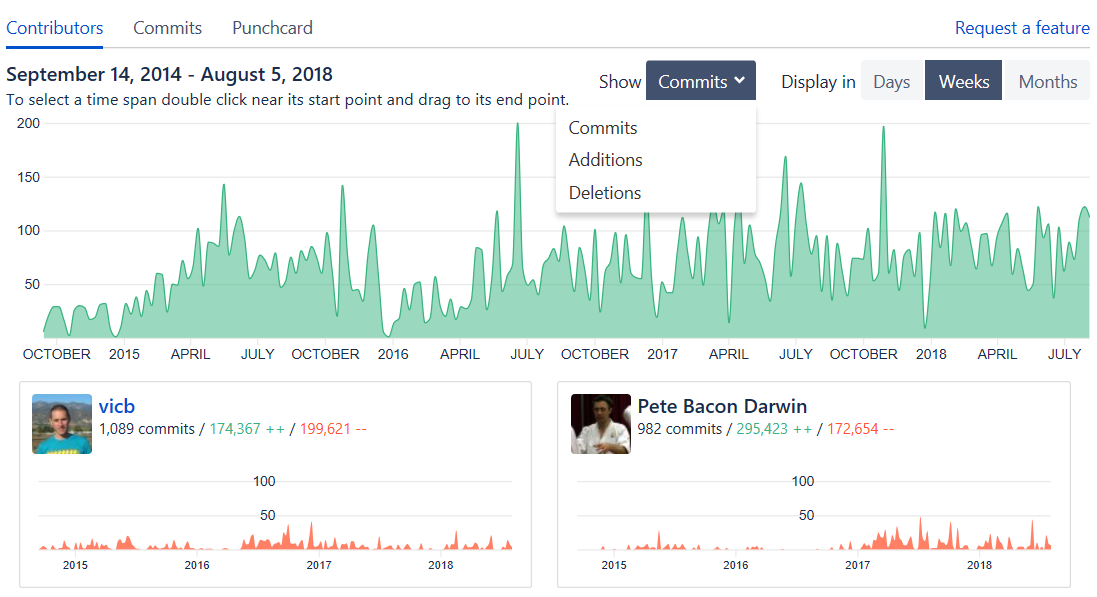
Now the Contributors graph visualizes not only numbers of commits, but also numbers of added and deleted lines of code.
You can choose what type of statistics to show on the summary graph and personal contribution graphs:
commits
lines of code added
lines of code deleted
Personal contribution graphs show number of commits and lines of code added/deleted during the selected period. Graphs are ordered by the criteria chosen on the summary graph.
Lines of code statistics will help you to better evaluate activity and efficiency of your team members.
The account app context
App context determines the level at which an app is visible and active once a user installs it. There are two types of app contexts in Bitbucket Cloud:
Account. The account context limits the app to the account or team which installed the app. In this case the app will be visible to anyone with access to the repository.
Personal. Only the user who installs the app will be able to see the app, and it will “follow” the user around the site.
Previously Awesome Graphs was available only with the personal app context. Now the app can also be installed with the account context. In this case graphs for repositories of a user or a team will be visible to anybody, who has access to these repositories. For public repositories graphs will be visible even to non-authorized visitors.
Availability for teams
In Bitbucket Cloud teams can install only apps with the account context. So previously it was impossible to use Awesome Graphs for teams.
Now teams can install Awesome Graphs with the account app context. It will allow all team members to view graphs for team repositories without installing the app.
For more details please refer to the Installation page.
Cookie Notice
This website uses cookies for analytics, personalization and advertising. By continuing to browse, you agree to our use of cookies. Learn more