Starting from version 6.3.0, the app supports exporting pull request Cycle Time data to a CSV file. The data includes total Cycle Time and its breakdown into four phases measured in seconds for every pull request.
Update to the new version and streamline your processes!
Awesome Graphs gives the capability to export raw data with statistics across all projects and repositories to a CSV file. As a result, you will get the list of the commits or pull requests (including draft pull requests) made during the selected period with their details. You can use this data to:
- Create custom graphs and apply different filters and sorting options in Excel, Tableau, Google Spreadsheets, and so on.
- Integrate it to your analytics tool (e.g., Tableau, Grafana, Power BI) to identify trends in comparison with the data from Jira and other sources.
- Get the number of lines of code added and deleted by a user across all projects and repositories.
- Create a report based on the developers' activity to share it with stakeholders.
Below on the page, you'll find:
- instructions on how to export the data to CSV
- a detailed description of the resulting reports
For easier navigation, use the Table of Contents at the top-right of the page.
How to export the data
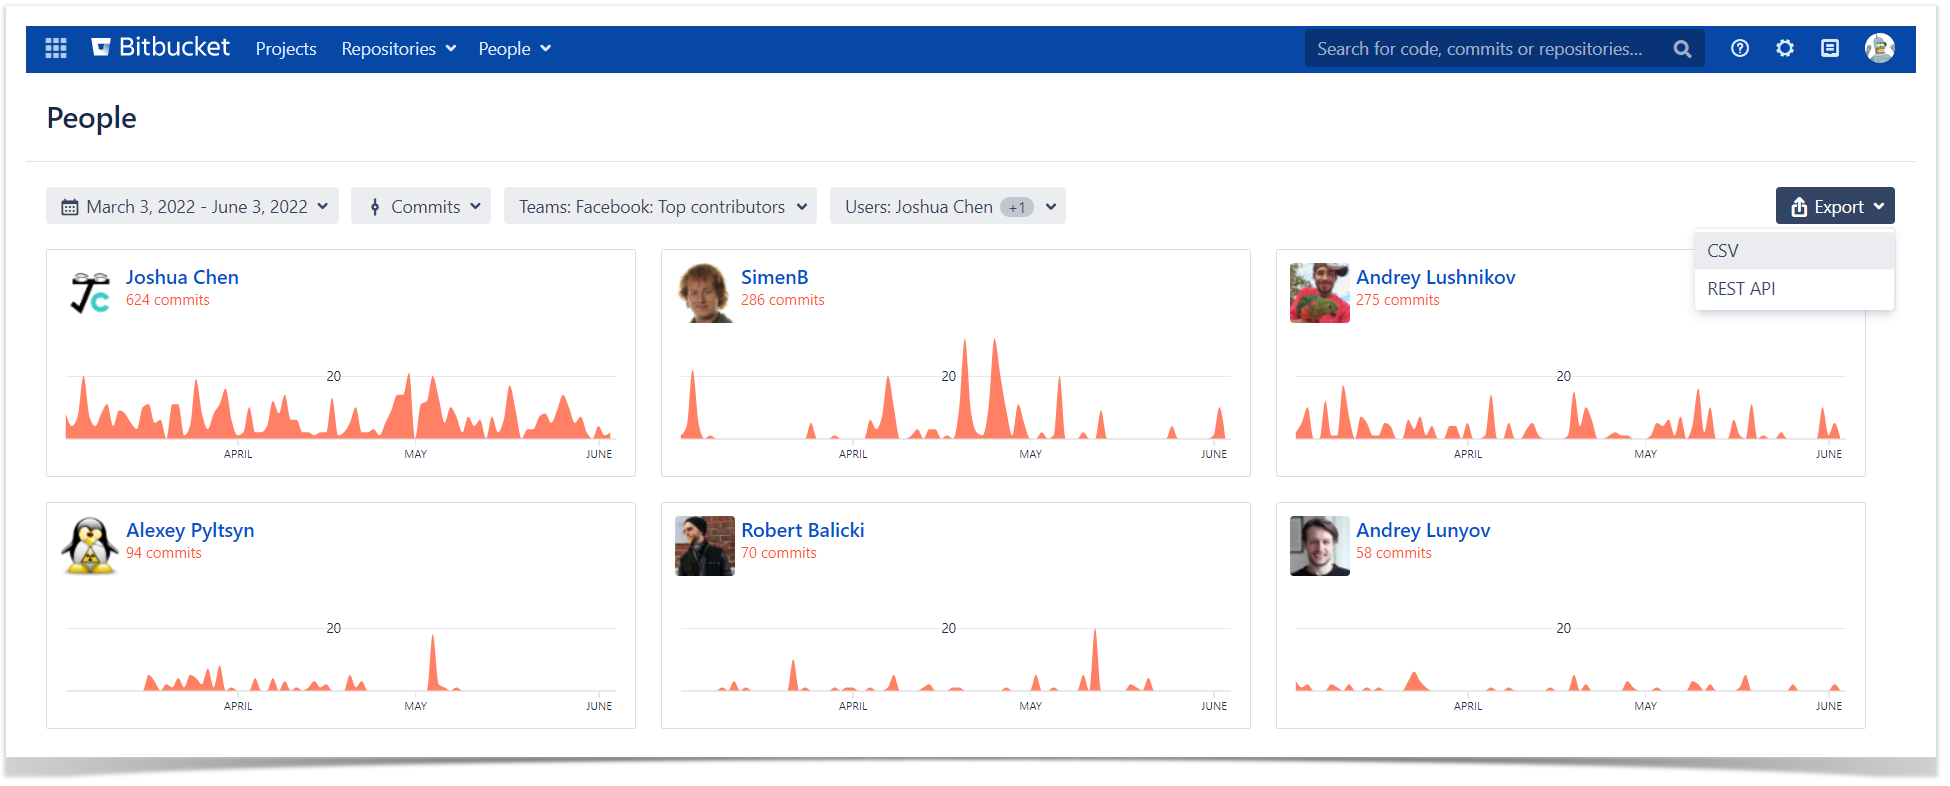
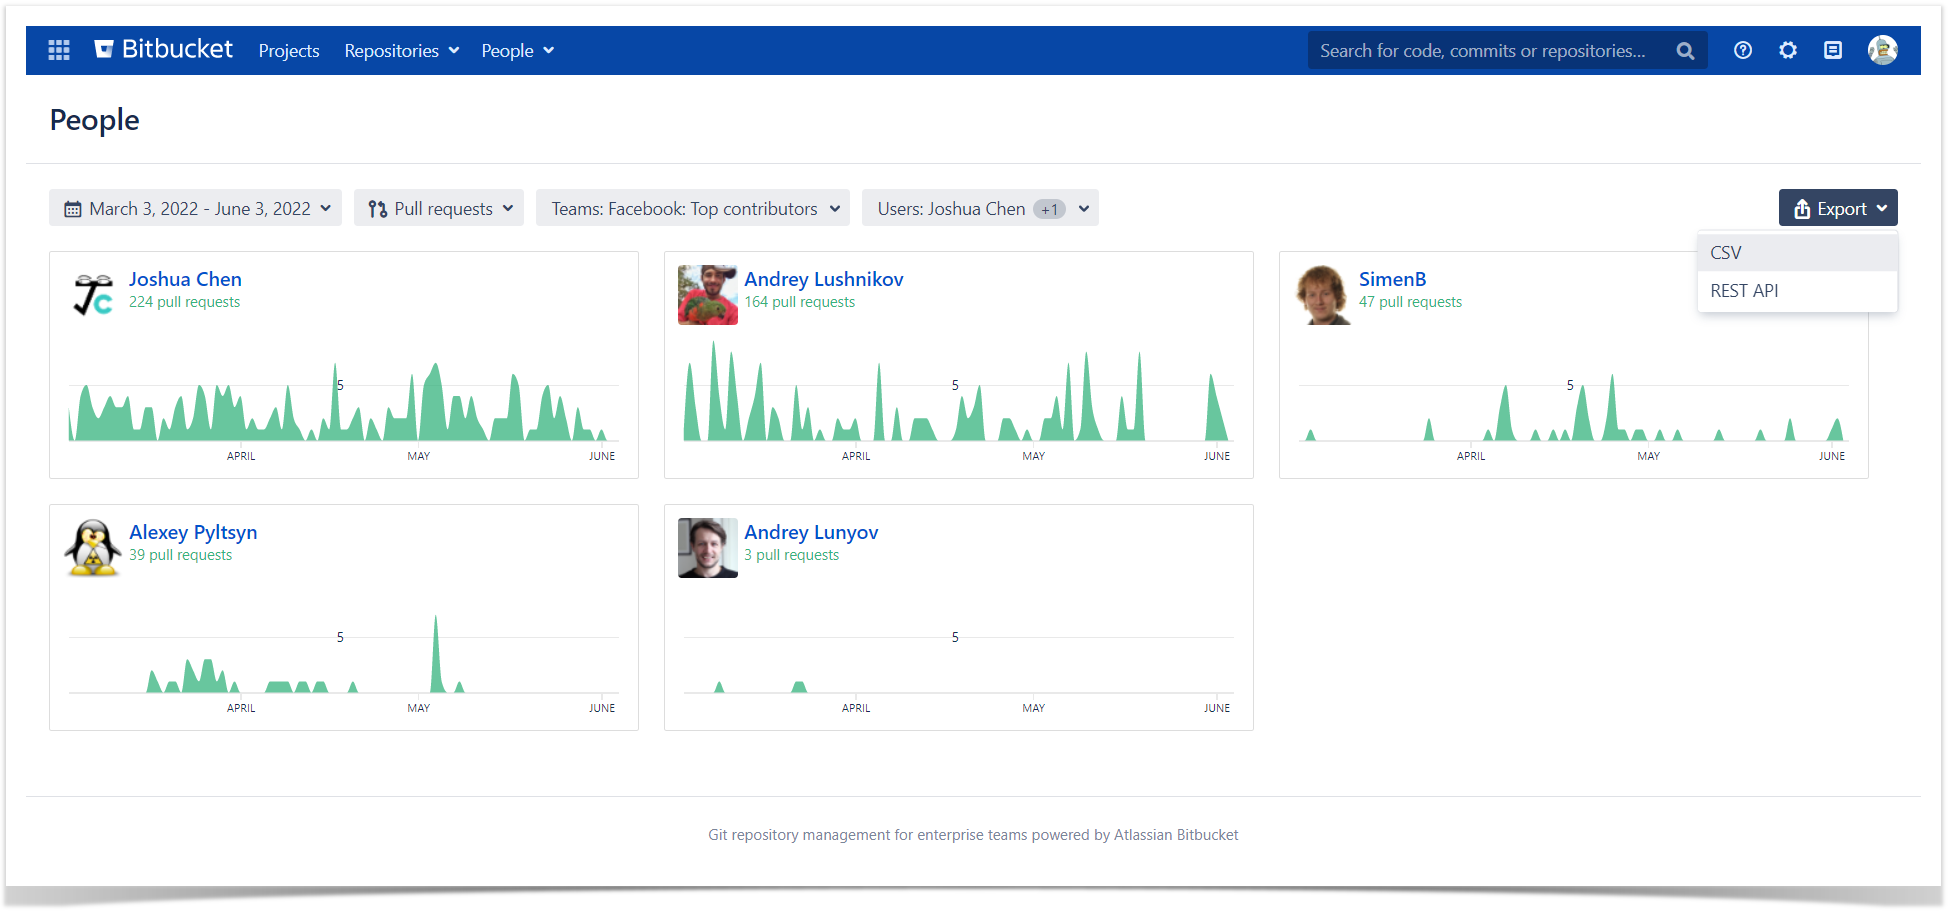
To export commit and pull request data, go to the People page → the Export button at the top-right.
REST API resources to export to CSV
Another way is to use the REST API resources allowing to export global, user, project, and repository data to CSV. You can access the REST API in-app documentation at the People page by clicking on Export → REST API or via the link: <bitbucket-host>/plugins/servlet/graphs-api.
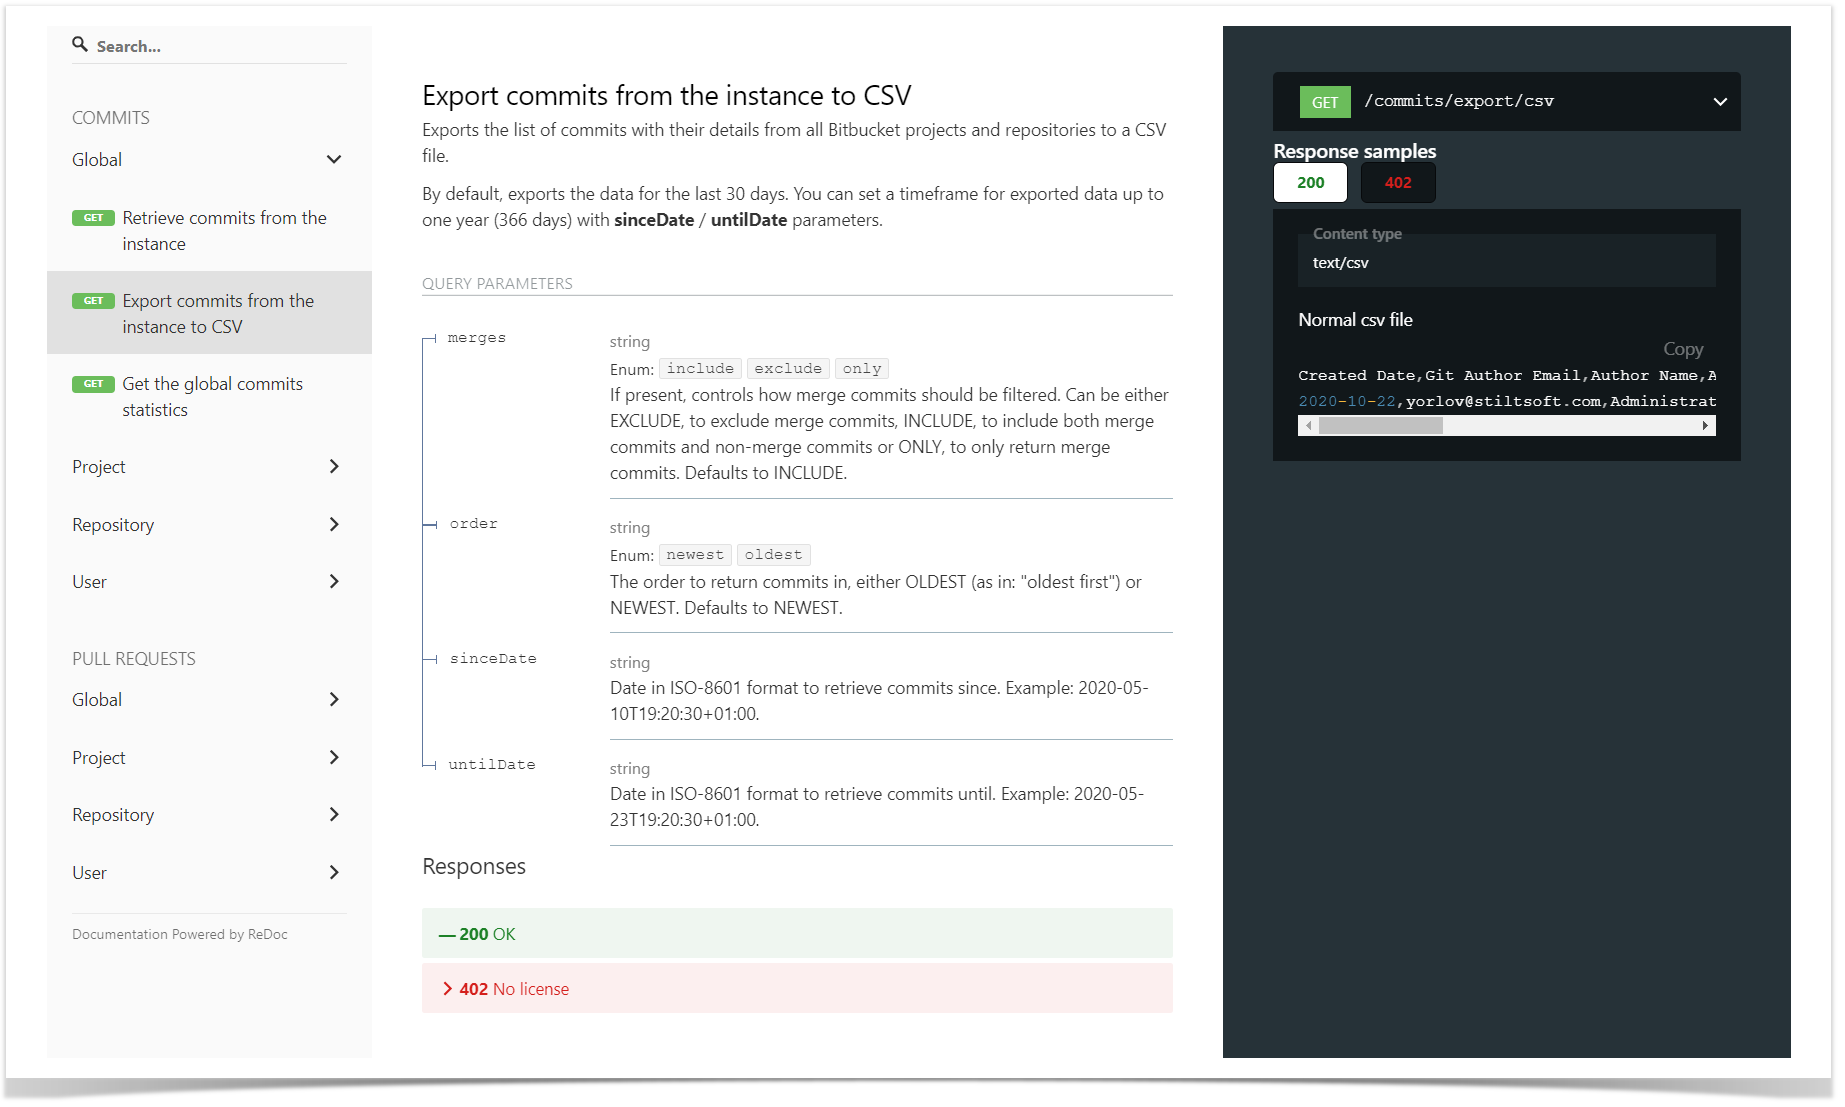
Learn more about the REST API
Export the list of commits
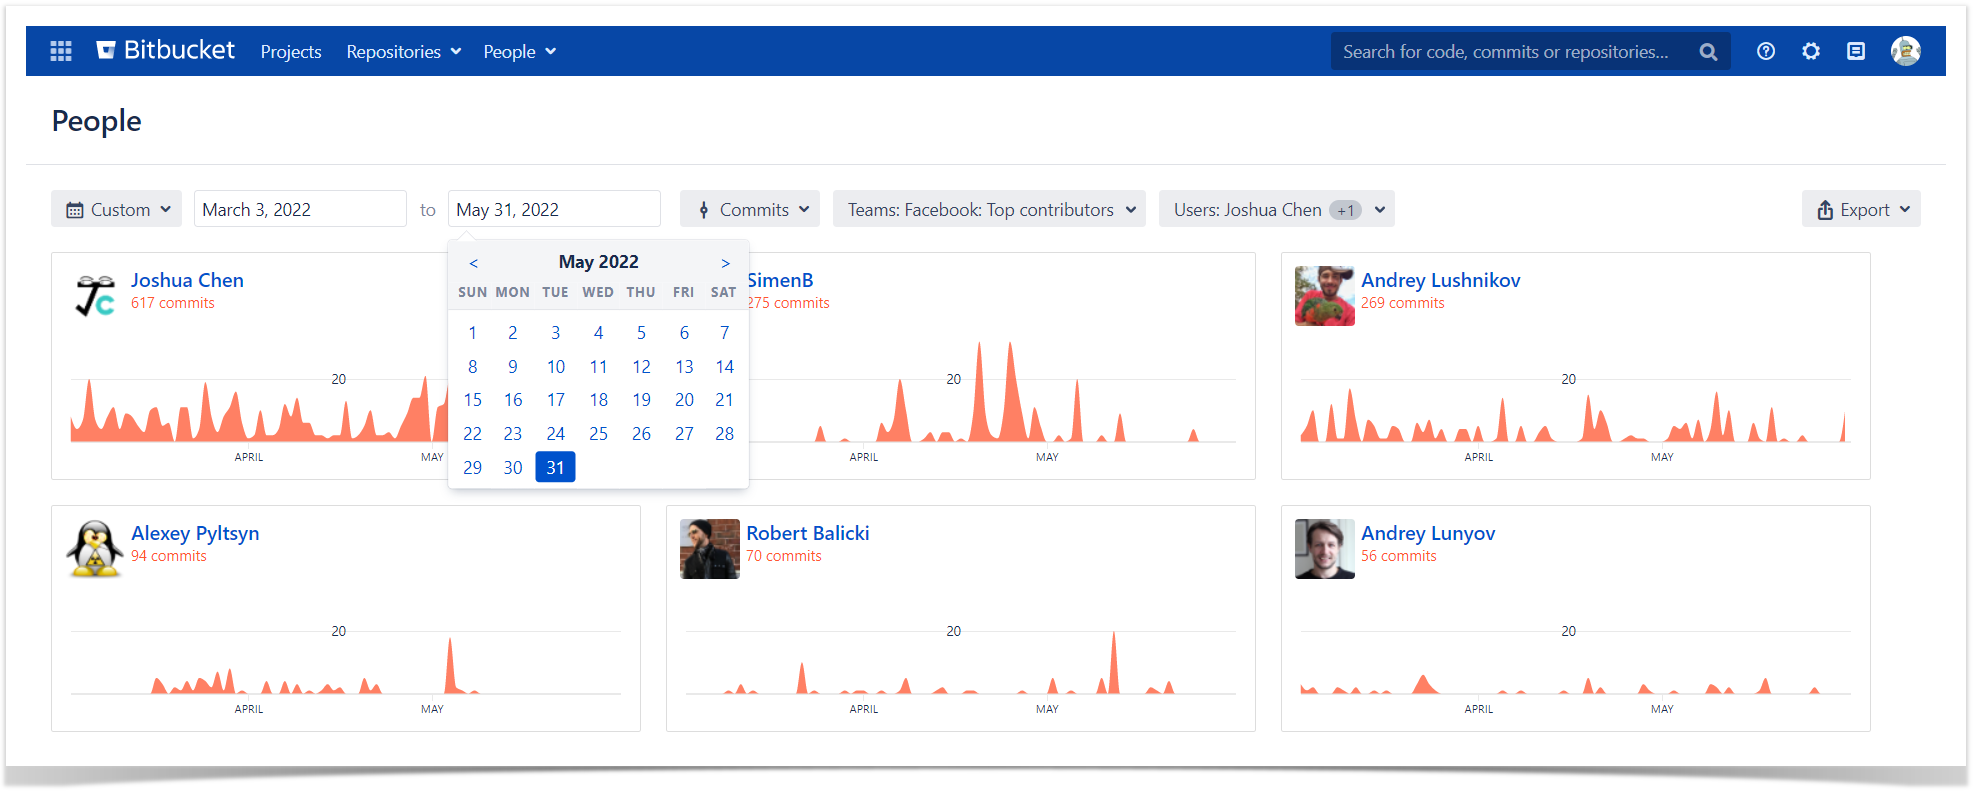
The data for a CSV file is gathered based on the activity type and time span that you select at the top of the People page, e.g. if you choose Commits and Last month, you'll get a CSV file with the list of the commits made during the last month.
To export the selected data click the Export button and choose CSV.

There can be any custom time span of up to the last three months.
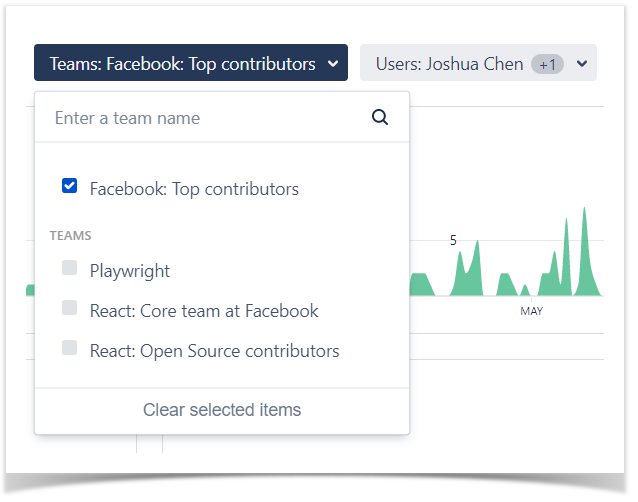
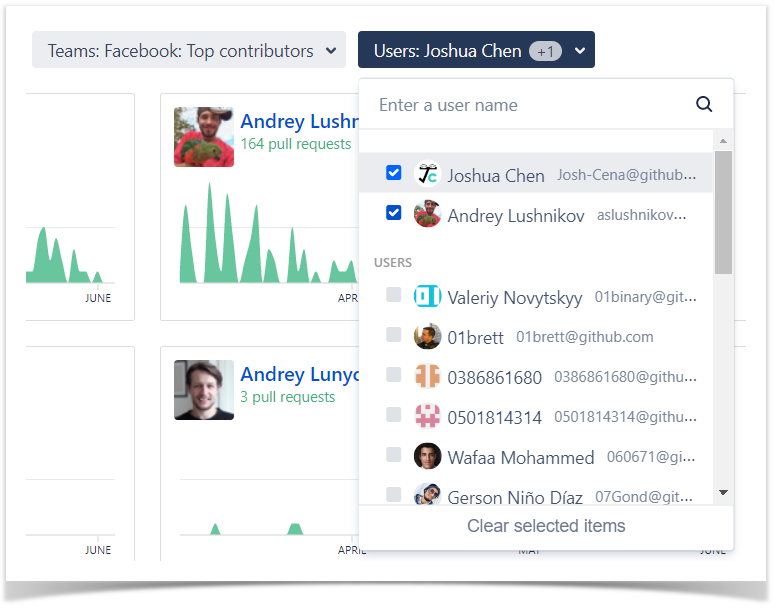
You can select multiple teams and users, separately and combined, to filter the results shown on the page and exported, making it easier to analyze the activity of individual users and teams on the global level.
Commit details included in the report
The details of commits that can be found in the list are the following:
- Creation date in ISO 8601 format
- Author's email, full name, and username
- Repository name
- Project name
- Commit hash
- Whether it is a merge commit or not
- Lines of code added
- Lines deleted

Export the list of pull requests
Choose Pull requests as the activity type to retrieve the list of them to a CSV file.
Pull request details included in the report
The details about pull requests in the list are:
- Pull request creation date in ISO 8601 format
- Pull request last updated date in ISO 8601 format
- Author's username
- Repository name
- Project name
- State
- Pull request's ID
- Reviewers' full names and usernames
- Cycle time total – time from first commit until the pull request is merged or declined measured in seconds. Constitutes the sum of the following phases:
- Time to open – time from first commit until a pull request is created
- Pickup time – time from when the pull request is created until the review begins (marked by the first submitted non-author comment)
- Review time – time from the start of the review until the pull request is approved by all reviewers
- Time to resolve – time from the pull request approval until it is merged or declined
