New in this release
- Persistent index that reduces RAM usage and improves add-on performance on large instances.
- The My Activity link to the Contributions graph is added to the user menu.
- Statistics are presented as an activity stream in the Contributions graph.
- In the Contributions graph, a range of days as well as predefined time period values can be selected.
- In the Contributors graph, statistics can be shown for days, weeks or months.
- The Code Frequency graph can be zoomed in, a pop-up tip appears when hovering over the graph
- Data are indexed after the add-on installation and the index is stored persistently.
- Merge commits are excluded from the statistics.
Improved Performance
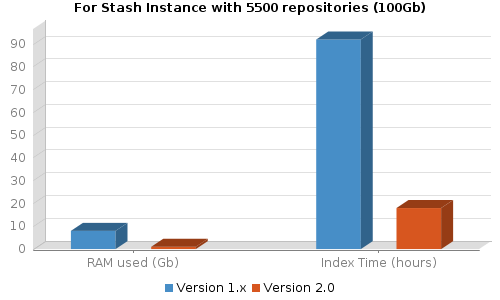
In this release, we switched to a persistent indexing scheme, so now all repositories are indexed only once after the add-on is first installed. The indexed data are stored in the database, and not in RAM as earlier. This solved several performance problems, especially for large repositories, and there's no more reindexing each time you upgrade the add-on or reboot your Stash server.
We tested version 2.0 on a Stash instance with 5500 repositories, and as the chart on the right shows, the new Awesome Graphs turns out to be significantly less resource demanding. Feel free to browse this instance and see the add-on in action.
Shortcut to Contributions
Wherever in Stash you are, you now have a quick and easy way to get to your Contributions graph. We added the My Activity link to the user menu so that you could get to your personal statistics in no time.
To view graphs of other contributors, you need to click their names in the Contributors graph. This works only for those repository contributors who have accounts in Stash.

Flexible Time Periods in User Calendar
Previously, in the Contributions graph you had to hold down Ctrl to select several days in the calendar.
In this version we added a neat way of selecting a range of days by dragging and also several predefined values like Last Week, Last Month, etc. which you can choose from a drop-down menu. This way you now can easily choose either individual days or time periods to see contribution statistics.

Activity Stream instead of Tables
We got rid of tables as a way of showing contributions in favor of activity streams. Activity streams represent user contributions as a sequence of contributions (commits or pull requests) and provide you with more context.
For a commit the add-on now shows commit hash and the repository name where it was made, the list of changed (or added) files and a JIRA issue, if the commit is linked to it. So JIRA issues are not considered contributions as before.
Clicking a JIRA link opens the issue details window where you can edit the issue. This is a standard Stash behavior that we adopted in our add-on.

Stats for Day, Week or Month?
In the Contributors graph, it's now possible to choose how you would like to group contributions. In older versions, it was always weeks, from version 2.0.0 you can additionally choose days or months in the Group by section above the graph. The graphs changes instantly as you click the corresponding buttons. Contributors personal graphs in the lower part are also affected by your choice.

Navigable Code Frequency
The Code Frequency graph now allows zooming in and out and moving across the timeline when zoomed. This can help you check specific periods of time in more detail. Moreover, we added a pop-up tip that appears when you hover over the graph. The tip shows the number of added and deleted code lines and a total for a specific day in the graph.
You can navigate the graph using mouse zooming it in and out with a mouse wheel. Alternatively, you can use buttons above the graph.
