This feature is available only under a commercial or evaluation license.
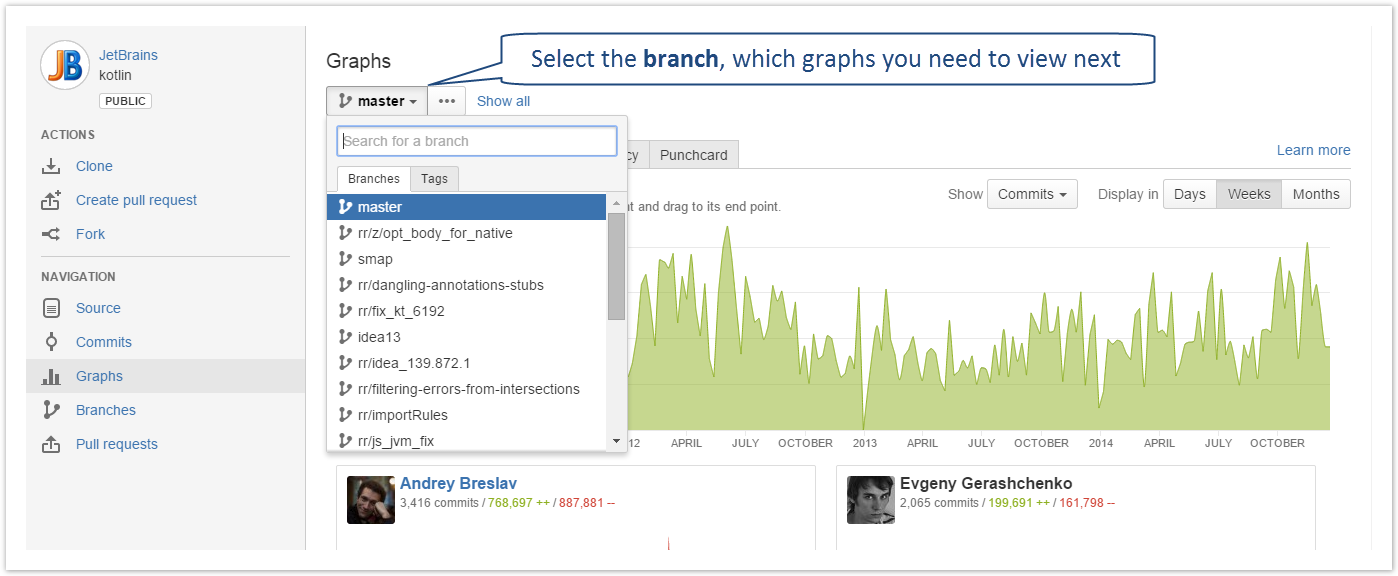
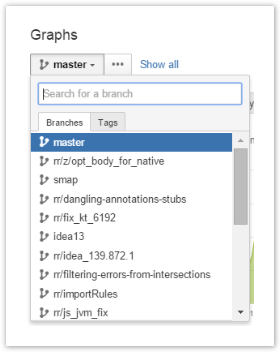
While in the Graphs tab in one of your repositories, you can see the Branch Selection drop-down menu with the list of all the branches of the current repository. Use it to quickly select the branch, which graphs, chart or punch card you need to view next.
Graphs and charts for one branch
You can get Contributors Graph, Commits Chart, Commit Graph, Code Frequency Graph and Punch Card based on the statistic aggregated within one branch.
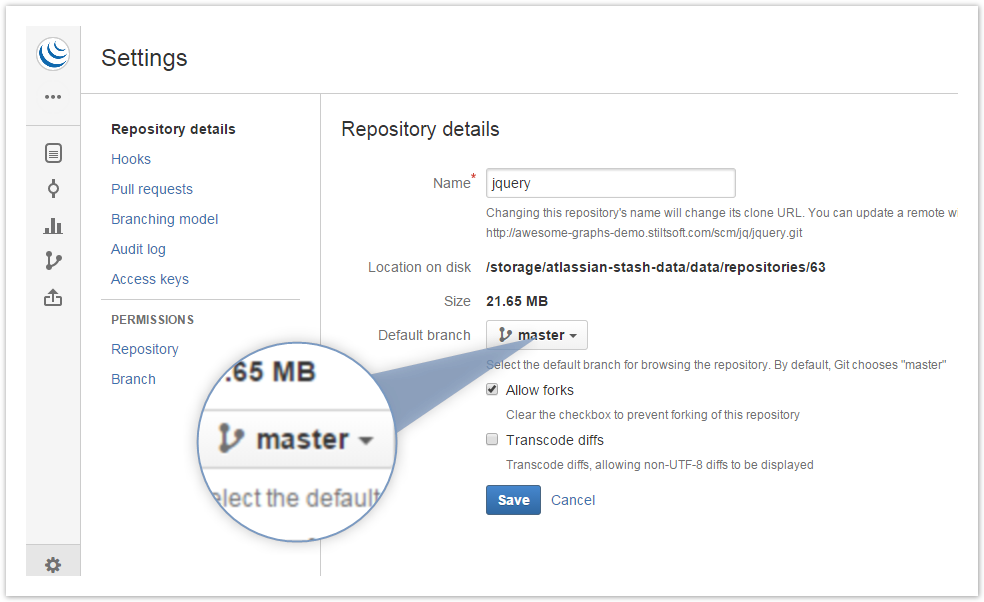
By default, Awesome Graphs displays the statistics of the branch that is set as a default one for the current repository.
To change a branch, navigate to the Branch Selection drop-down menu, find the needed branch using the search filter, select it. Awesome Graphs will immediately start plotting the Graphs for the chosen branch.
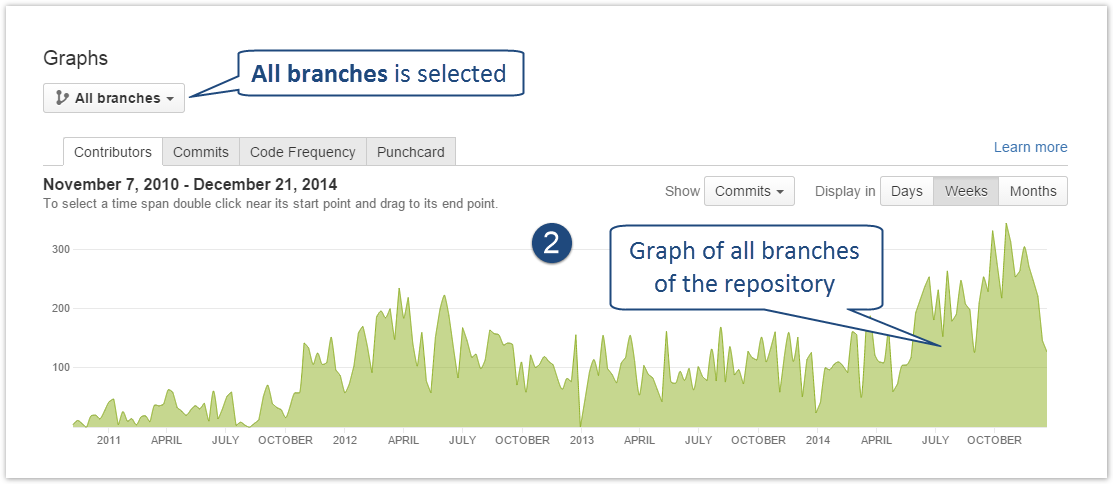
Graphs and charts for all branches of a repository
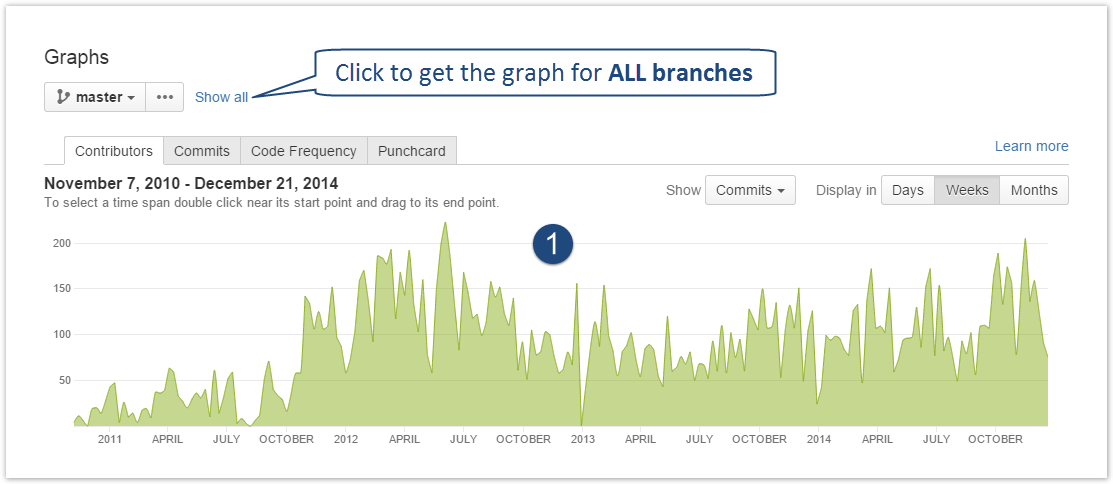
Besides the Graphs for one branch, you can get Activity, Contributors Graph, Commits Chart, Code Frequency Graph and Punch Card based on the statistic aggregated across all branches of the current repository. There's the Show all button to the left of the Branch Selection drop-down menu. Click it and the selected graph (chart, punch card) will display the joint statistics of all the branches of the current repository.
You can also view branch graphs while in the Graphs tab in one of the projects. Learn more