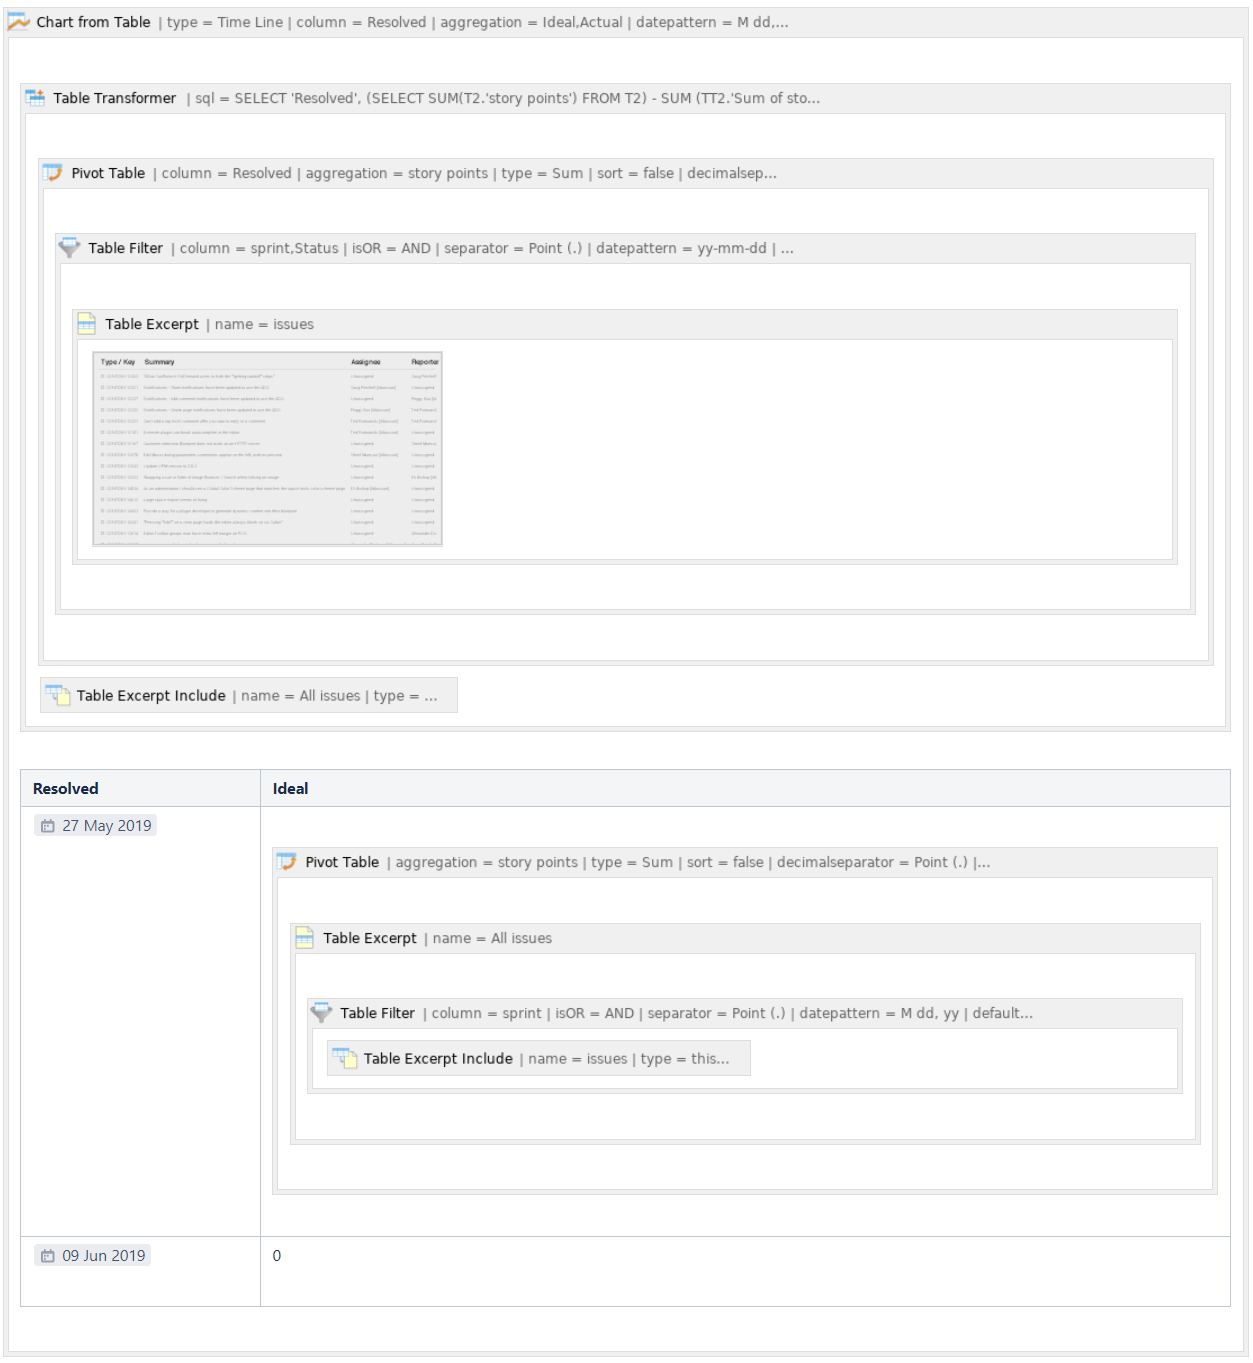
Wrap the Jira Issues macro in the Table Filter macro.
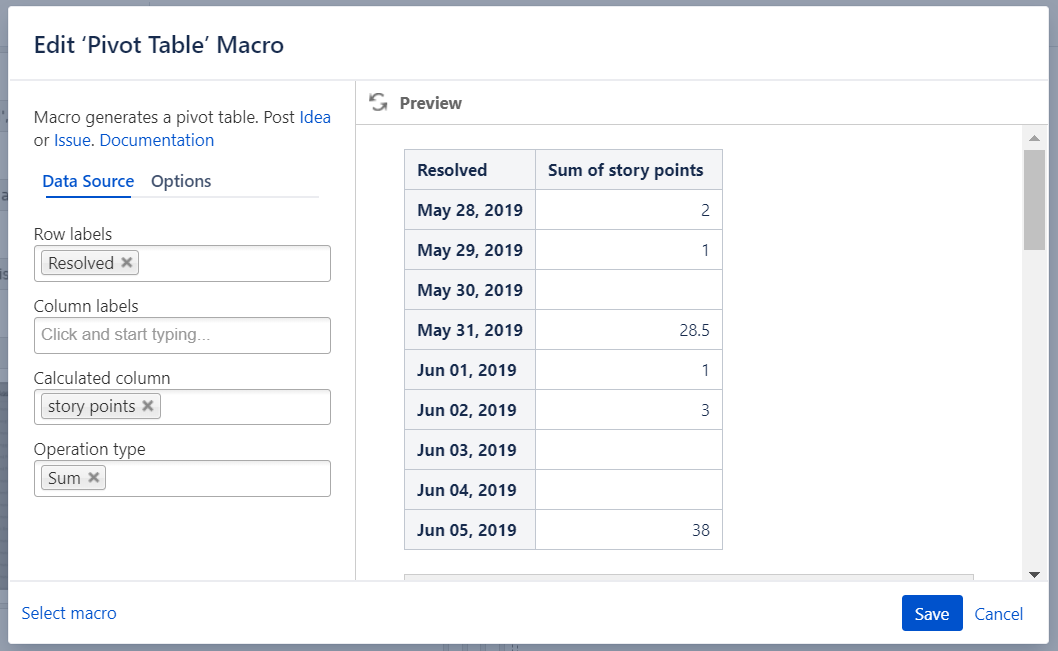
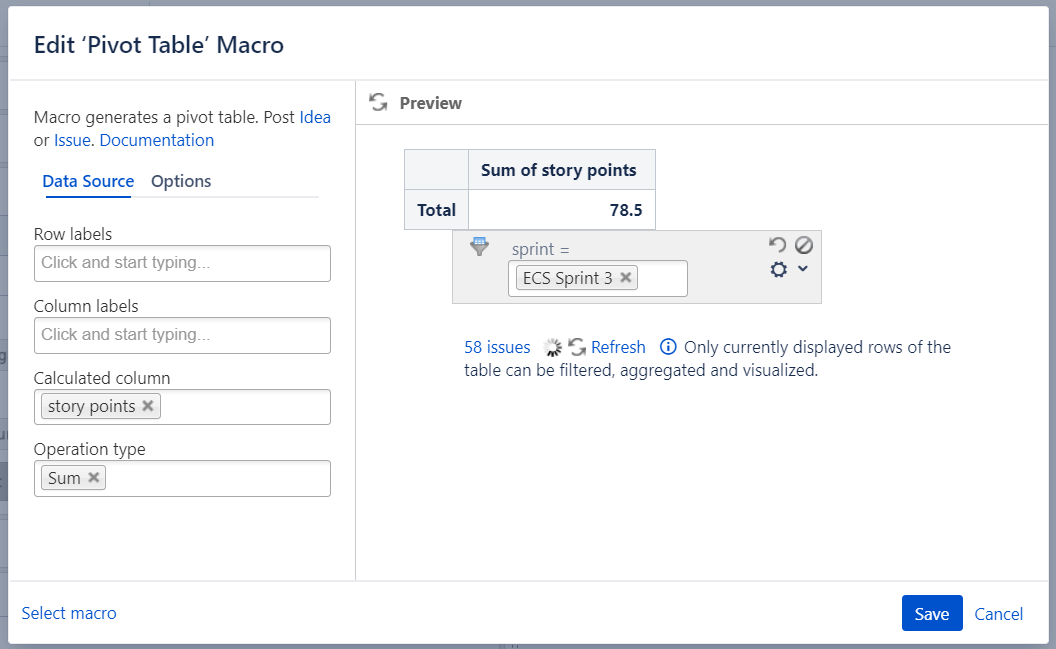
Wrap the Table Filter macro in the Pivot Table macro.
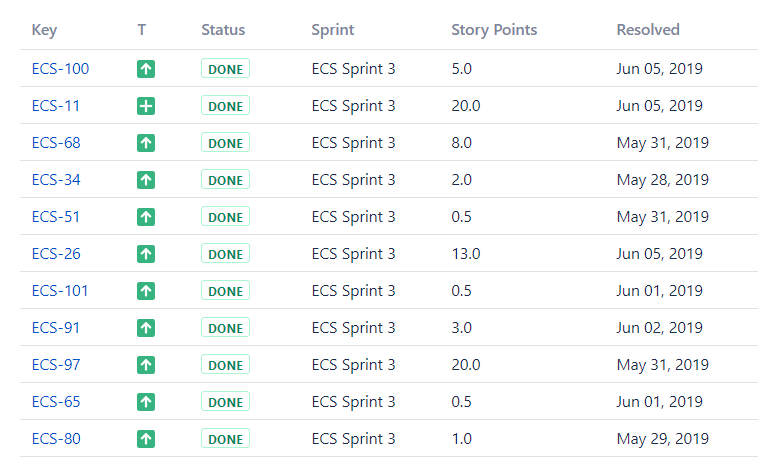
Insert the Jira issues macro with all the issues from the particular sprint (or use the Table Excerpt and Table Excerpt Include macros to reuse the filtered Jira Issues macro from Table2).
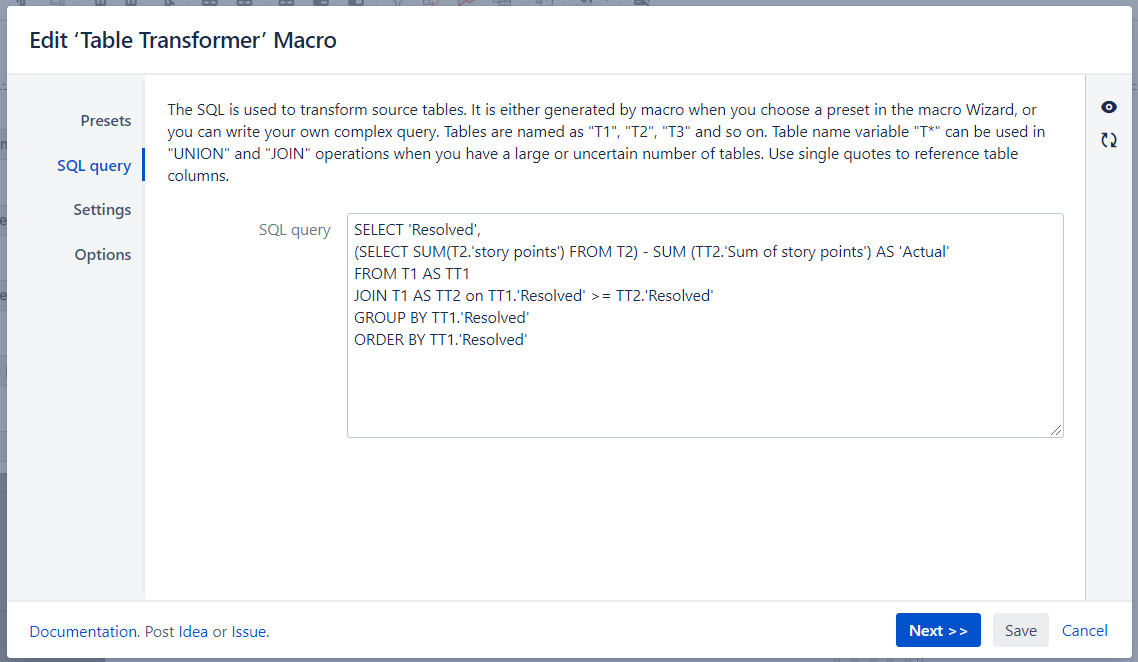
Wrap the Pivot Table macro and the Jira Issues macro in the Table Transformer macro.
SELECT 'Resolved',
(SELECT SUM(T2.'story points') FROM T2) - SUM (TT2.'Sum of story points') AS 'Actual'
FROM T1 AS TT1
JOIN T1 AS TT2 on TT1.'Resolved' >= TT2.'Resolved'
GROUP BY TT1.'Resolved'
ORDER BY TT1.'Resolved'
SQL
Or use this one if the Cumulative countoption (available since the 7.4.0 version of the app) is enabled in Pivot Table:
SELECT 'Resolved',
(SELECT SUM(T2.'Story points') FROM T2) - SUM (T1.'Sum of Story points') AS 'Actual'
FROM T1
GROUP BY T1.'Resolved'
ORDER BY T1.'Resolved'