Overview


                                                            The Source Table:

                                                The Result:

Macro combination (the chart is based on two transformed pivot tables):

Step 1. Configure Table1:

  1. Insert the Jira Issues macro.
  2. Wrap the Jira issues macro in the Pivot Table macro.
  3. Wrap the Pivot Table macro in the Table Transformer macro.

Step 2. Configure Table2:

  1. Insert the Jira Issues macro.
  2. Wrap the Jira Issues macro in the Table Filter macro.
  3. Wrap the Table Filter macro in the Pivot Table macro.
  4. Wrap the Pivot Table macro in the Table Transformer macro.

Step 3. Wrap Table1 and Table2 in the Chart from Table  macro.

Macro configuration:

Step 1. Configure Table1:

Pivot Table:
Row LabelsCreated
Column Labels-
Calculated ColumnSummary
Operation TypeCount

Additional parameters:

Table Transformer:
Use the following SQL query:

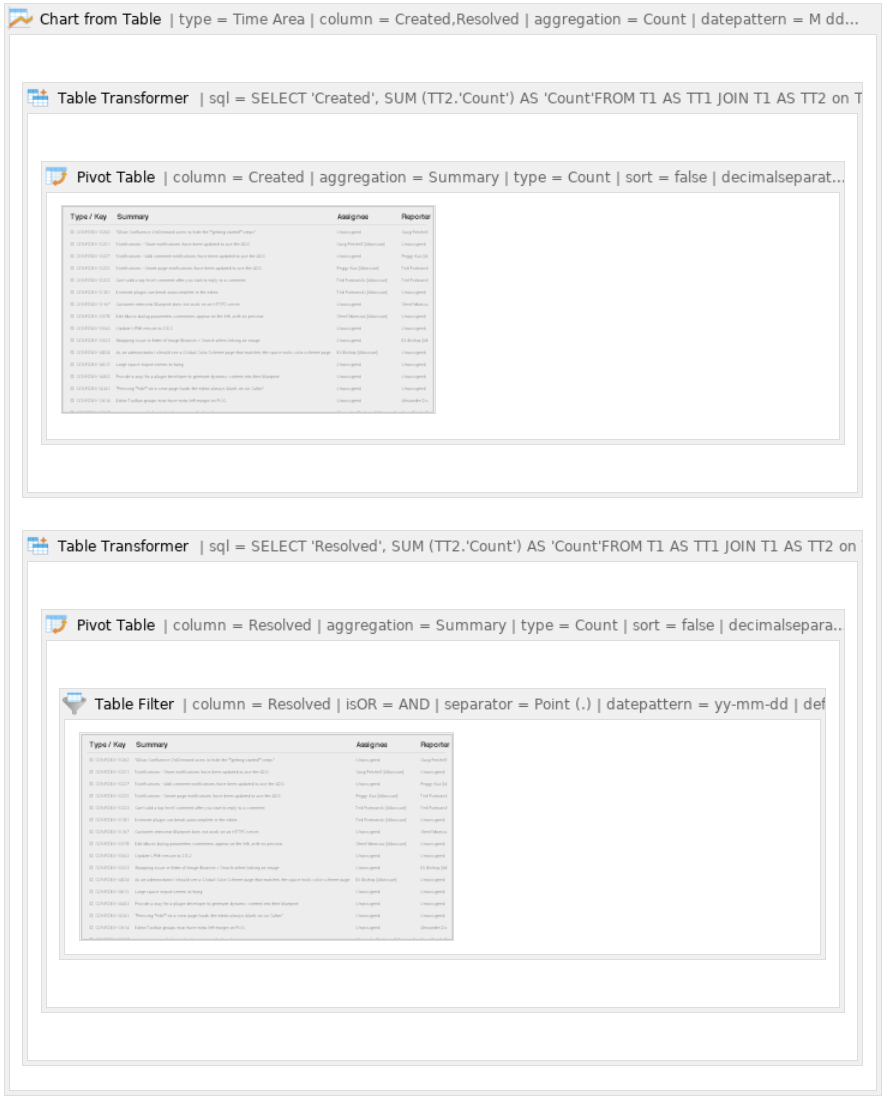
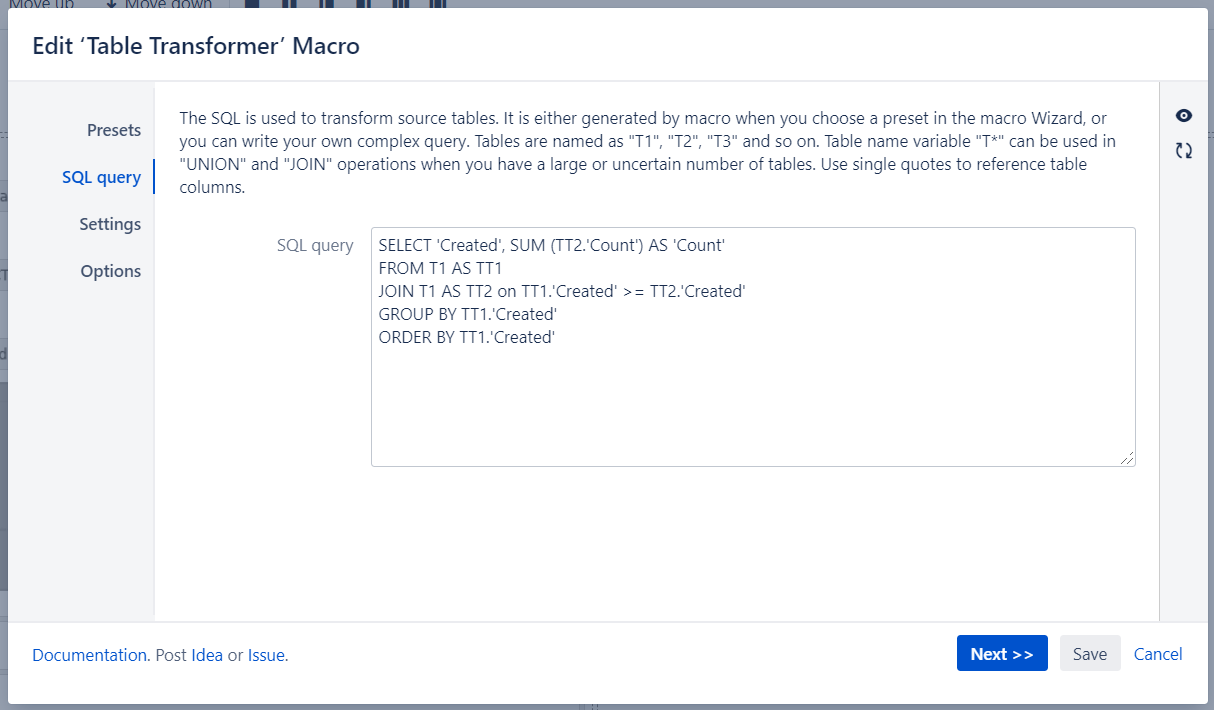
SELECT 'Created', SUM (TT2.'Count') AS 'Count'
FROM T1 AS TT1 
JOIN T1 AS TT2 on TT1.'Created' >= TT2.'Created'
GROUP BY TT1.'Created'
ORDER BY TT1.'Created'
SQL

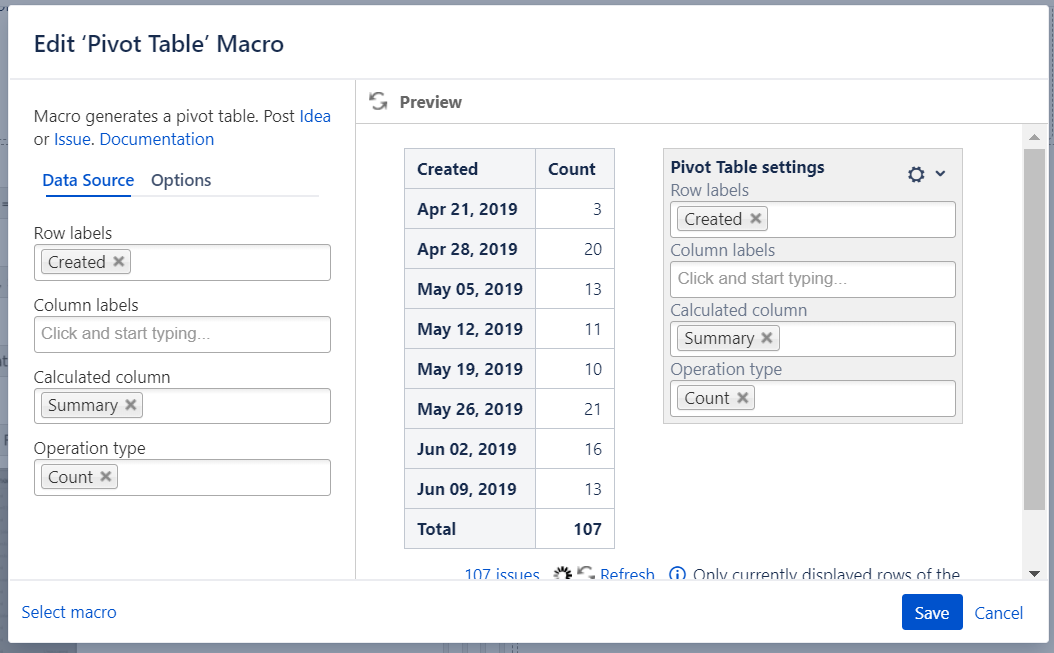
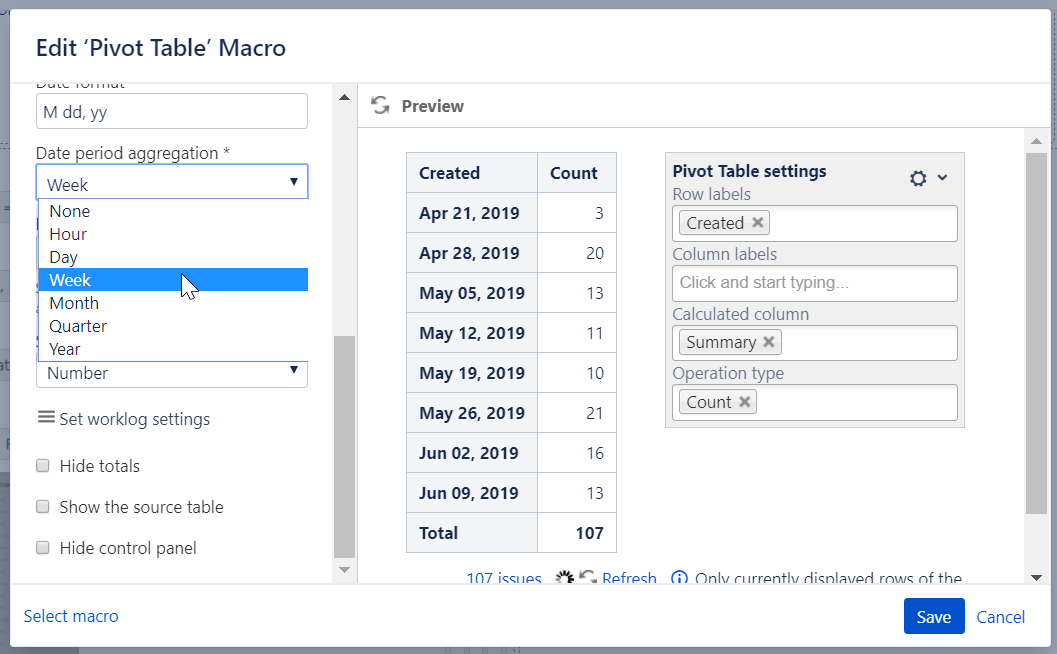
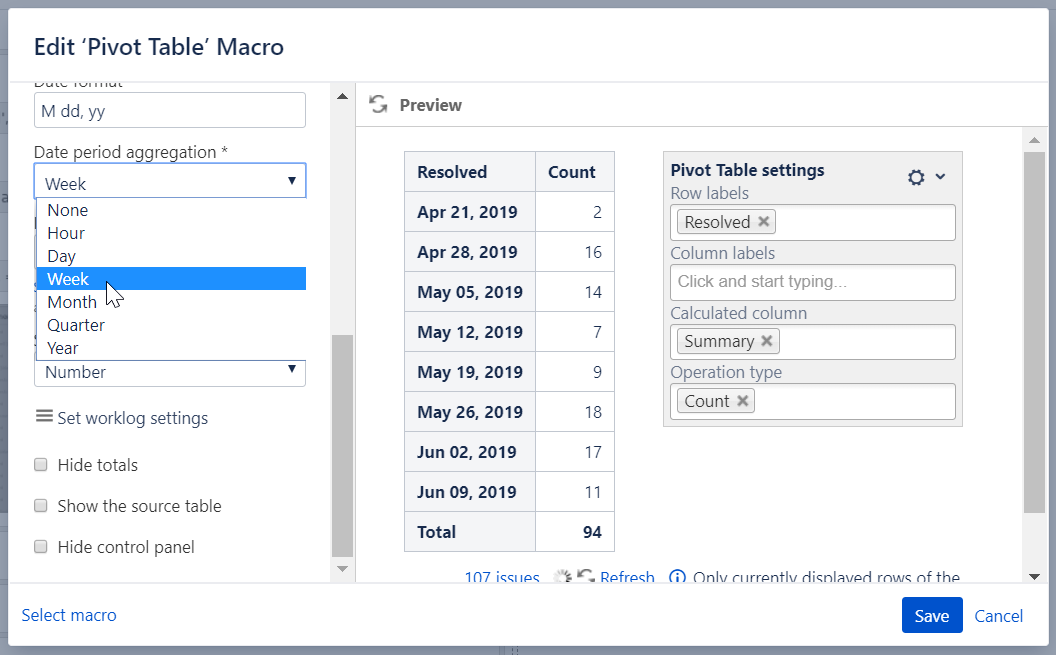
Instead of using Table Transformer, since the 7.4.0 version of the app, you can enable the Cumulative count option in the Pivot Table macro.


Step 2. Configure Table2:

Table Filter:

Filter Column

Resolved

Filter Type

Dropdown

Filter Values

Reversed filter '-empty-'

Pivot Table:

Row Labels

Resolved

Column Labels

-

Calculated Column

-

Operation Type

Count

Additional parameters:

Table Transformer:
Use the following SQL query:

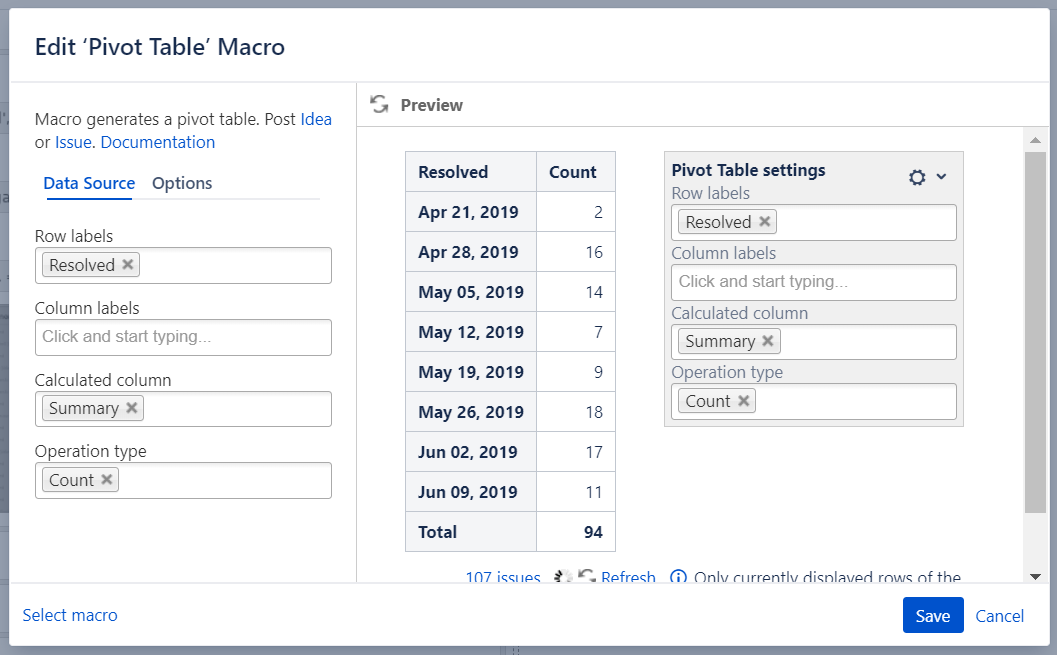
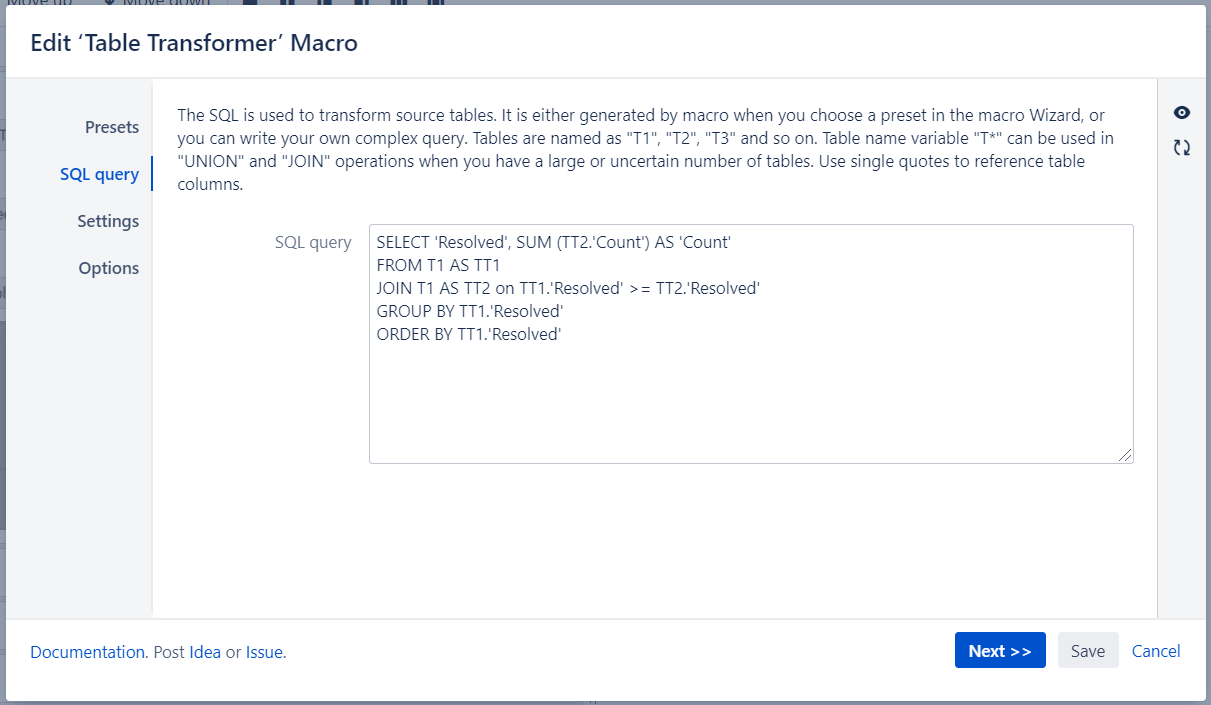
SELECT 'Resolved', SUM (TT2.'Count') AS 'Count' FROM T1 AS TT1 JOIN T1 AS TT2 on TT1.'Resolved' >= TT2.'Resolved' GROUP BY TT1.'Resolved' ORDER BY TT1.'Resolved'
SQL


Step 3.
Wrap Table1 and Table2 in the Chart from Table macro.

Chart from Table:

Type

Time Area

Dates Column

Created, Resolved

Values Column

Count