Overview
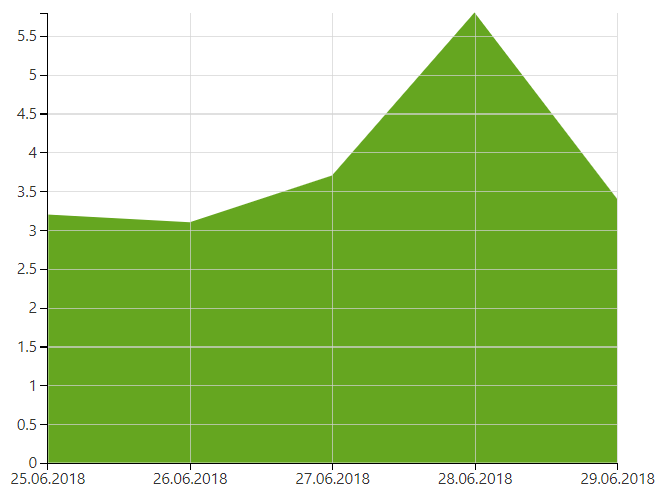
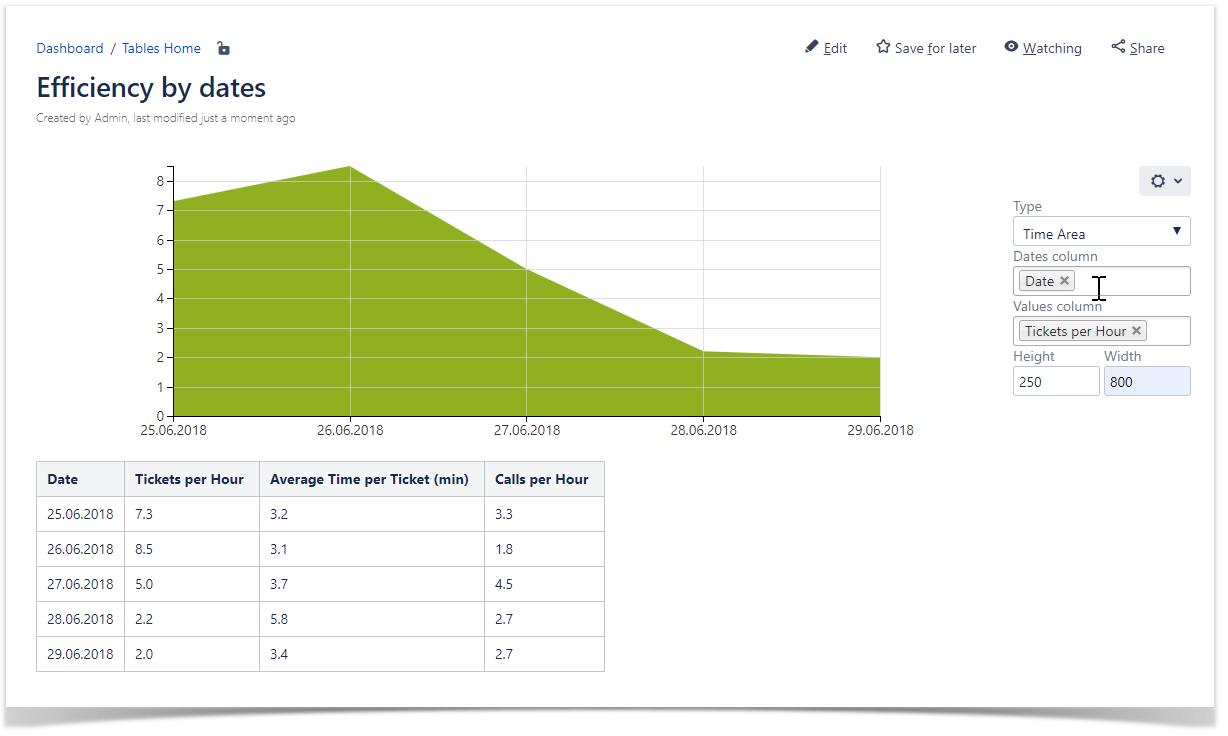
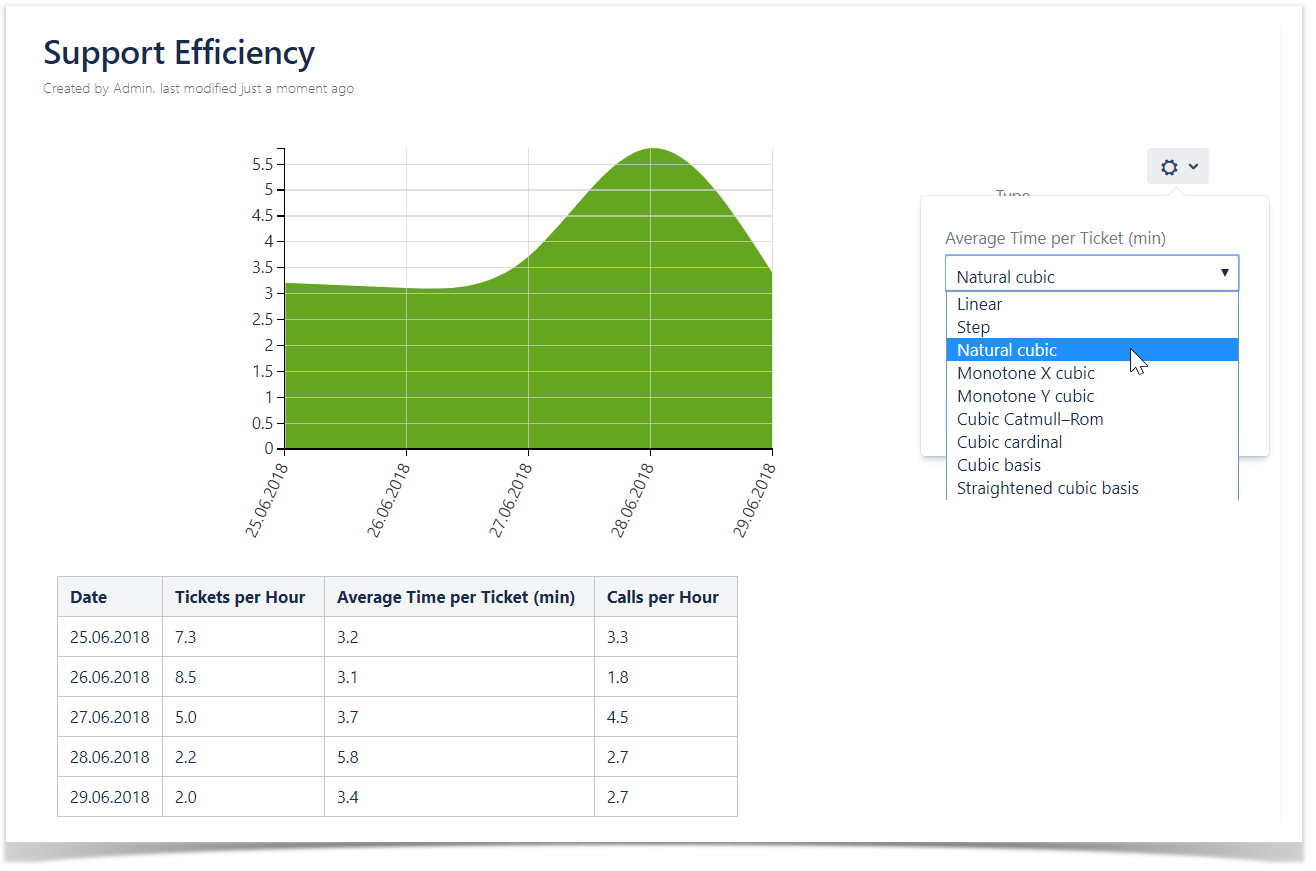
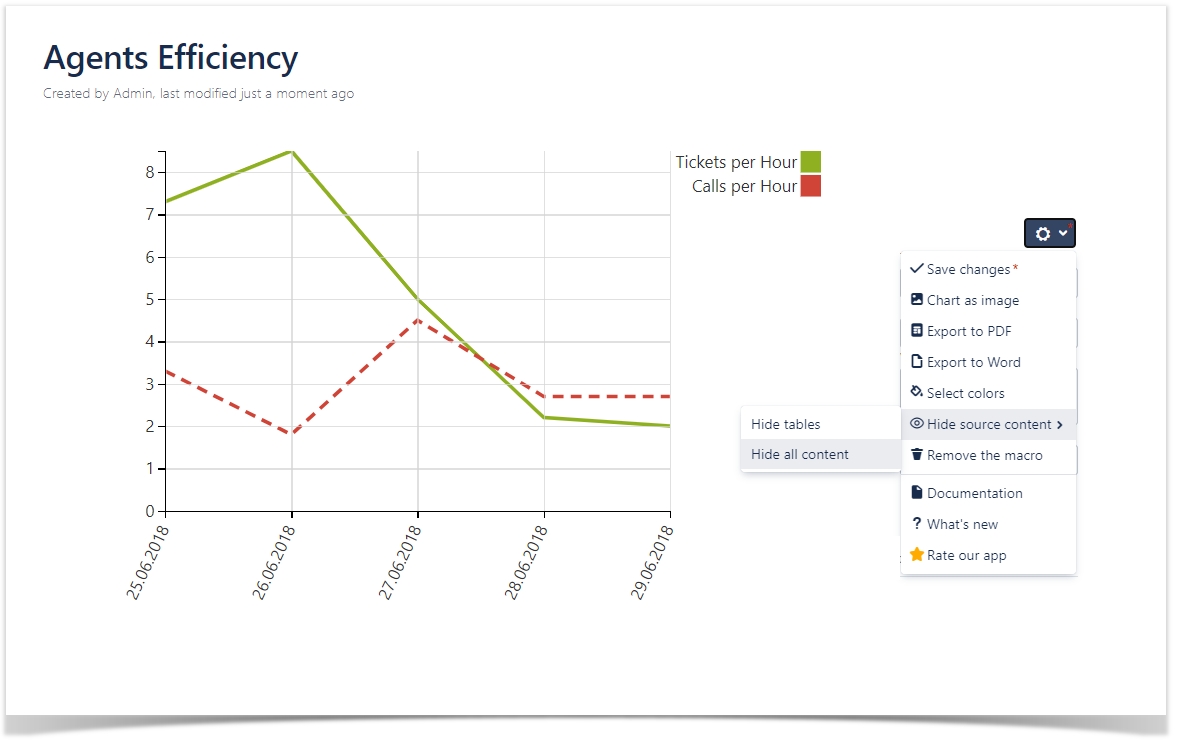
Rendered Chart
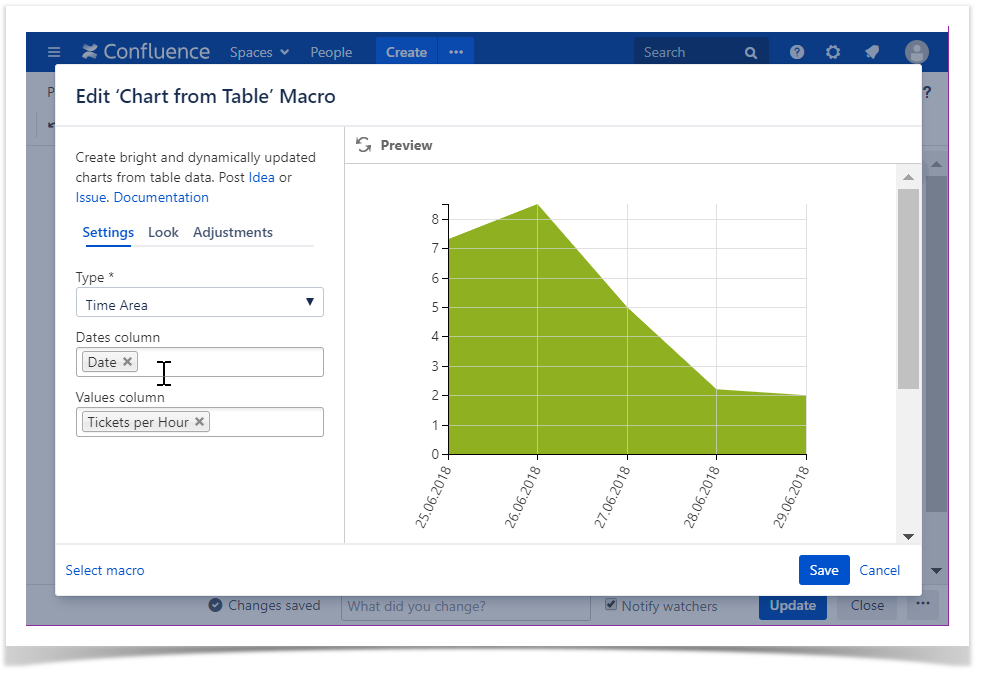
Parameters in Macro Browser
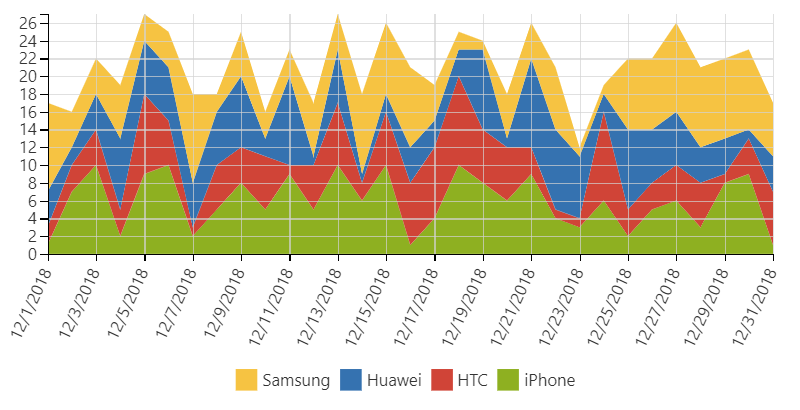
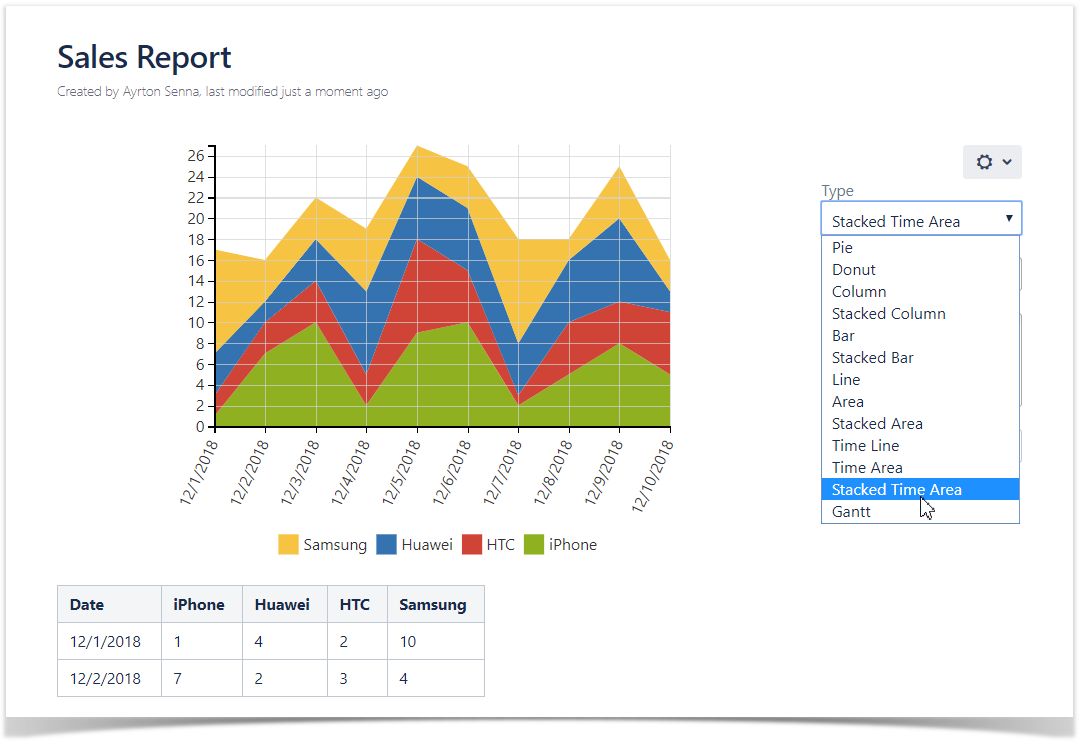
| Type | Time line / Time area / Stacked time area |
|---|---|
| Values Column | Average Time per Ticket (min) |
| Dates column | Date |
Data Table in Macro Placeholder
| Date | Tickets per Hour | Average Time per Ticket (min) | Calls per Hour |
|---|---|---|---|
| 25.06.2018 | 7.3 | 3.2 | 3.3 |
| 26.06.2018 | 8.5 | 3.1 | 1.8 |
| 27.06.2018 | 5.0 | 3.7 | 4.5 |
| 28.06.2018 | 2.2 | 5.8 | 2.7 |
| 29.06.2018 | 2.0 | 3.4 | 2.7 |
Settings Tab
Select the chart type
To select the chart type in the page view mode:
- Insert the Chart from Table macro.
- Hover over the chart controls on the right of the table.
- Locate the Type option and select the chart type. The chart will be automatically re-generated.
- To save the modifications in the macro body, click the cogwheel icon and select Save changes .
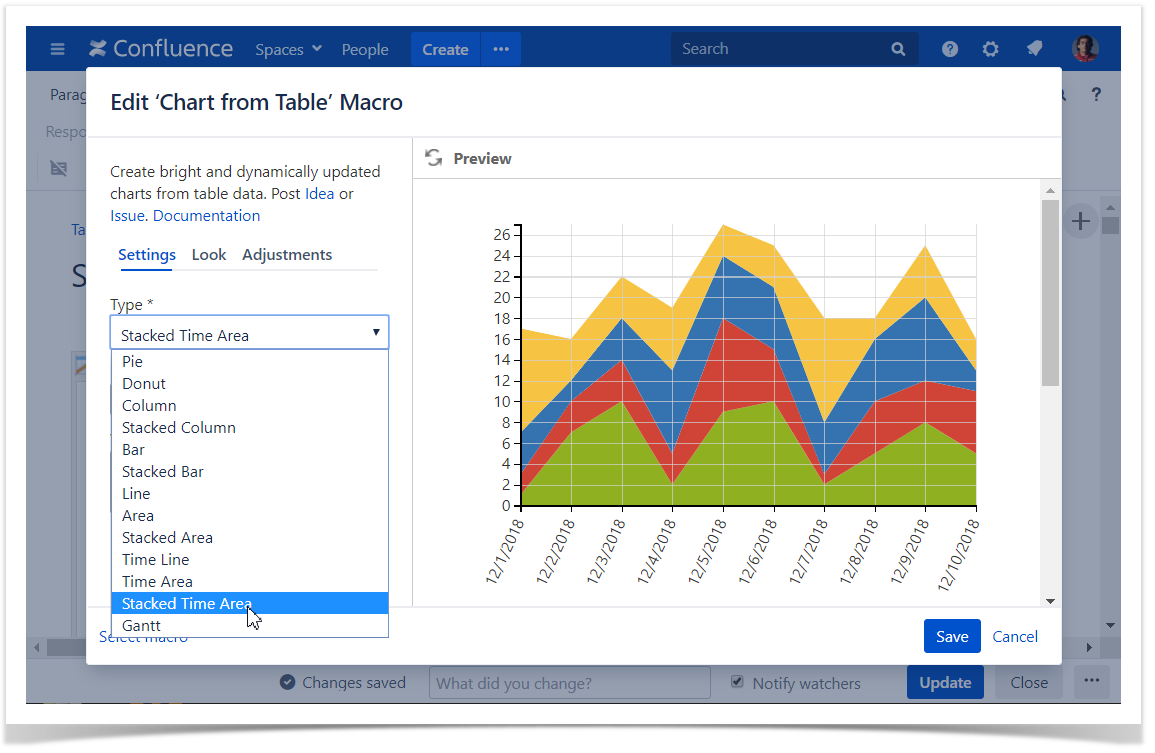
To select the chart type in the macro browser:
- Switch the page to the edit mode.
- Insert the Chart from Table macro and paste the table within the macro body.
- Select the macro and click Edit.
- Locate the Type option in the Settings tab and select the chart type.
- Save the macro and the page.
Select data series
Dates column - the column with dates for chart generation (horizontal axis).
Values column - the column or columns containing numerical values for chart generation (vertical axis).
To select data series in the page view mode:
- Insert the Chart from Table macro.
- Hover over the chart controls on the right of the table.
- Locate the Dates column and Values column options and select the table columns containing data for chart generation. The chart will be automatically re-generated.
- To save the modifications in the macro body, click the cogwheel icon and select Save changes .
To select data series in the macro browser:
- Switch the page to the edit mode.
- Insert the Chart from Table macro and paste the table within the macro body.
- Select the macro and click Edit.
- Locate the Dates column and Values column options in the Settings tab and select the table columns containing data for chart generation.
- Save the macro and the page.
Adjustments Tab
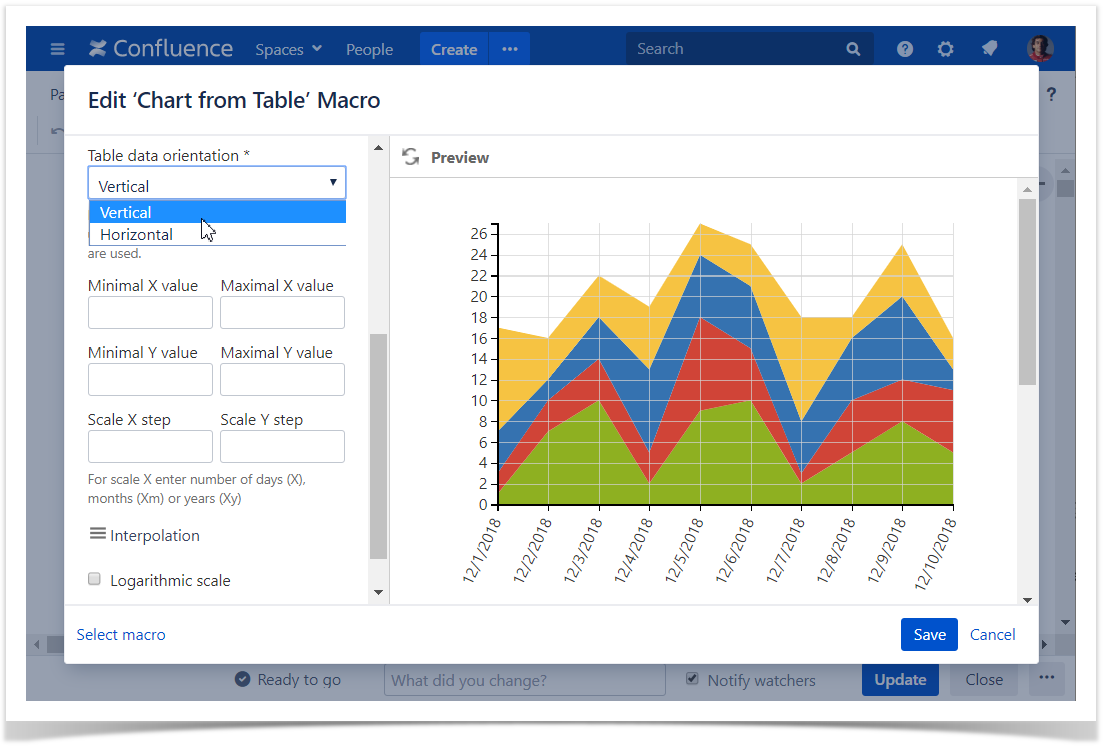
Set the table data orientation
- Switch the page to the edit mode.
- Select the macro and click Edit.
- Switch to the Adjustments tab.
- Locate the Table data orientation option.
- Select the Vertical or Horizontal option.
- Save the macro and the page.
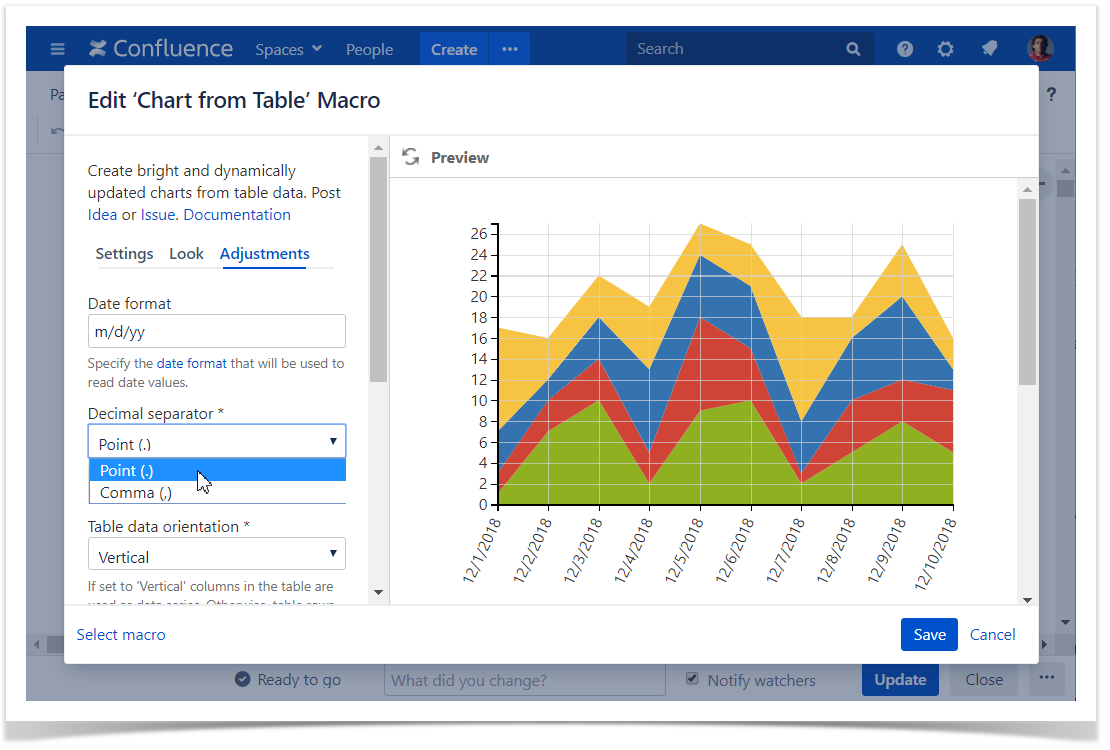
Set the decimal separator
- Switch the page to the edit mode.
- Select the macro and click Edit.
- Switch to the Adjustments tab.
- Locate the Decimal separator option.
- Specify the correct decimal separator for numeric values in the source table (point or comma).
- Save the macro and the page.
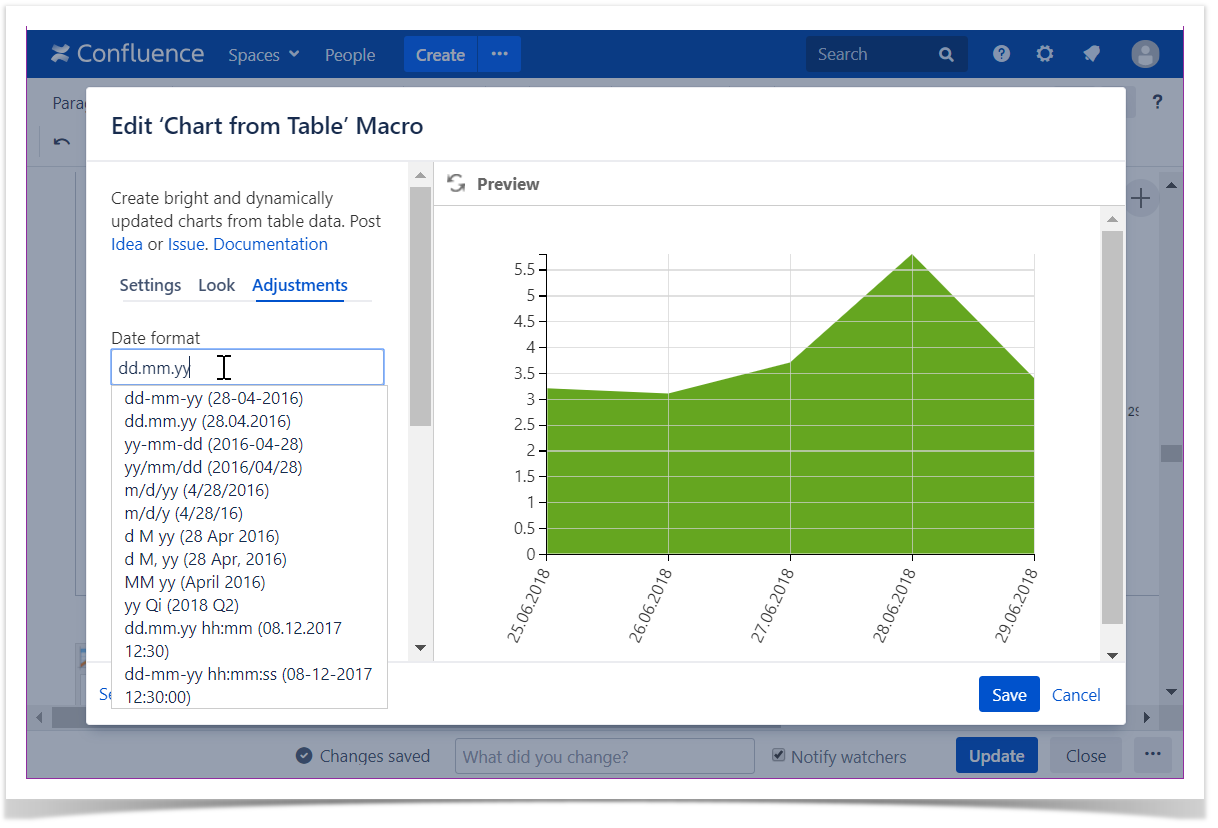
Set the date format
- Switch the page to the edit mode.
- Select the macro and click Edit.
- Switch to the Adjustments tab.
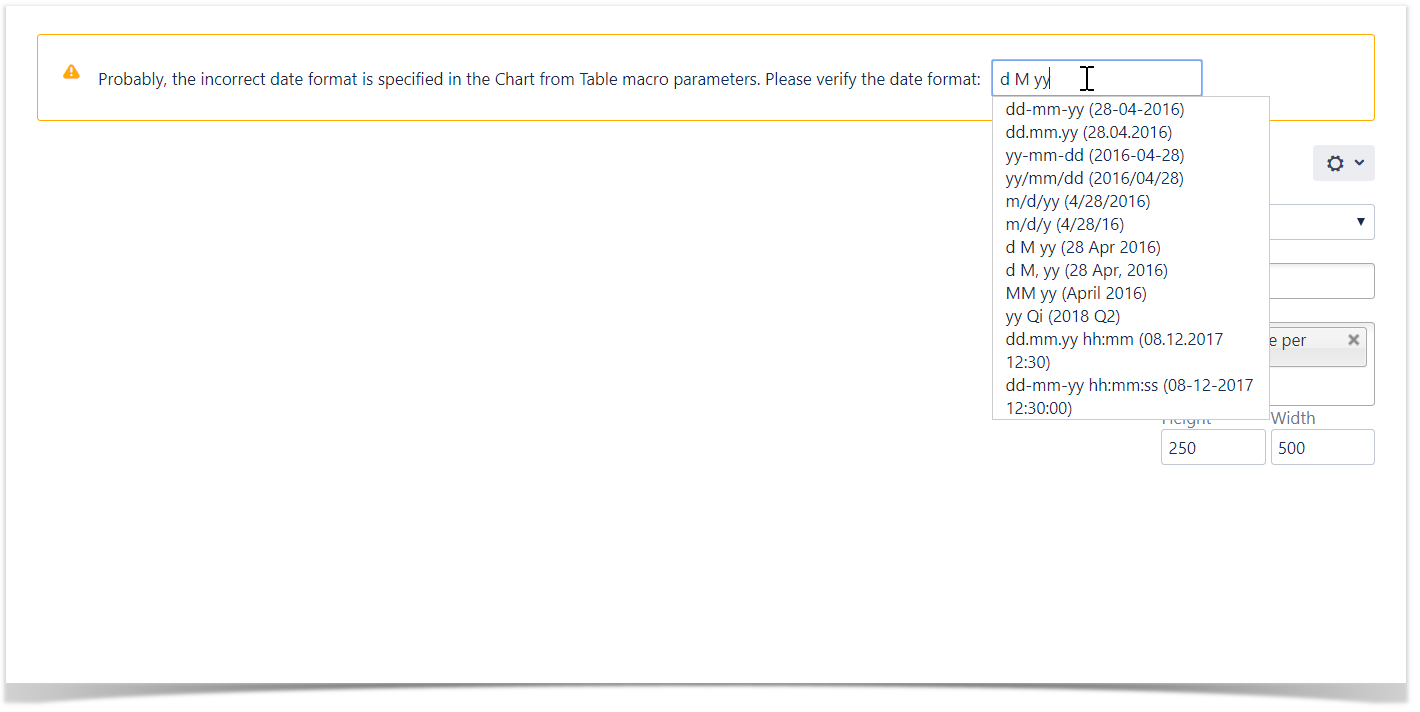
- Locate the Date format option.
- Specify the correct date format for date values in the source table.
- Save the macro and the page.
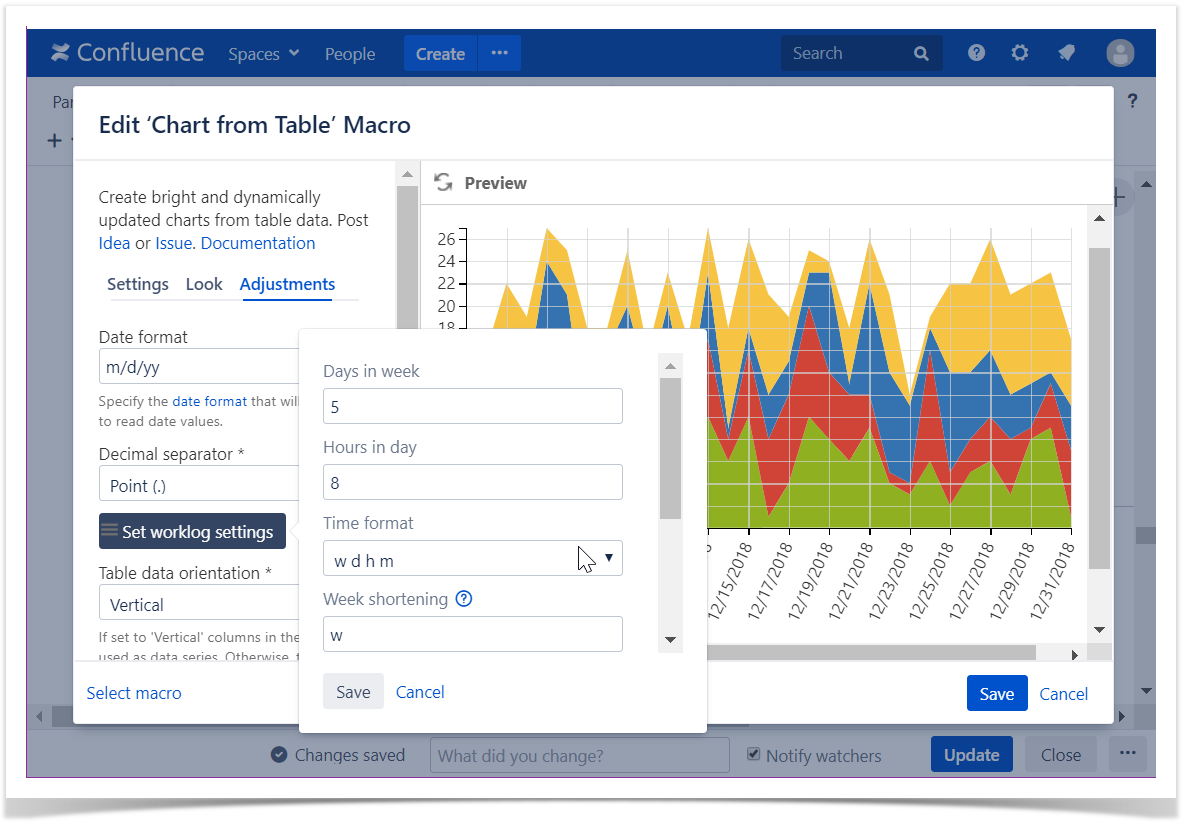
Set the worklog settings
- Switch the page to the edit mode.
- Select the macro and click Edit .
- Switch to the Adjustments tab.
- Click the Set worklog settings button.
- In the opened form, define the worklog parameters, as follows:
- Days in week - enter the number of business days in a week.
- Hours in day - enter the number of working hours in one business day.
- Time format - select the used time format in worklog values.
- Week shortening - enter the shortening for the week time unit if you use any language different from English.
- Day shortening - enter the shortening for the day time unit if you use any language different from English.
- Hour shortening - enter the shortening for the hour time unit if you use any language different from English.
- Minute shortening - enter the shortening for the minute time unit if you use any language different from English.
- Save the macro and the page.
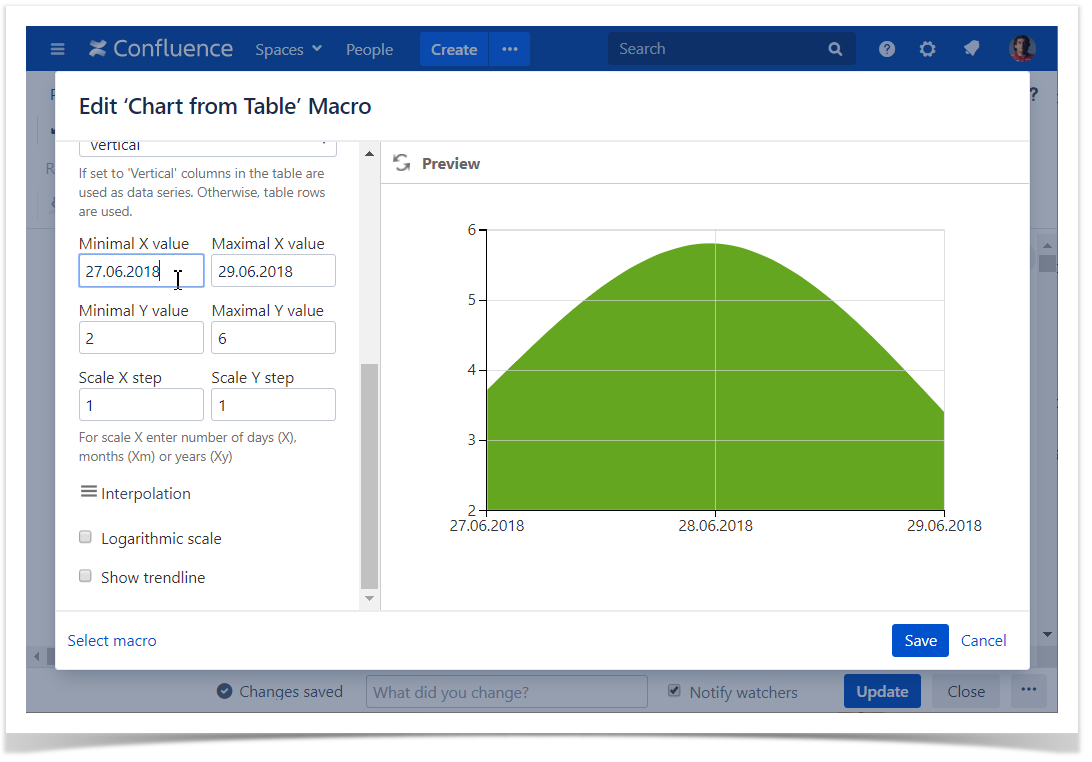
Set the minimal and maximal values
Minimal X (Y) value - the minimal value for X (Y) axis for showing only data values greater than the specified minimal value.
Maximal X (Y) value - the maximal value for X (Y) axis for showing only data values not greater than the specified maximal value.
- Switch the page to the edit mode.
- Select the macro and click Edit.
- Switch to the Adjustments tab.
- Locate the Minimal X (Y) and Maximal X (Y) value options and set the minimal and maximal values.
- Save the macro and the page.
Set the scale step
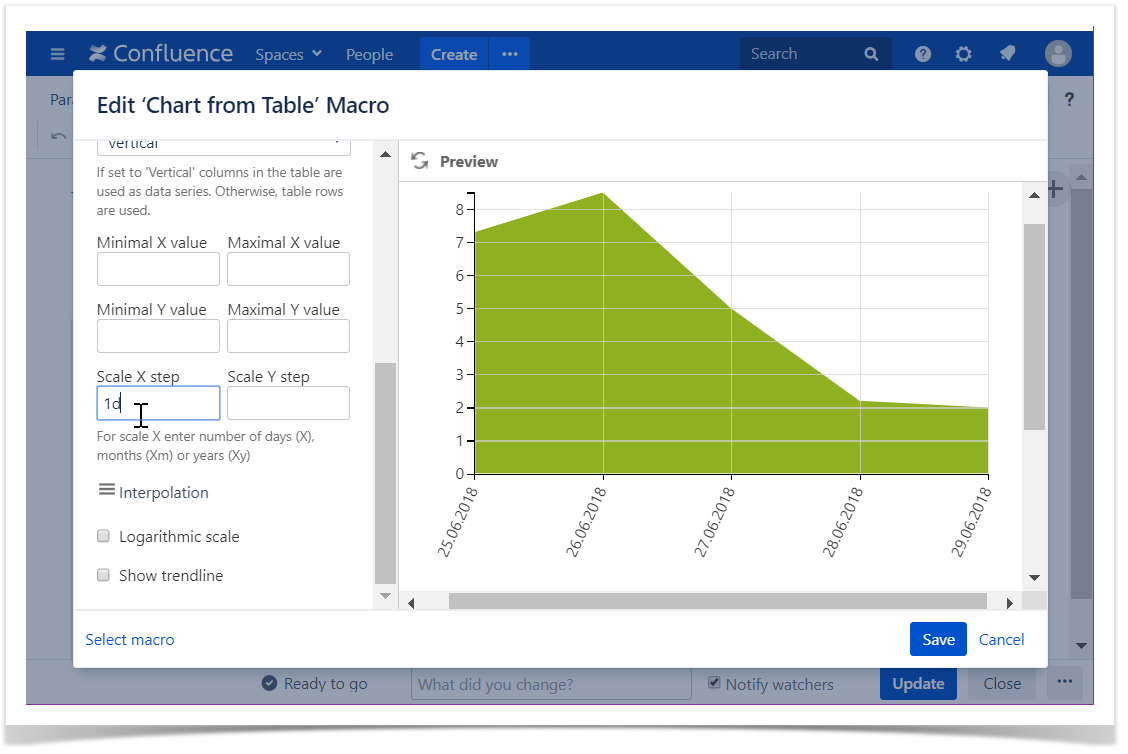
Scale X (Y) Step - the required scale step of X axis or Y axis for showing the chart.
You can specify the appropriate number of days (Xd), months (Xm) or years (Xy) where the 'X' is the digit, as follows:
- 10d = 10 days as a scale step
- 1m = 1 month as a scale step
- 2y = 2 years as a scale step
Scale Y Step - the required scale step of Y axis for showing the chart.
- Switch the page to the edit mode.
- Select the macro and click Edit.
- Switch to the Adjustments tab.
- Locate the Scale X (Y) Step options and set the scale step.
- Save the macro and the page.
Set the logarithmic scale
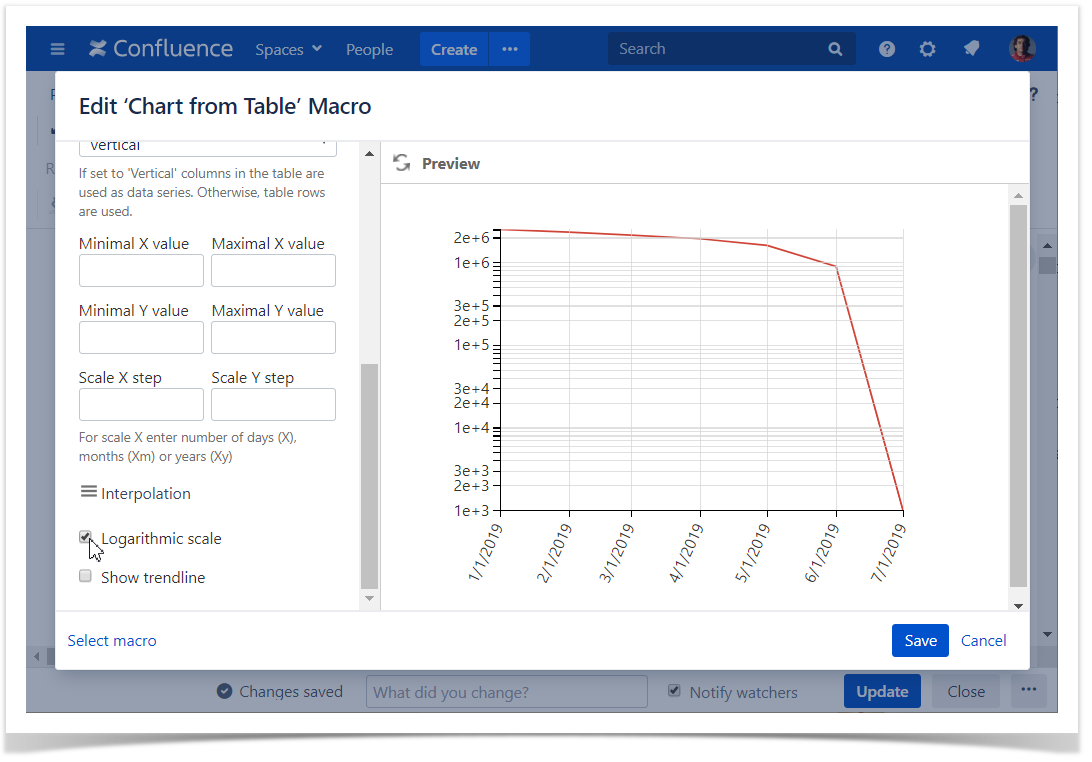
Logarithmic Scale - the option for very small or very large numeric values that cannot be properly aligned on the standard arithmetic scale.
- Switch the page to the edit mode.
- Select the macro and click Edit.
- Switch to the Adjustments tab.
- Locate the Logarithmic Scale option and enable the option.
- Save the macro and the page.
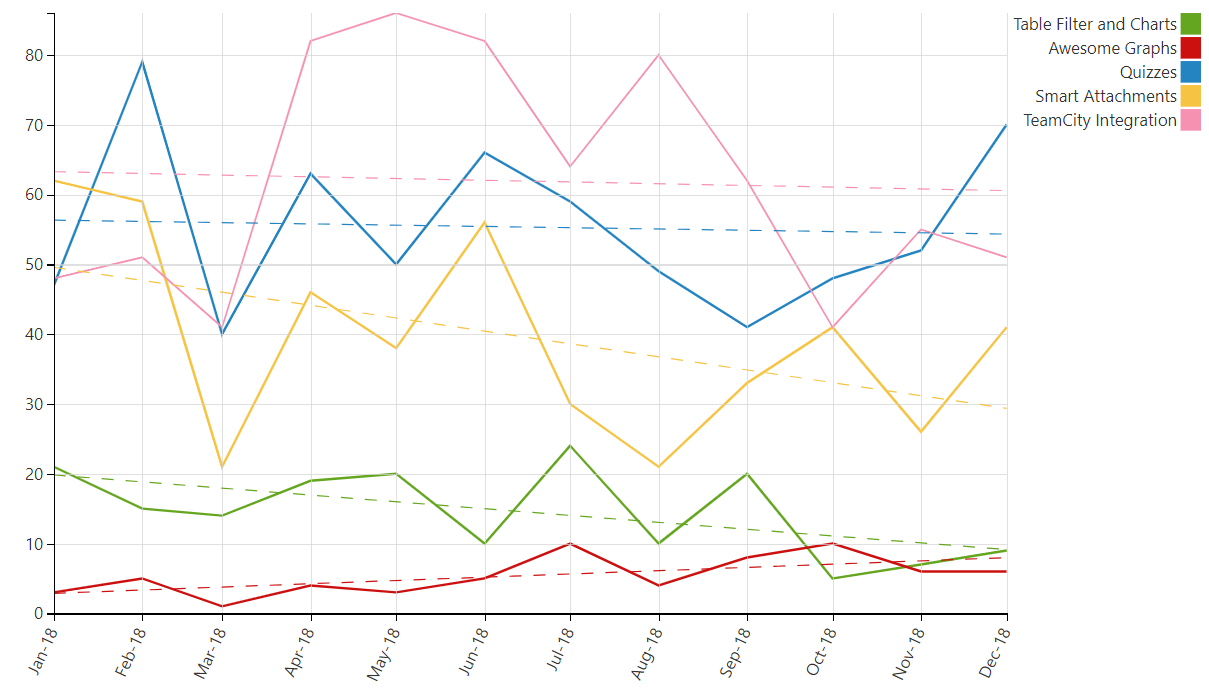
Show trendline
- Switch the page to the edit mode.
- Select the macro and click Edit.
- Switch to the Adjustments tab.
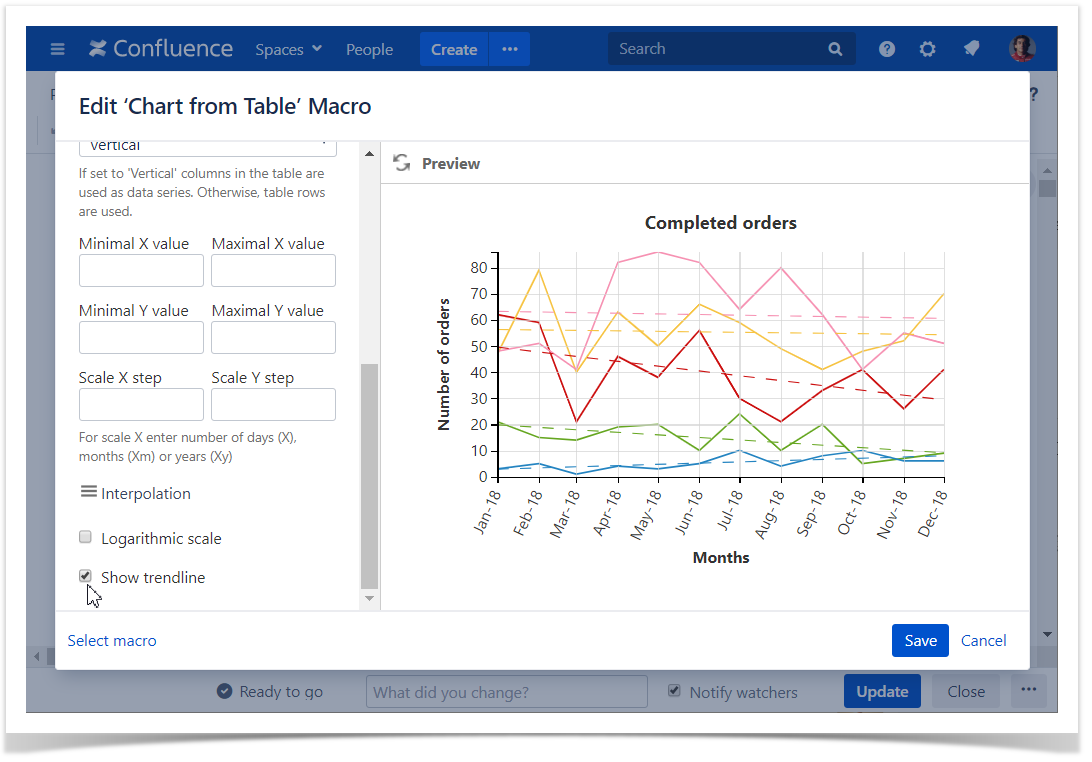
- Locate and enable the Show trendline option.
- Save the macro and the page.
Set the interpolation
- Switch the page to the edit mode.
- Select the macro and click Edit.
- Switch to the Adjustments tab.
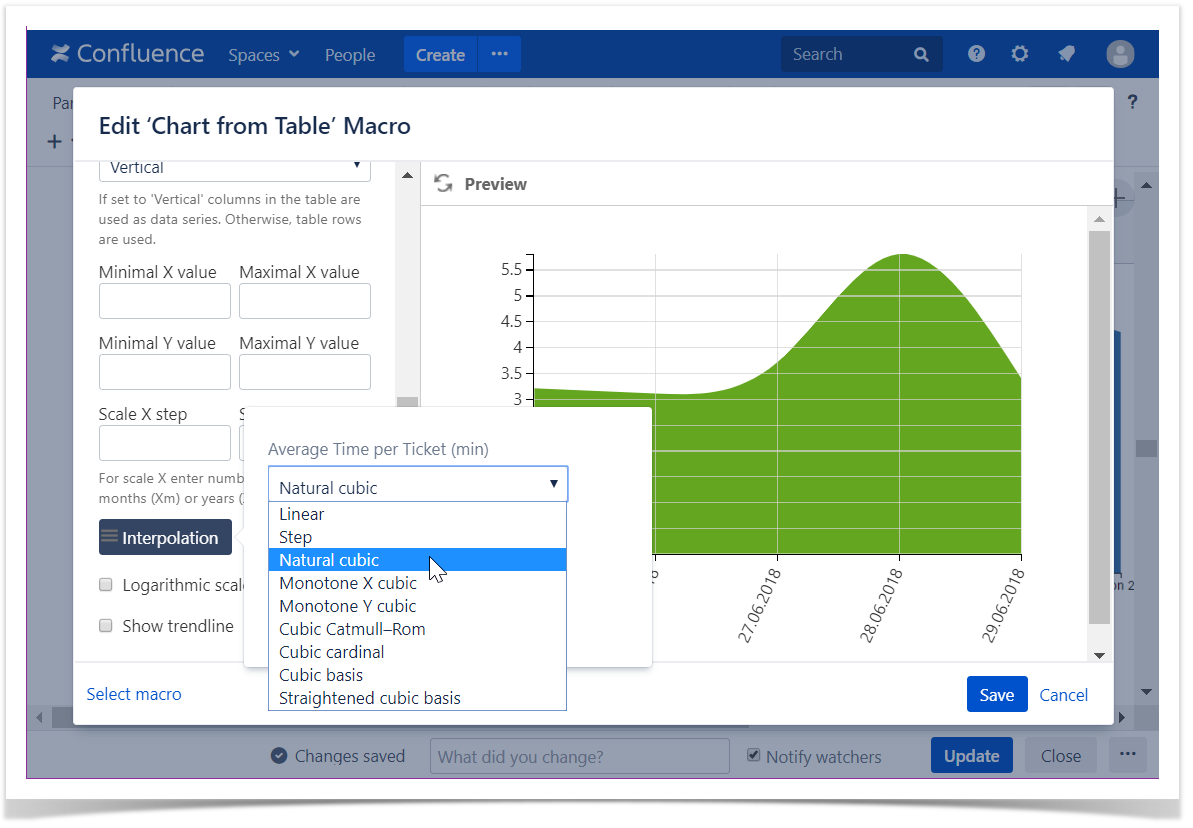
- Locate and select the Interpolation method for each line in your chart:
- Linear
- Step
- Natural cubic
- Monotone X cubic
- Monotone Y cubic
- Cubic Catmull-Rom
- Cubic cardinal
- Cubic basis
- Straightened cubic basis
- Save the macro and the page.
To set the interpolation in the page view mode:
- Hover over the chart controls on the right of the table.
Click the cogwheel icon, select the Set interpolation option and choose the method. The chart will be automatically re-generated.
To save the modifications in the macro body, click the cogwheel icon and select Save changes.
Look Tab
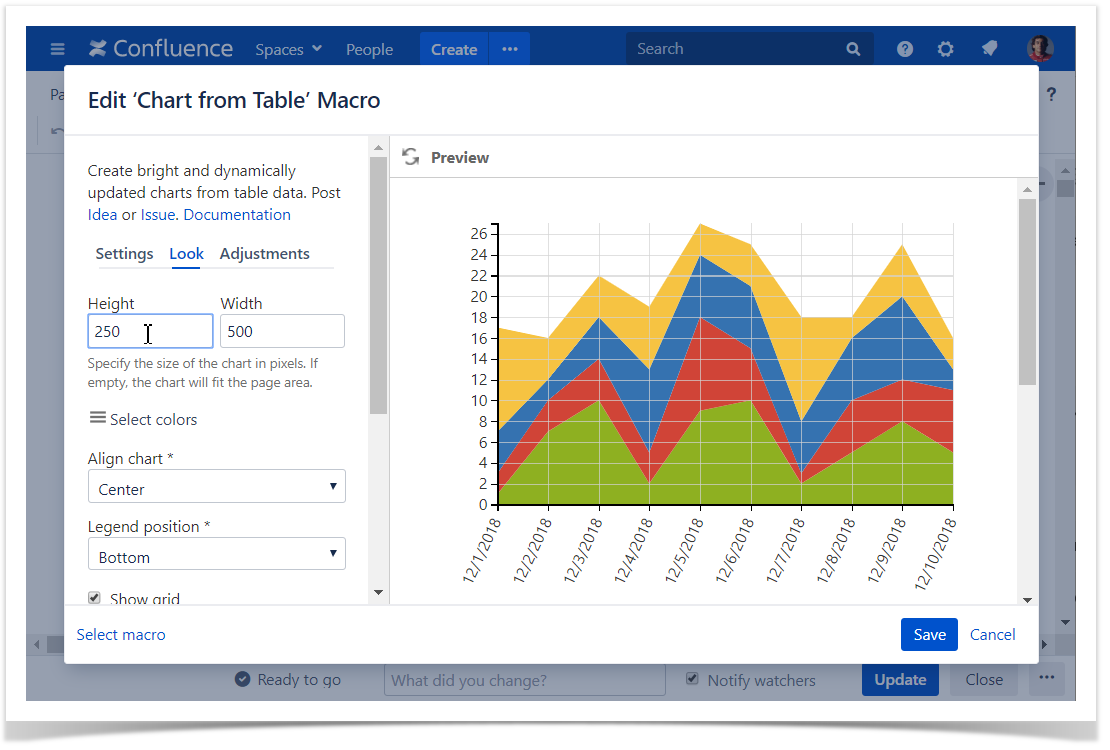
Set the height and width of the chart
- Switch the page to the edit mode.
- Select the macro and click Edit.
- Switch to the Look tab.
- Locate the Height and Width fields.
- Enter the appropriate dimensions of the chart.
Save the macro and the page.
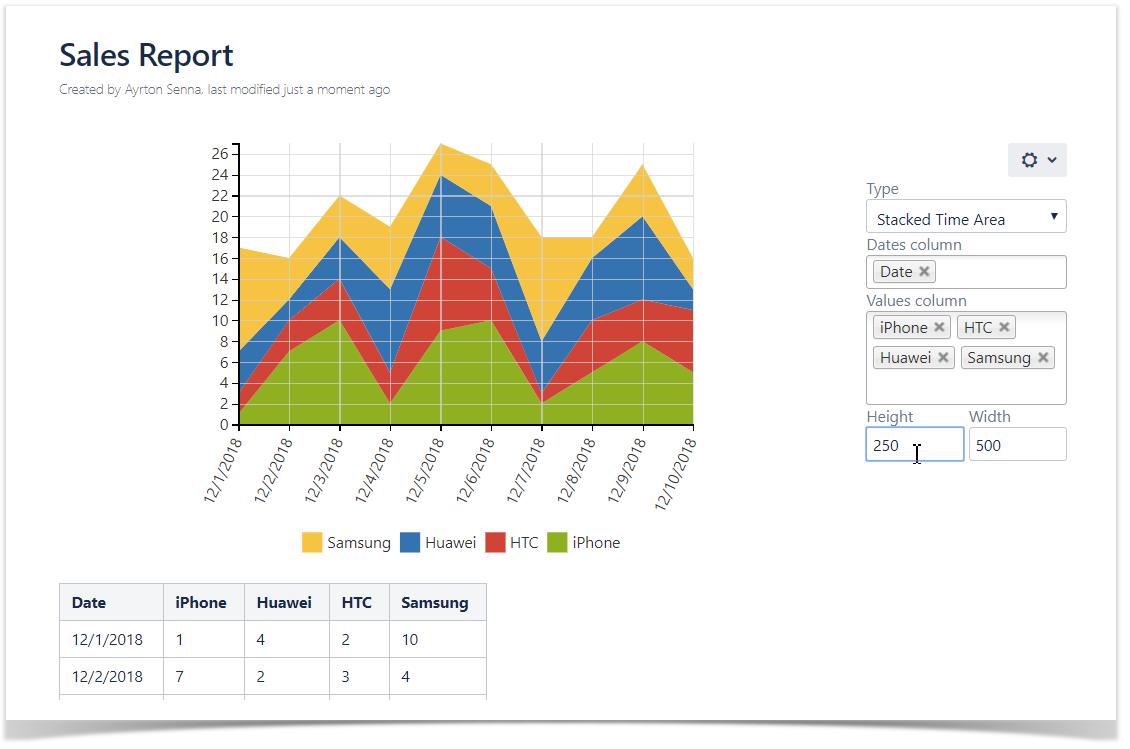
To set the Height and Width of the chart in the page view mode:
- Hover over the chart controls on the right of the table.
- Locate the Height and Width fields.
- Enter the appropriate dimensions of the chart.
- To save the modifications in the macro body, click the cogwheel icon and select Save changes .
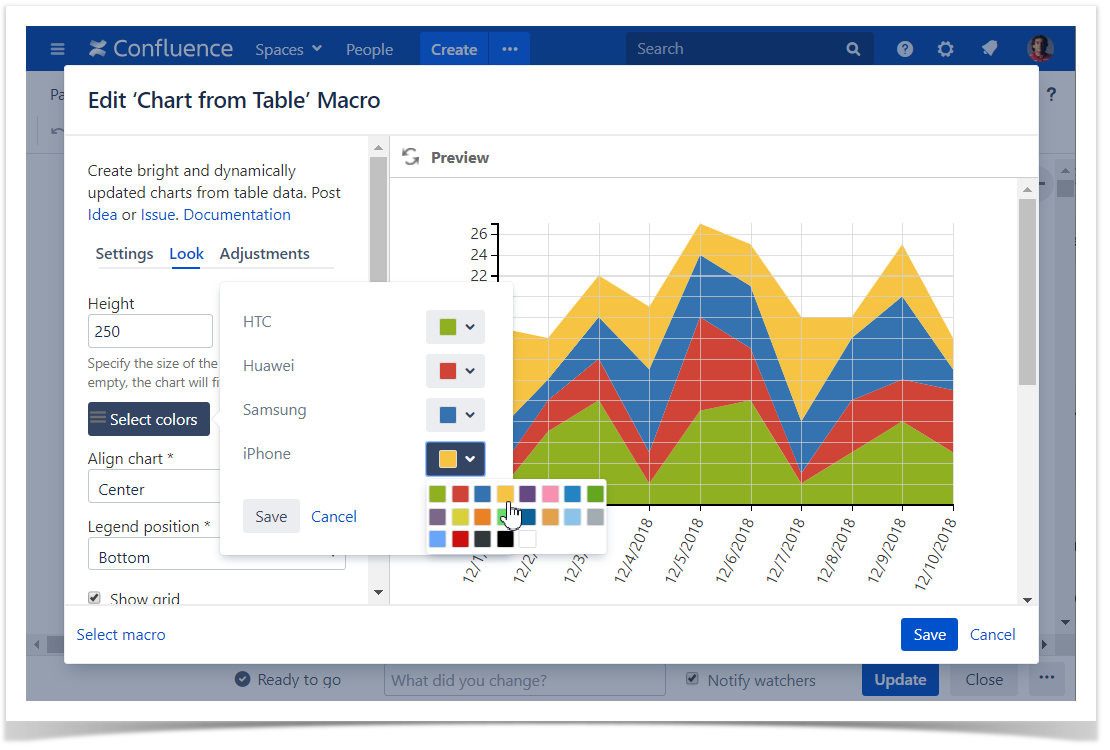
Set colors
- Switch the page to the edit mode.
- Select the macro and click Edit.
- Switch to the Look tab.
- Locate the Select colors button and click it.
- Select the appropriate colors for each label.
- Save the macro and the page.
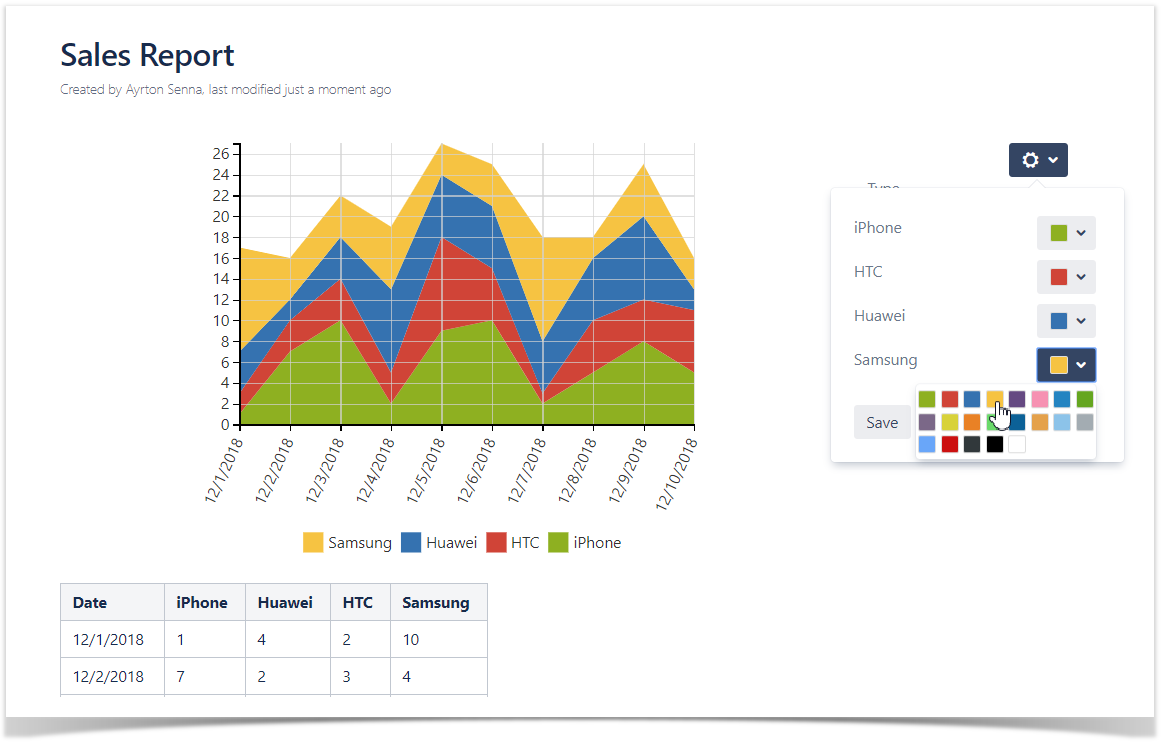
To set the colors in the page view mode:
- Hover over the chart controls on the right of the table.
- Click the cogwheel icon, locate the Select colors option. After selecting colors click Apply. The chart will be automatically re-generated.
- To save the modifications in the macro body, click the cogwheel icon and select Save changes .
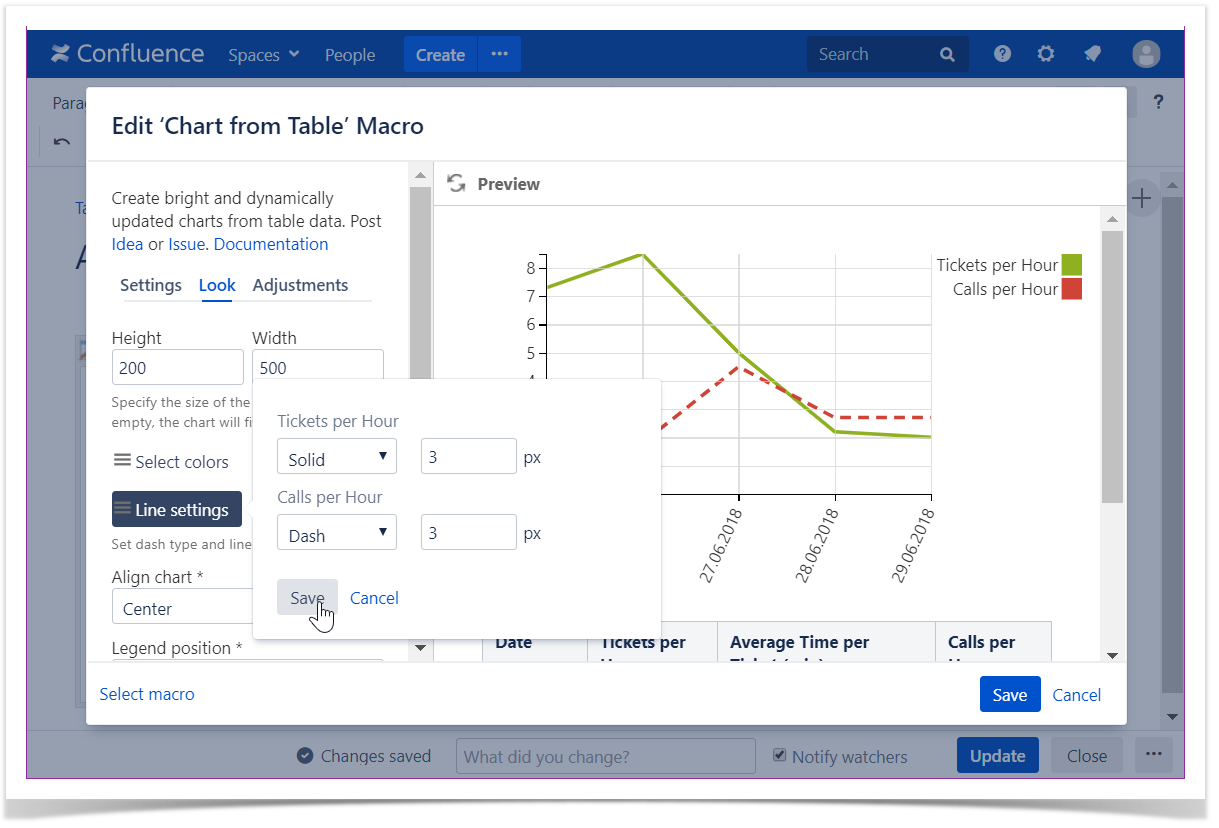
Set the line type settings
- Switch the page to the edit mode.
- Select the macro and click Edit.
- Switch to the Look tab.
- Configure the line type (solid, dash, dot) and widths (in pixels) settings for each line in your chart.
- Save the macro and the page.
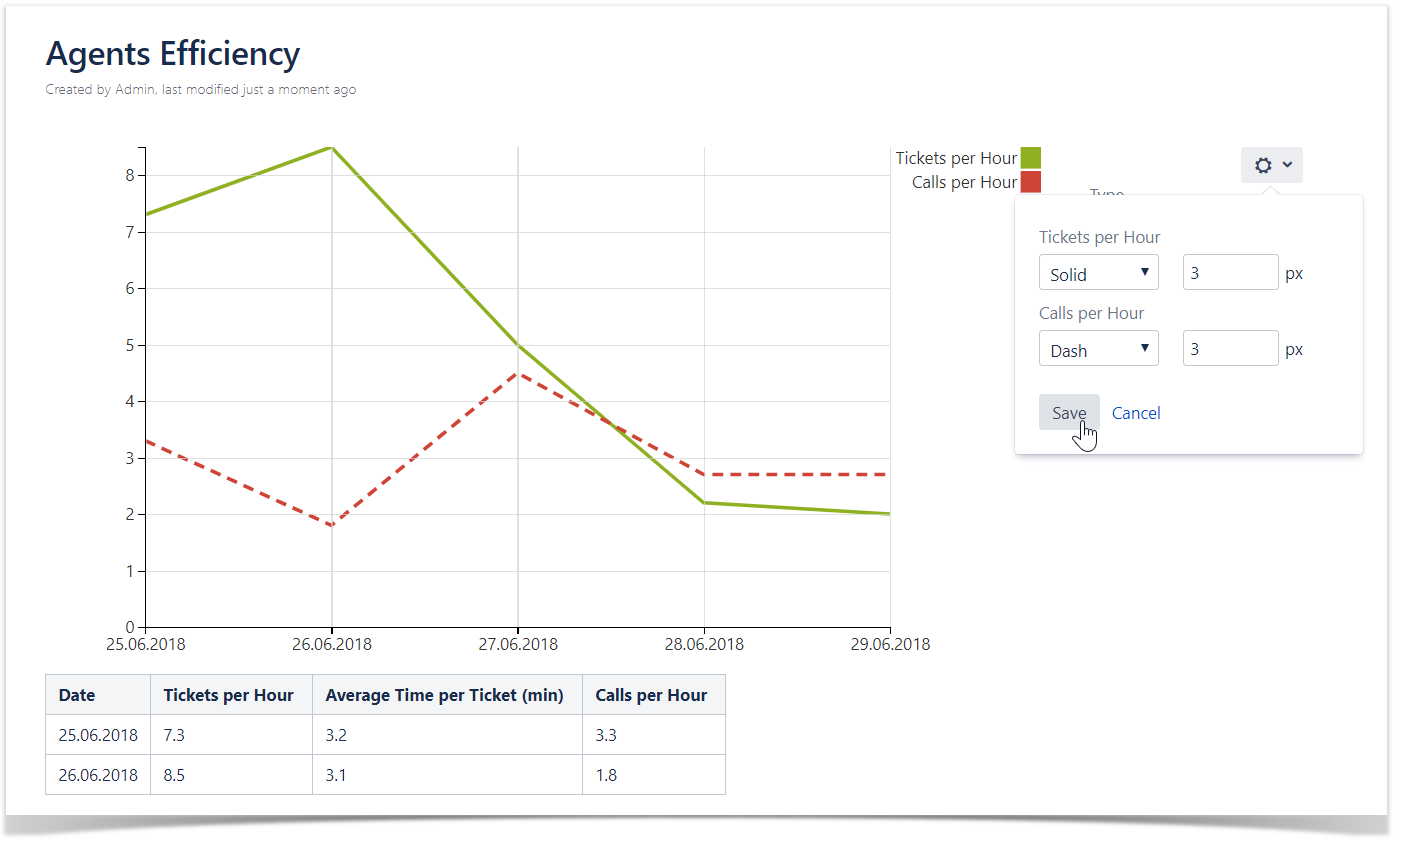
To set the line settings in the page view mode:
- Hover over the chart controls on the right of the table.
- Click the cogwheel icon, select the Modify line settings option. After modifying settings click Save. The chart will be automatically re-generated.
- To save the modifications in the macro body, click the cogwheel icon and select Save changes .
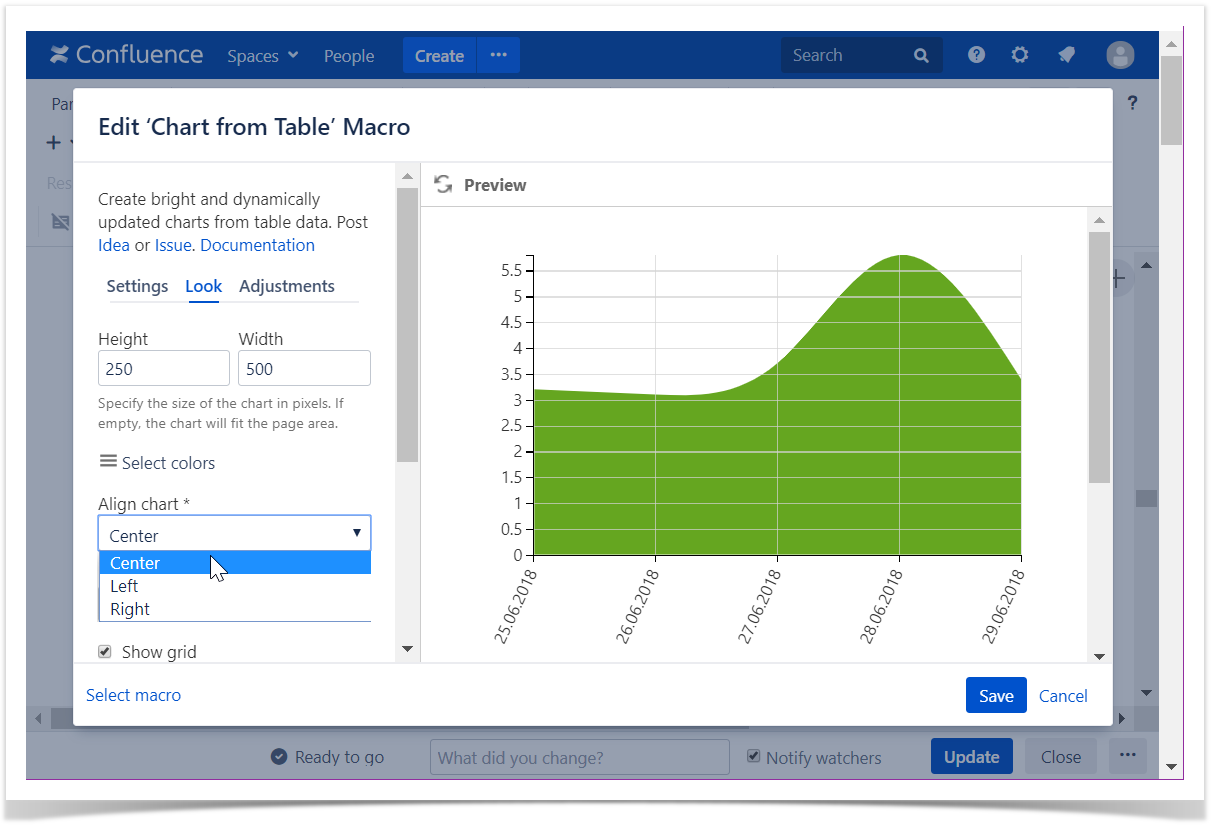
Align chart
- Switch the page to the edit mode.
- Select the macro and click Edit.
- Switch to the Look tab.
- Locate the Align chart option.
- Select the appropriate chart alignment, as follows:
- Left
- Center
- Right
- Save the macro and the page.
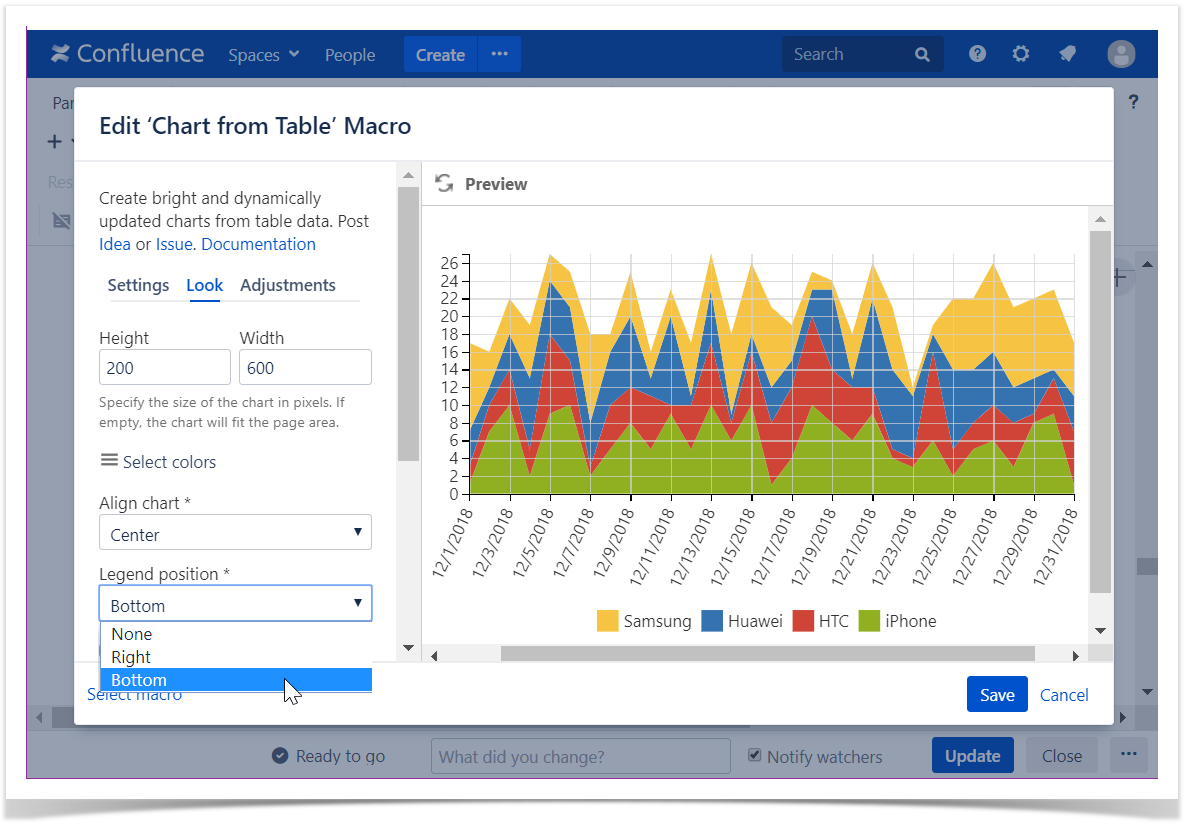
Set the legend position
- Switch the page to the edit mode.
- Select the macro and click Edit.
- Switch to the Look tab.
- Locate the Legend Position option.
- Select the appropriate legend position, as follows:
- None
- Right
- Bottom
- Save the macro and the page.
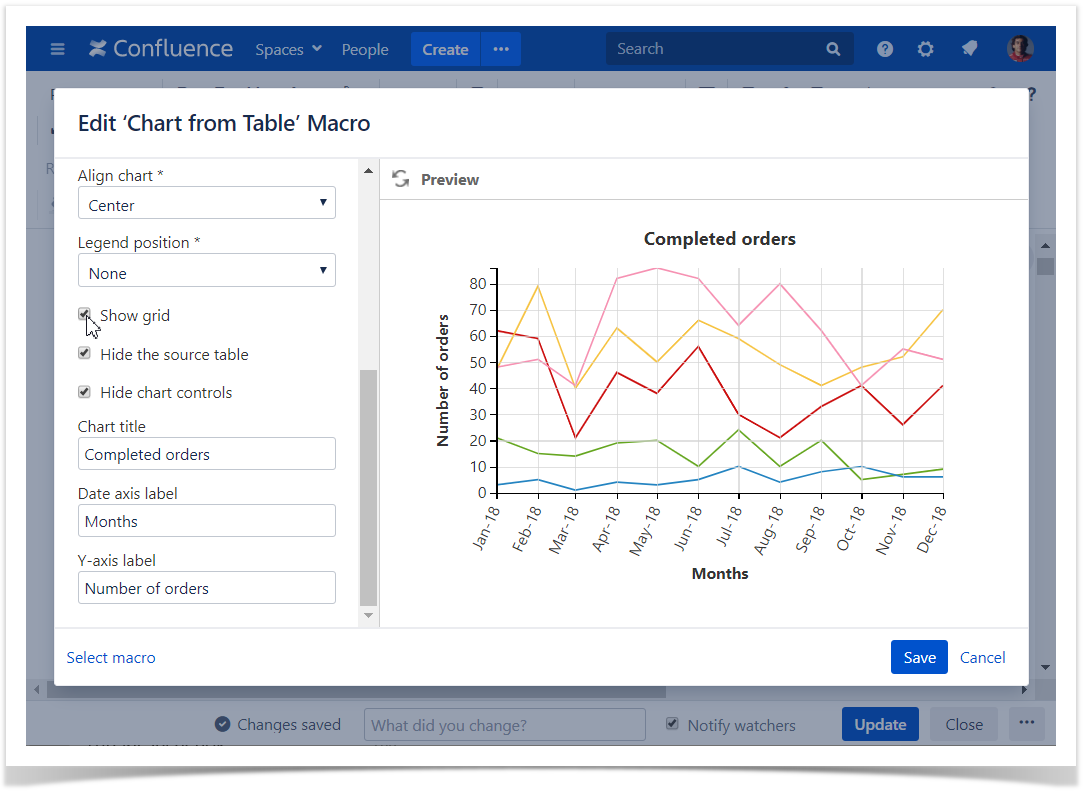
Show grid
- Switch the page to the edit mode.
- Select the macro and click Edit.
- Switch to the Look tab.
- Locate and enable the Show grid option.
- Save the macro and the page.
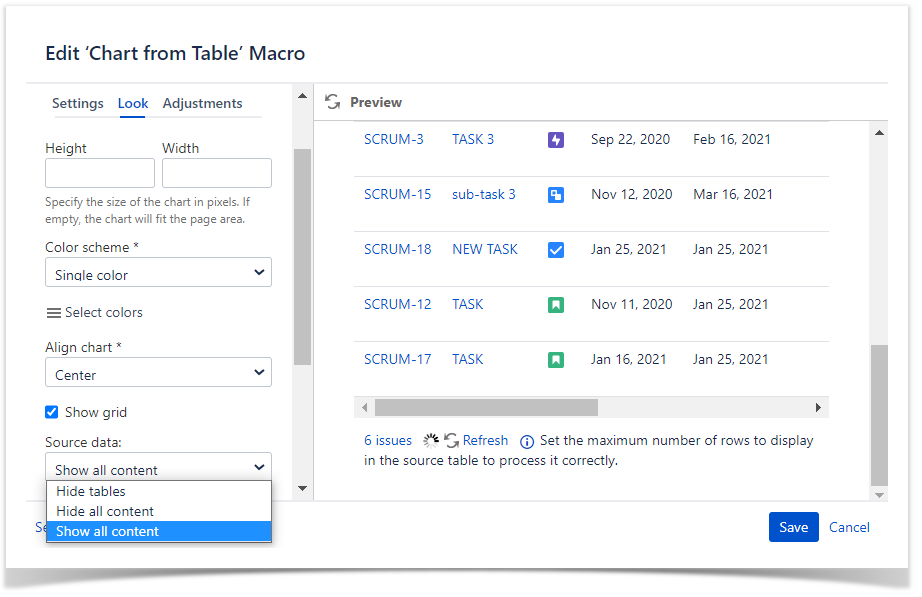
Show/Hide source data
- Switch the page to the edit mode.
- Select the macro and click Edit.
- Locate the Source data option and select the appropriate option, as follows:
- Show all content
- Hide tables
- Hide all content
- Save the macro and the page.
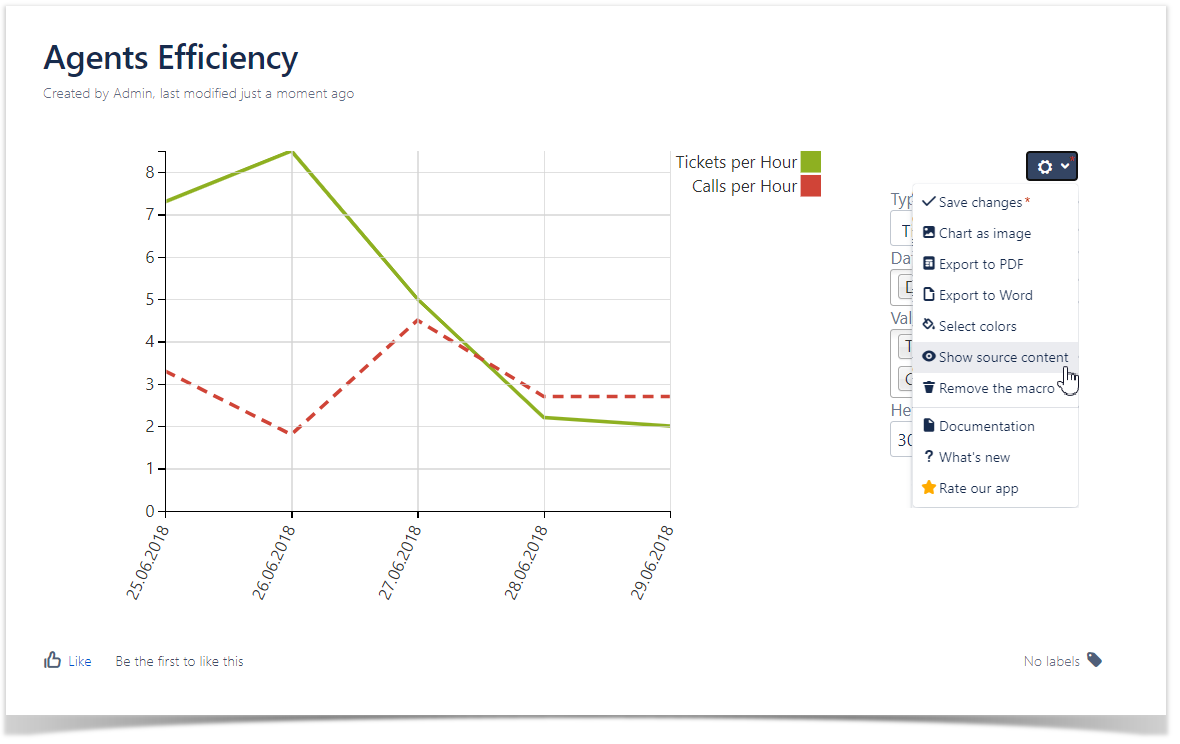
To show/hide source data in the page view mode:
- Hover over the chart controls on the right of the table.
- Click the cogwheel icon, select the Show source content, Hide source content (Hide tables, Hide all content) option.
- To save the modifications in the macro body, click the cogwheel icon and select Save changes .
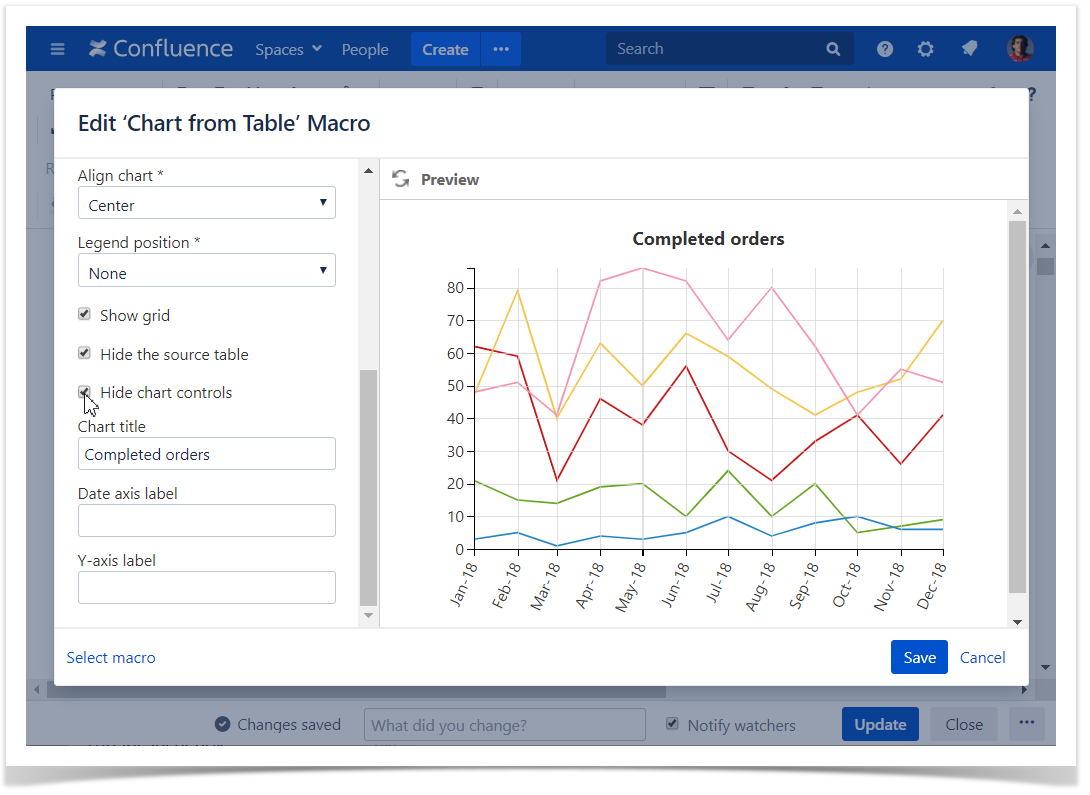
Hide chart controls
- Switch the page to the edit mode.
- Select the macro and click Edit.
- Switch to the Look tab.
- Locate and enable the Hide chart controls option.
- Save the macro and the page.
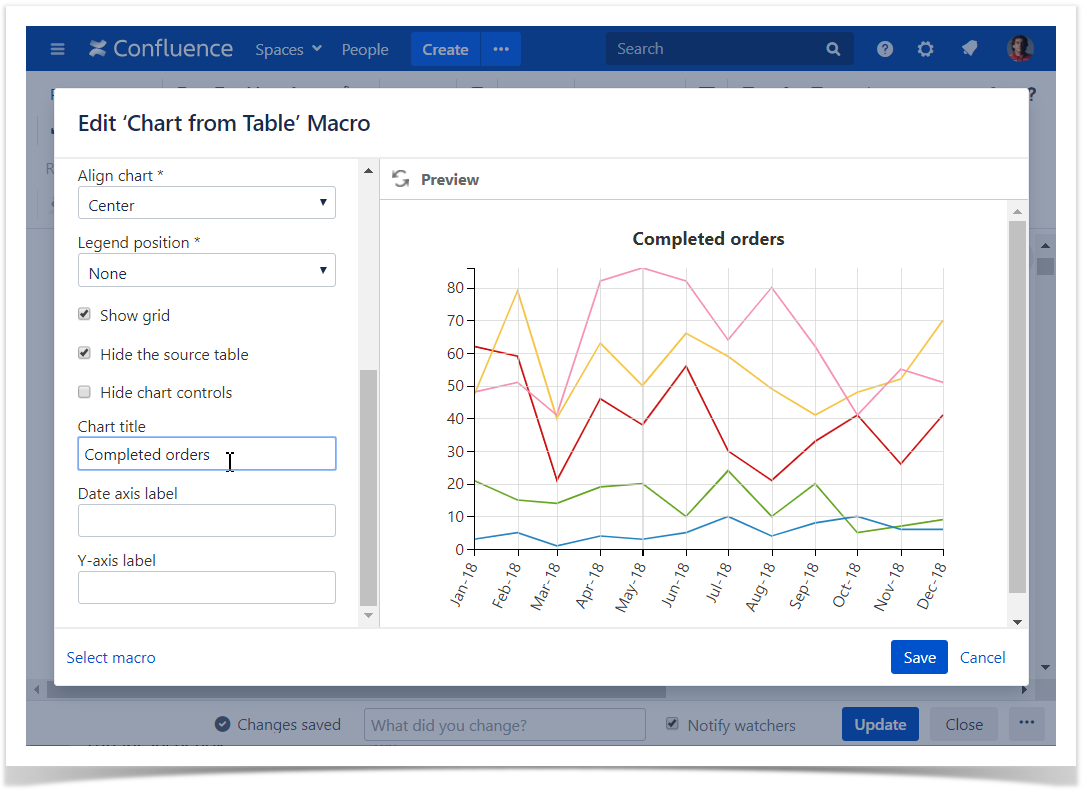
Set the chart title
- Switch the page to the edit mode.
- Select the macro and click Edit.
- Switch to the Look tab.
- Locate the Chart title option and enter the title.
- Save the macro and the page.
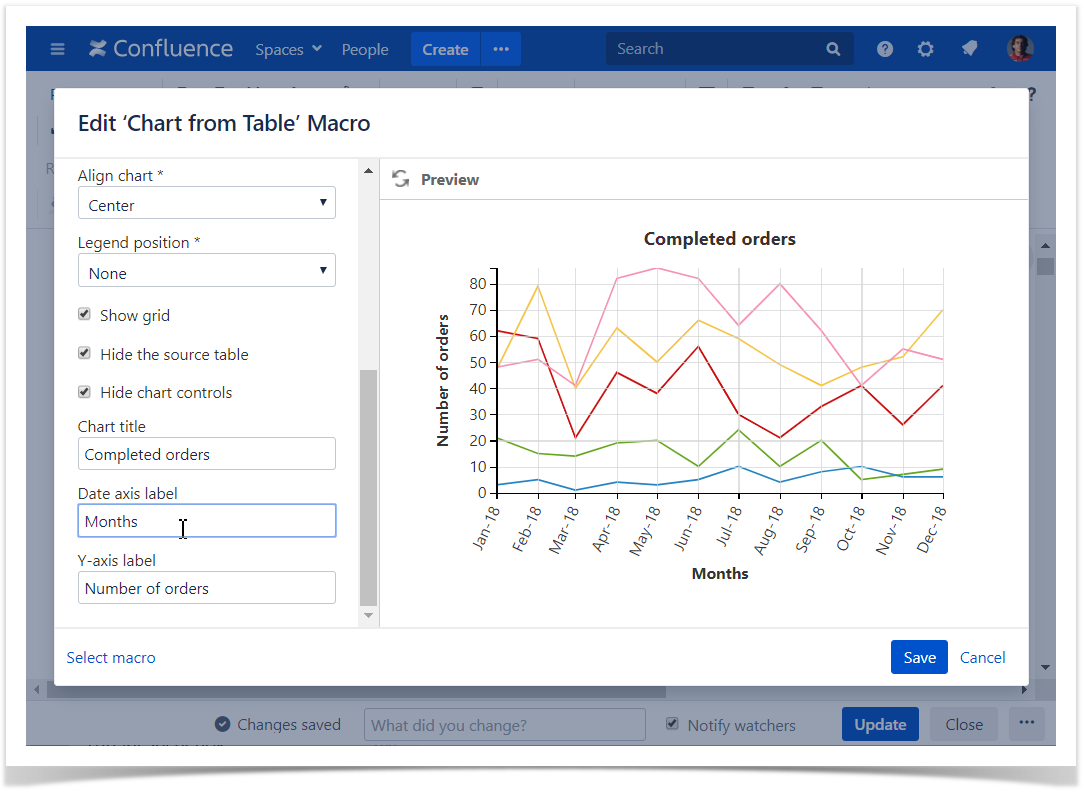
Set axis labels
- Switch the page to the edit mode.
- Select the macro and click Edit.
- Switch to the Look tab.
- Locate the Row axis label and Value axis label options and enter the labels.
- Save the macro and the page.
Zoom in chart
- Open the page with the chart you want to zoom in.
- Hover your mouse pointer over this chart.
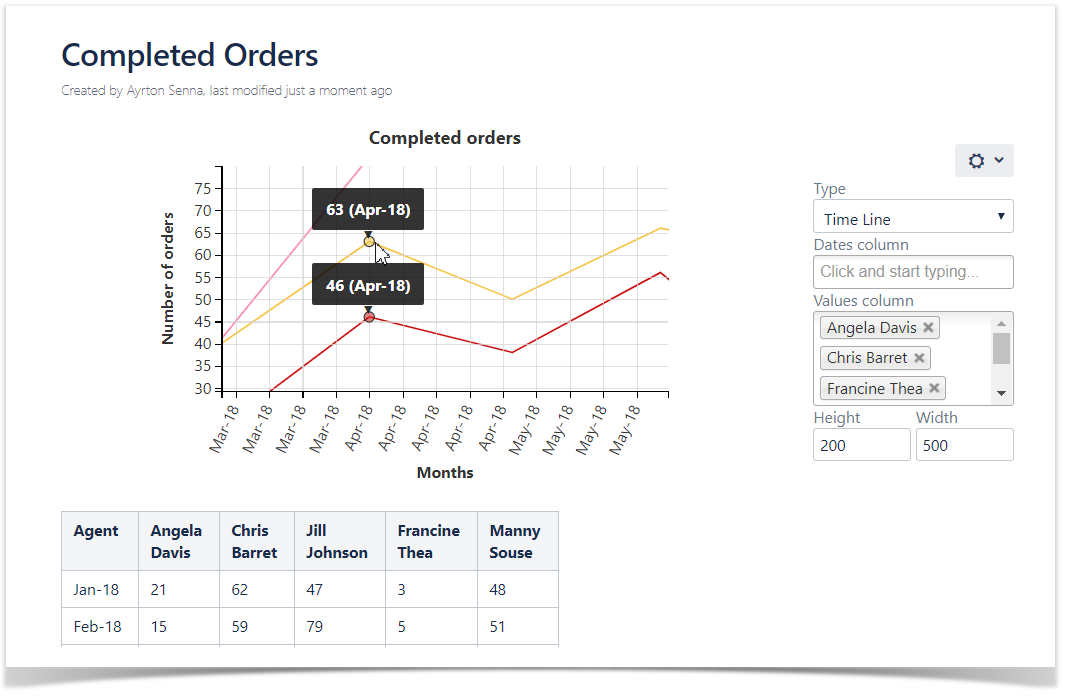
- Hold down Ctrl and rotate the wheel button forward to zoom in the chart.
You can also do the following:
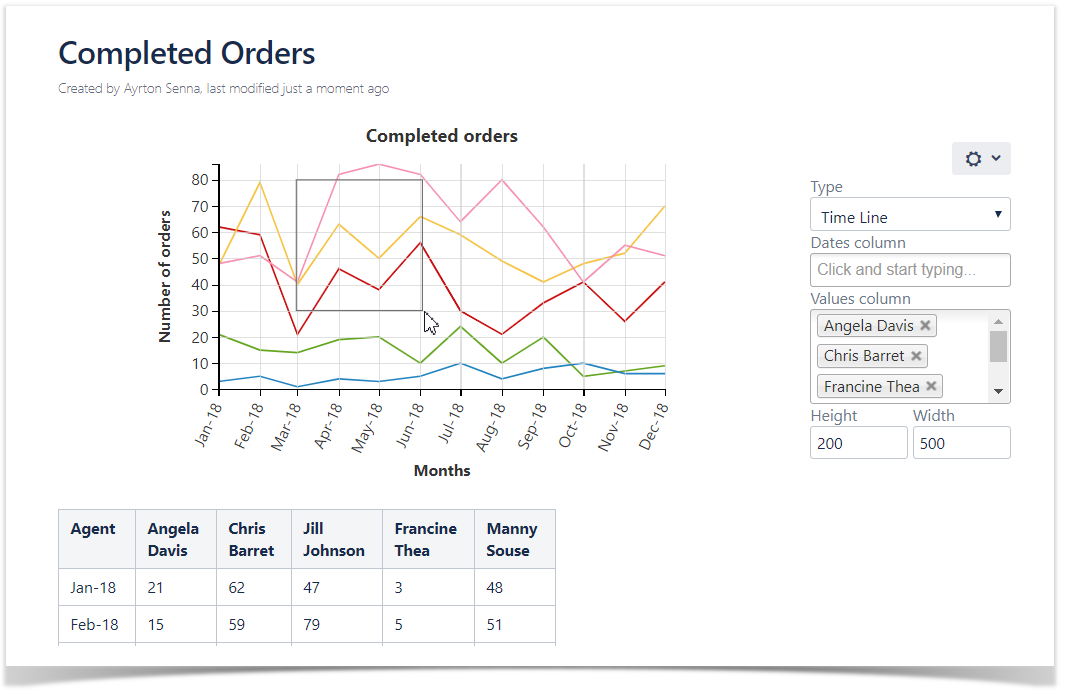
To zoom in over the desired chart area:
- Click and hold the left mouse button.
- Drag the mouse pointer down and right over the chart.
To zoom out the chart:
- Click and hold down the left mouse button.
- Drag the mouse pointer left over the chart.
To scale up values along chart axes:
- Hold down Shift and drag the mouse pointer left or right. (for X axis)
- Hold down Shift and drag the mouse pointer upwards or downwards. (for Y axis)
To navigate across the chart:
- Hold down Ctrl (for Windows) or Alt (for MacOS) and drag the mouse pointer across the chart.
