New in this release
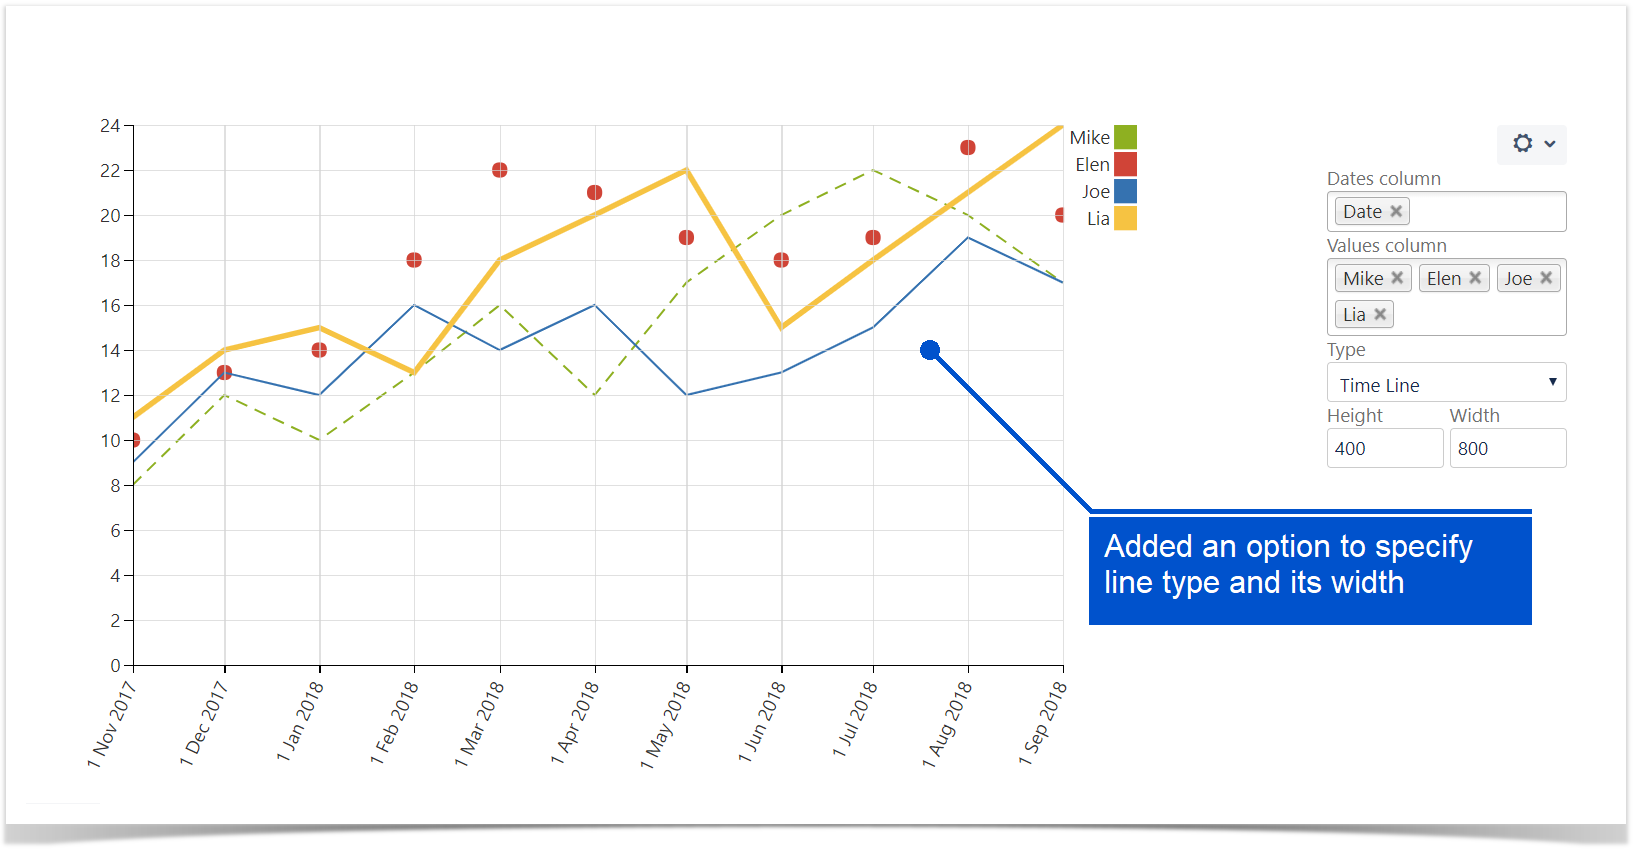
Added an option to specify types of lines (solid, dash, dot) and line width when using Line and Time Line types of charts.
Now you can set the line type and its width for each line in your chart separately.
The new version of add-on also includes the following features:
In the Chart from Table macro:
- Added an option to define an interpolation type individually for each line when using line charts.
- Added an ability to show descriptions of milestones and events when you hove over the milestone (event) in Gantt charts.
- Added an option to choose a way to show data labels (percents and/or values or none) when using pie/donut charts.
In the Table Excerpt Include macro
- Added an option to show a copy of a source table.