Output the
totalTotal column
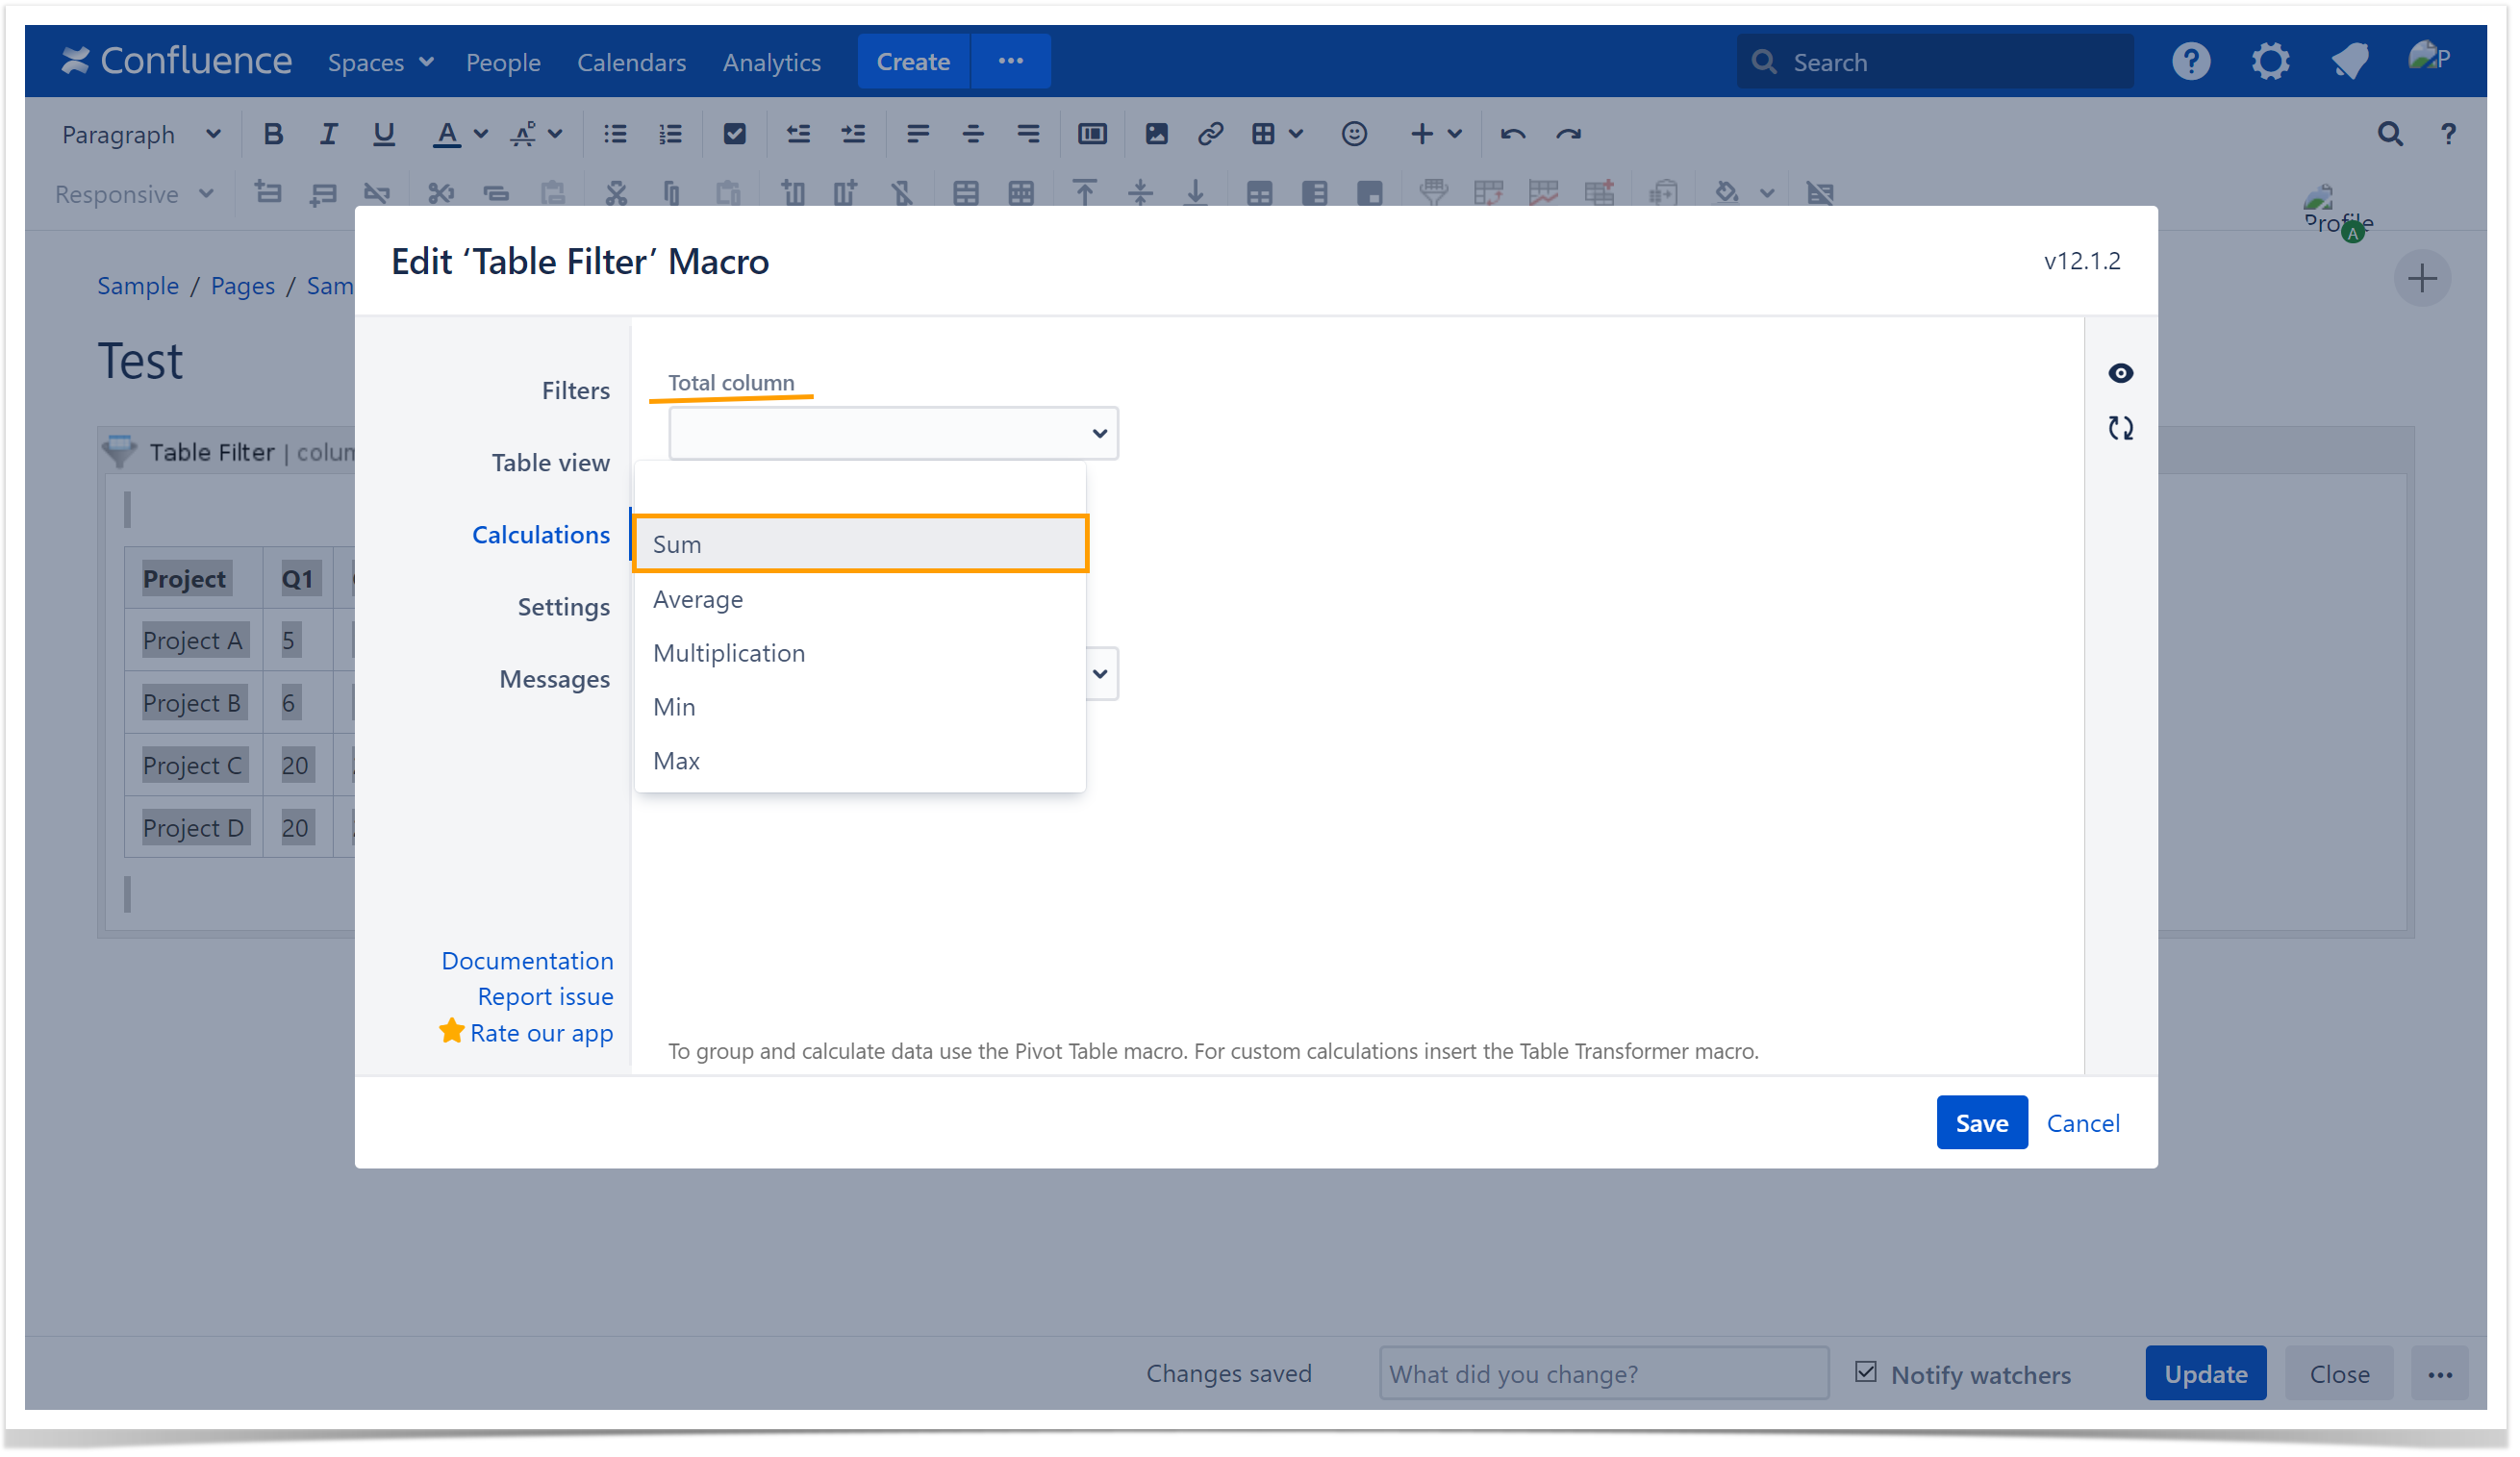
The app allows you to output the Total column for your table. The following operations are available:
- Sum
- Average
- Multiplication
- Min
- Max
- Sum
- Multiplication
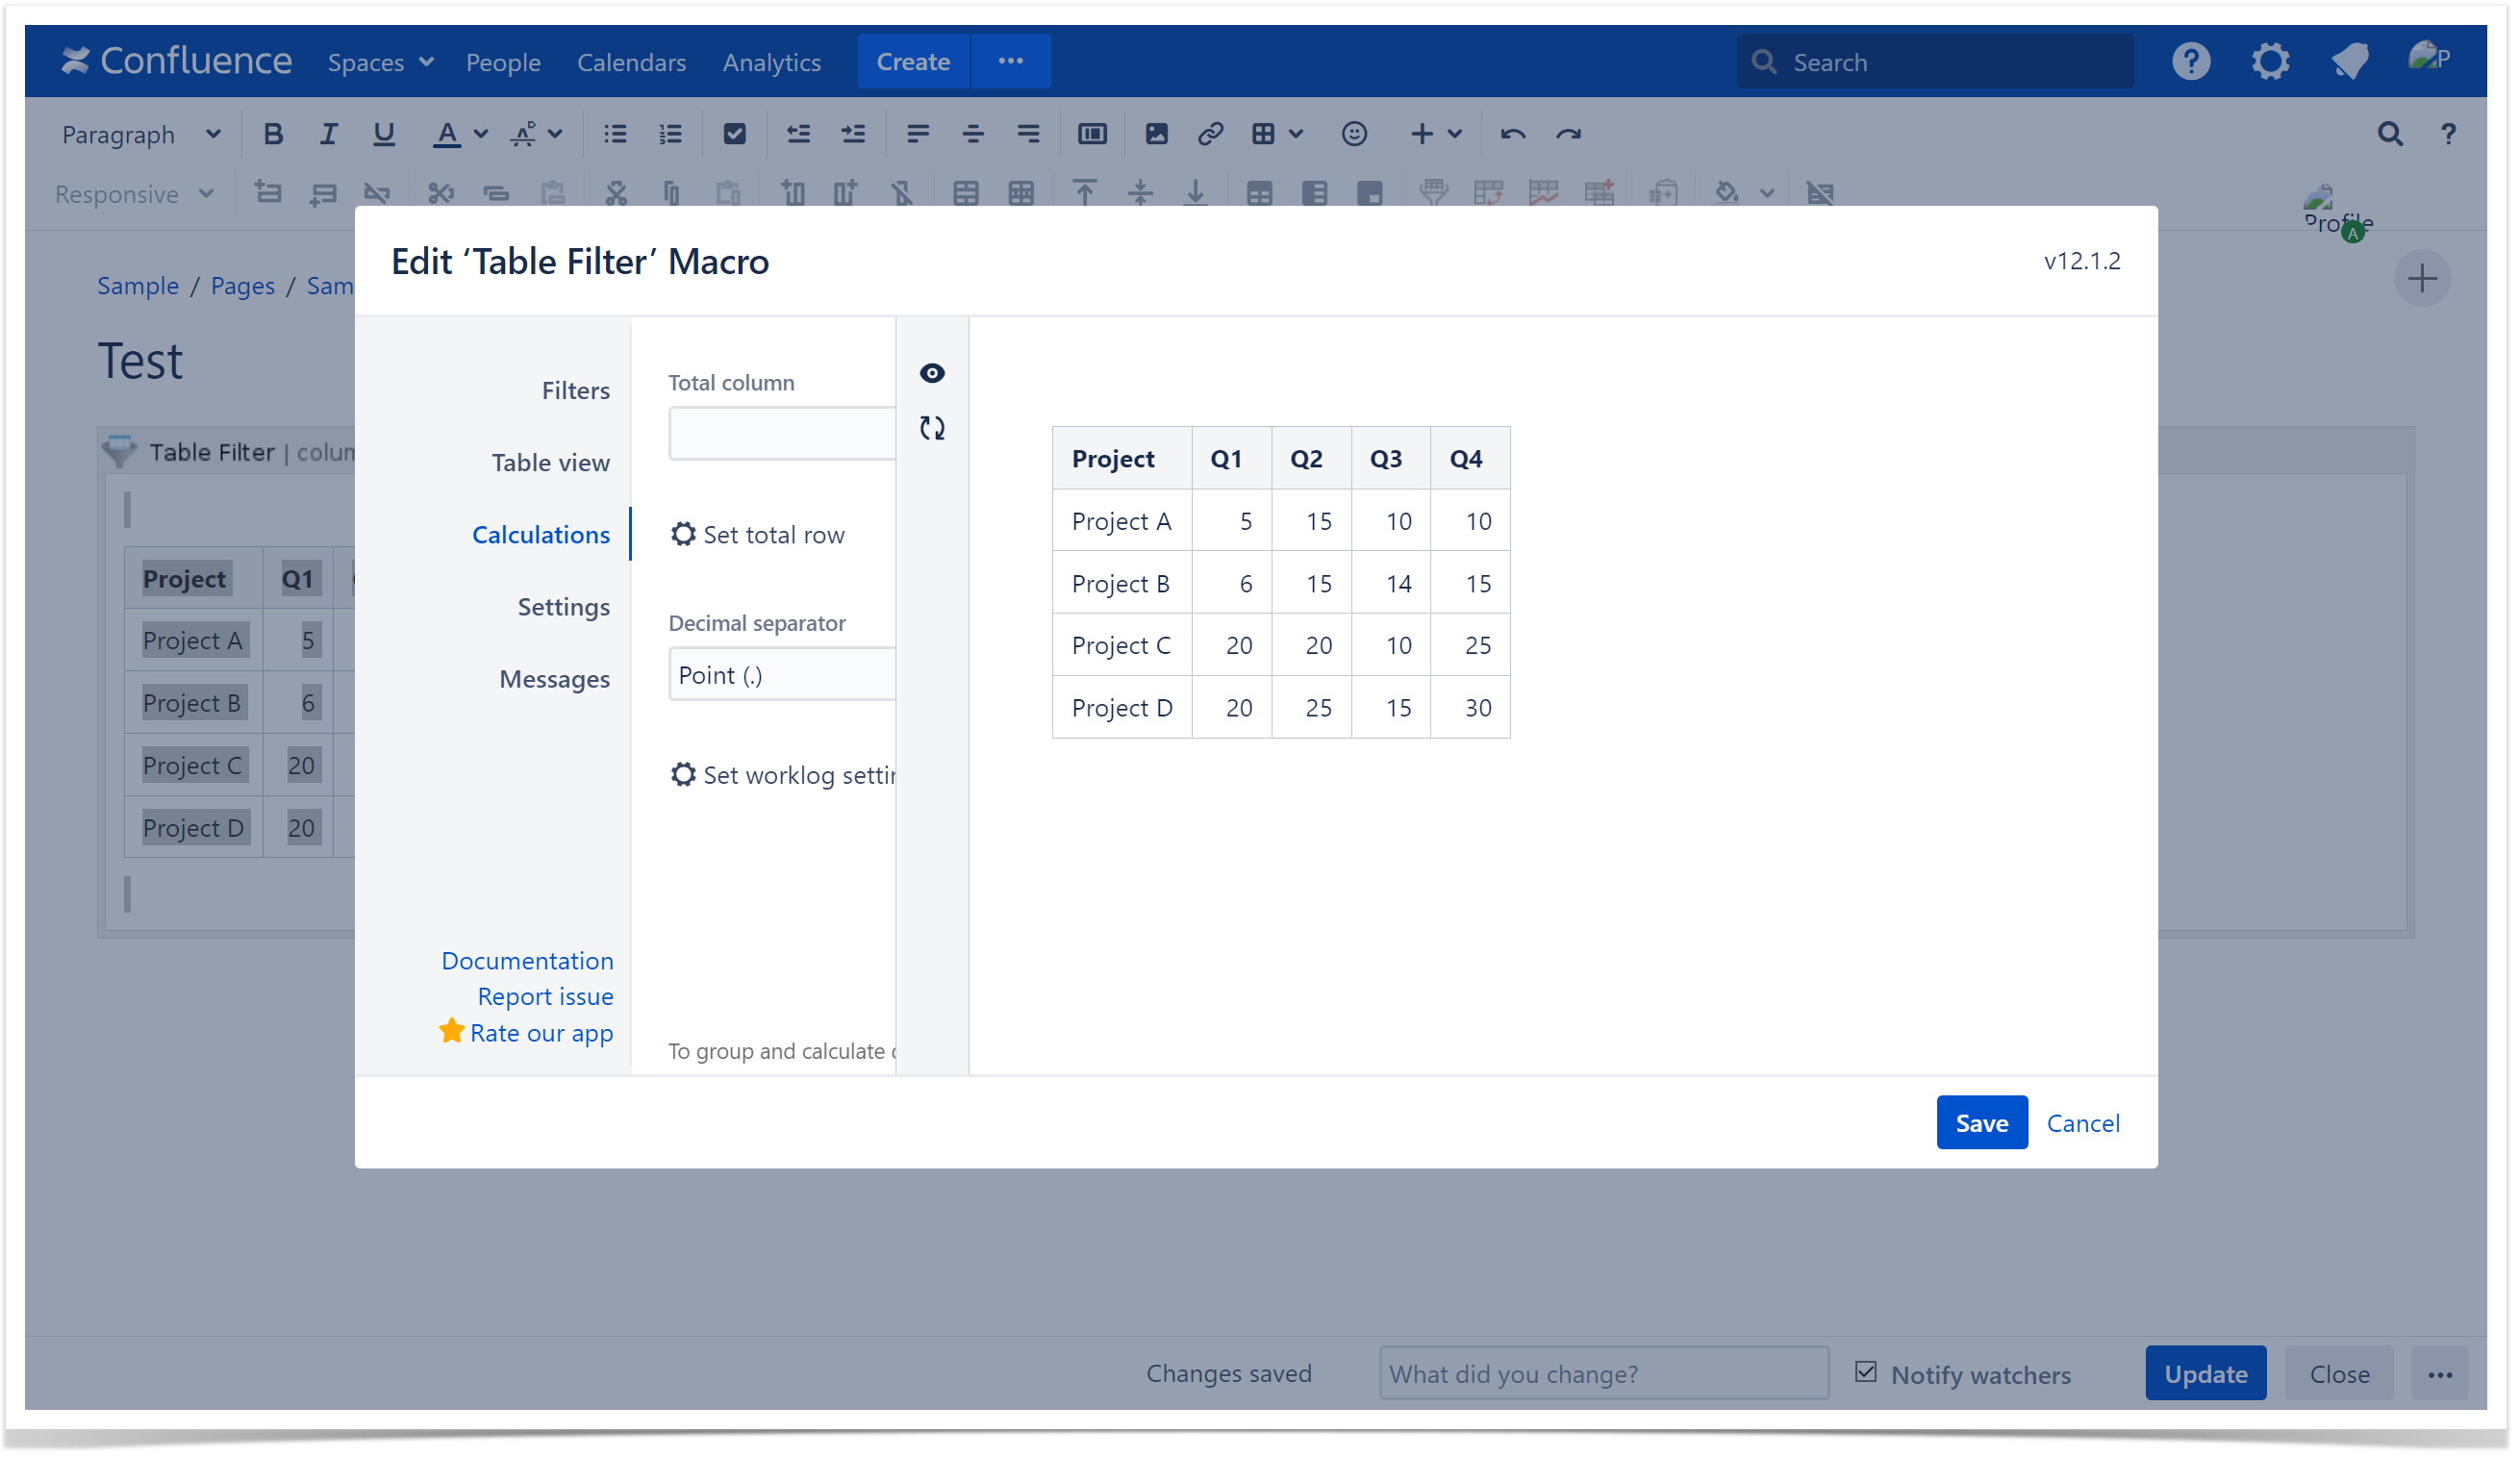
To enable the Total column for the table:
- Switch the page to the edit mode.
- Select the macro and click Edit.
- Switch to the Calculations tab.
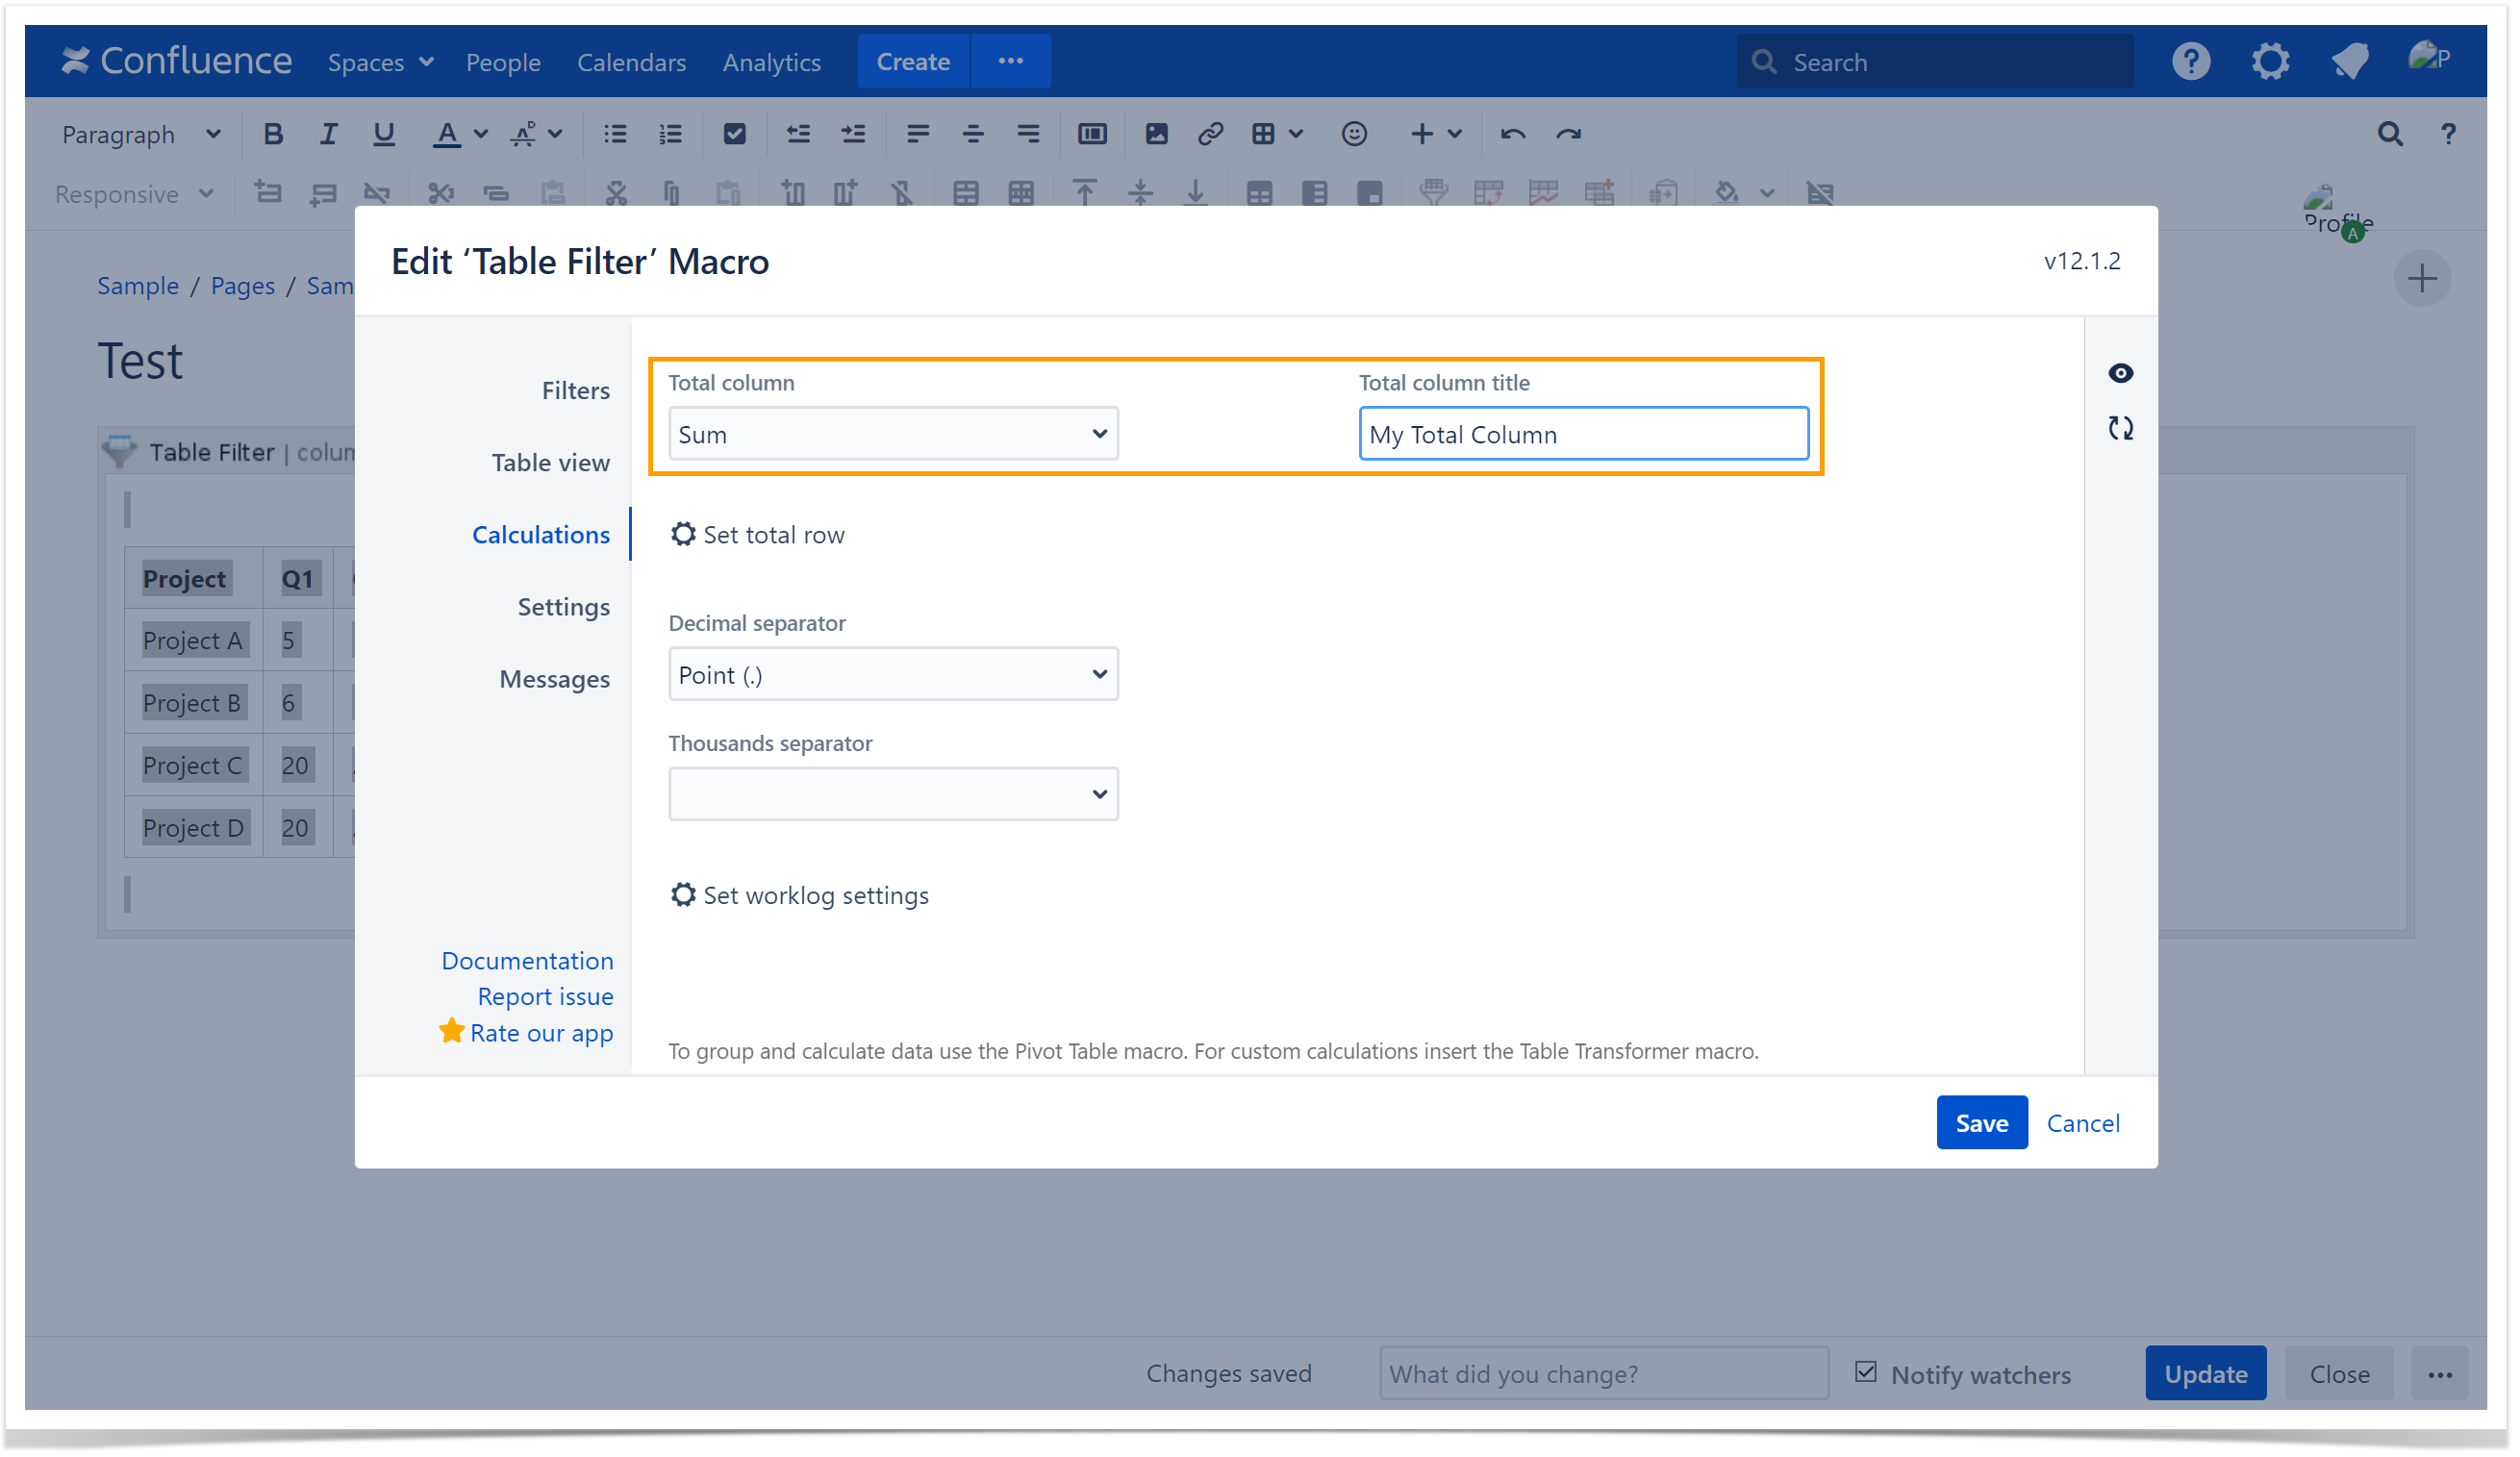
- Select the Operation type for the Total column.the Total column field and choose the required operation type.
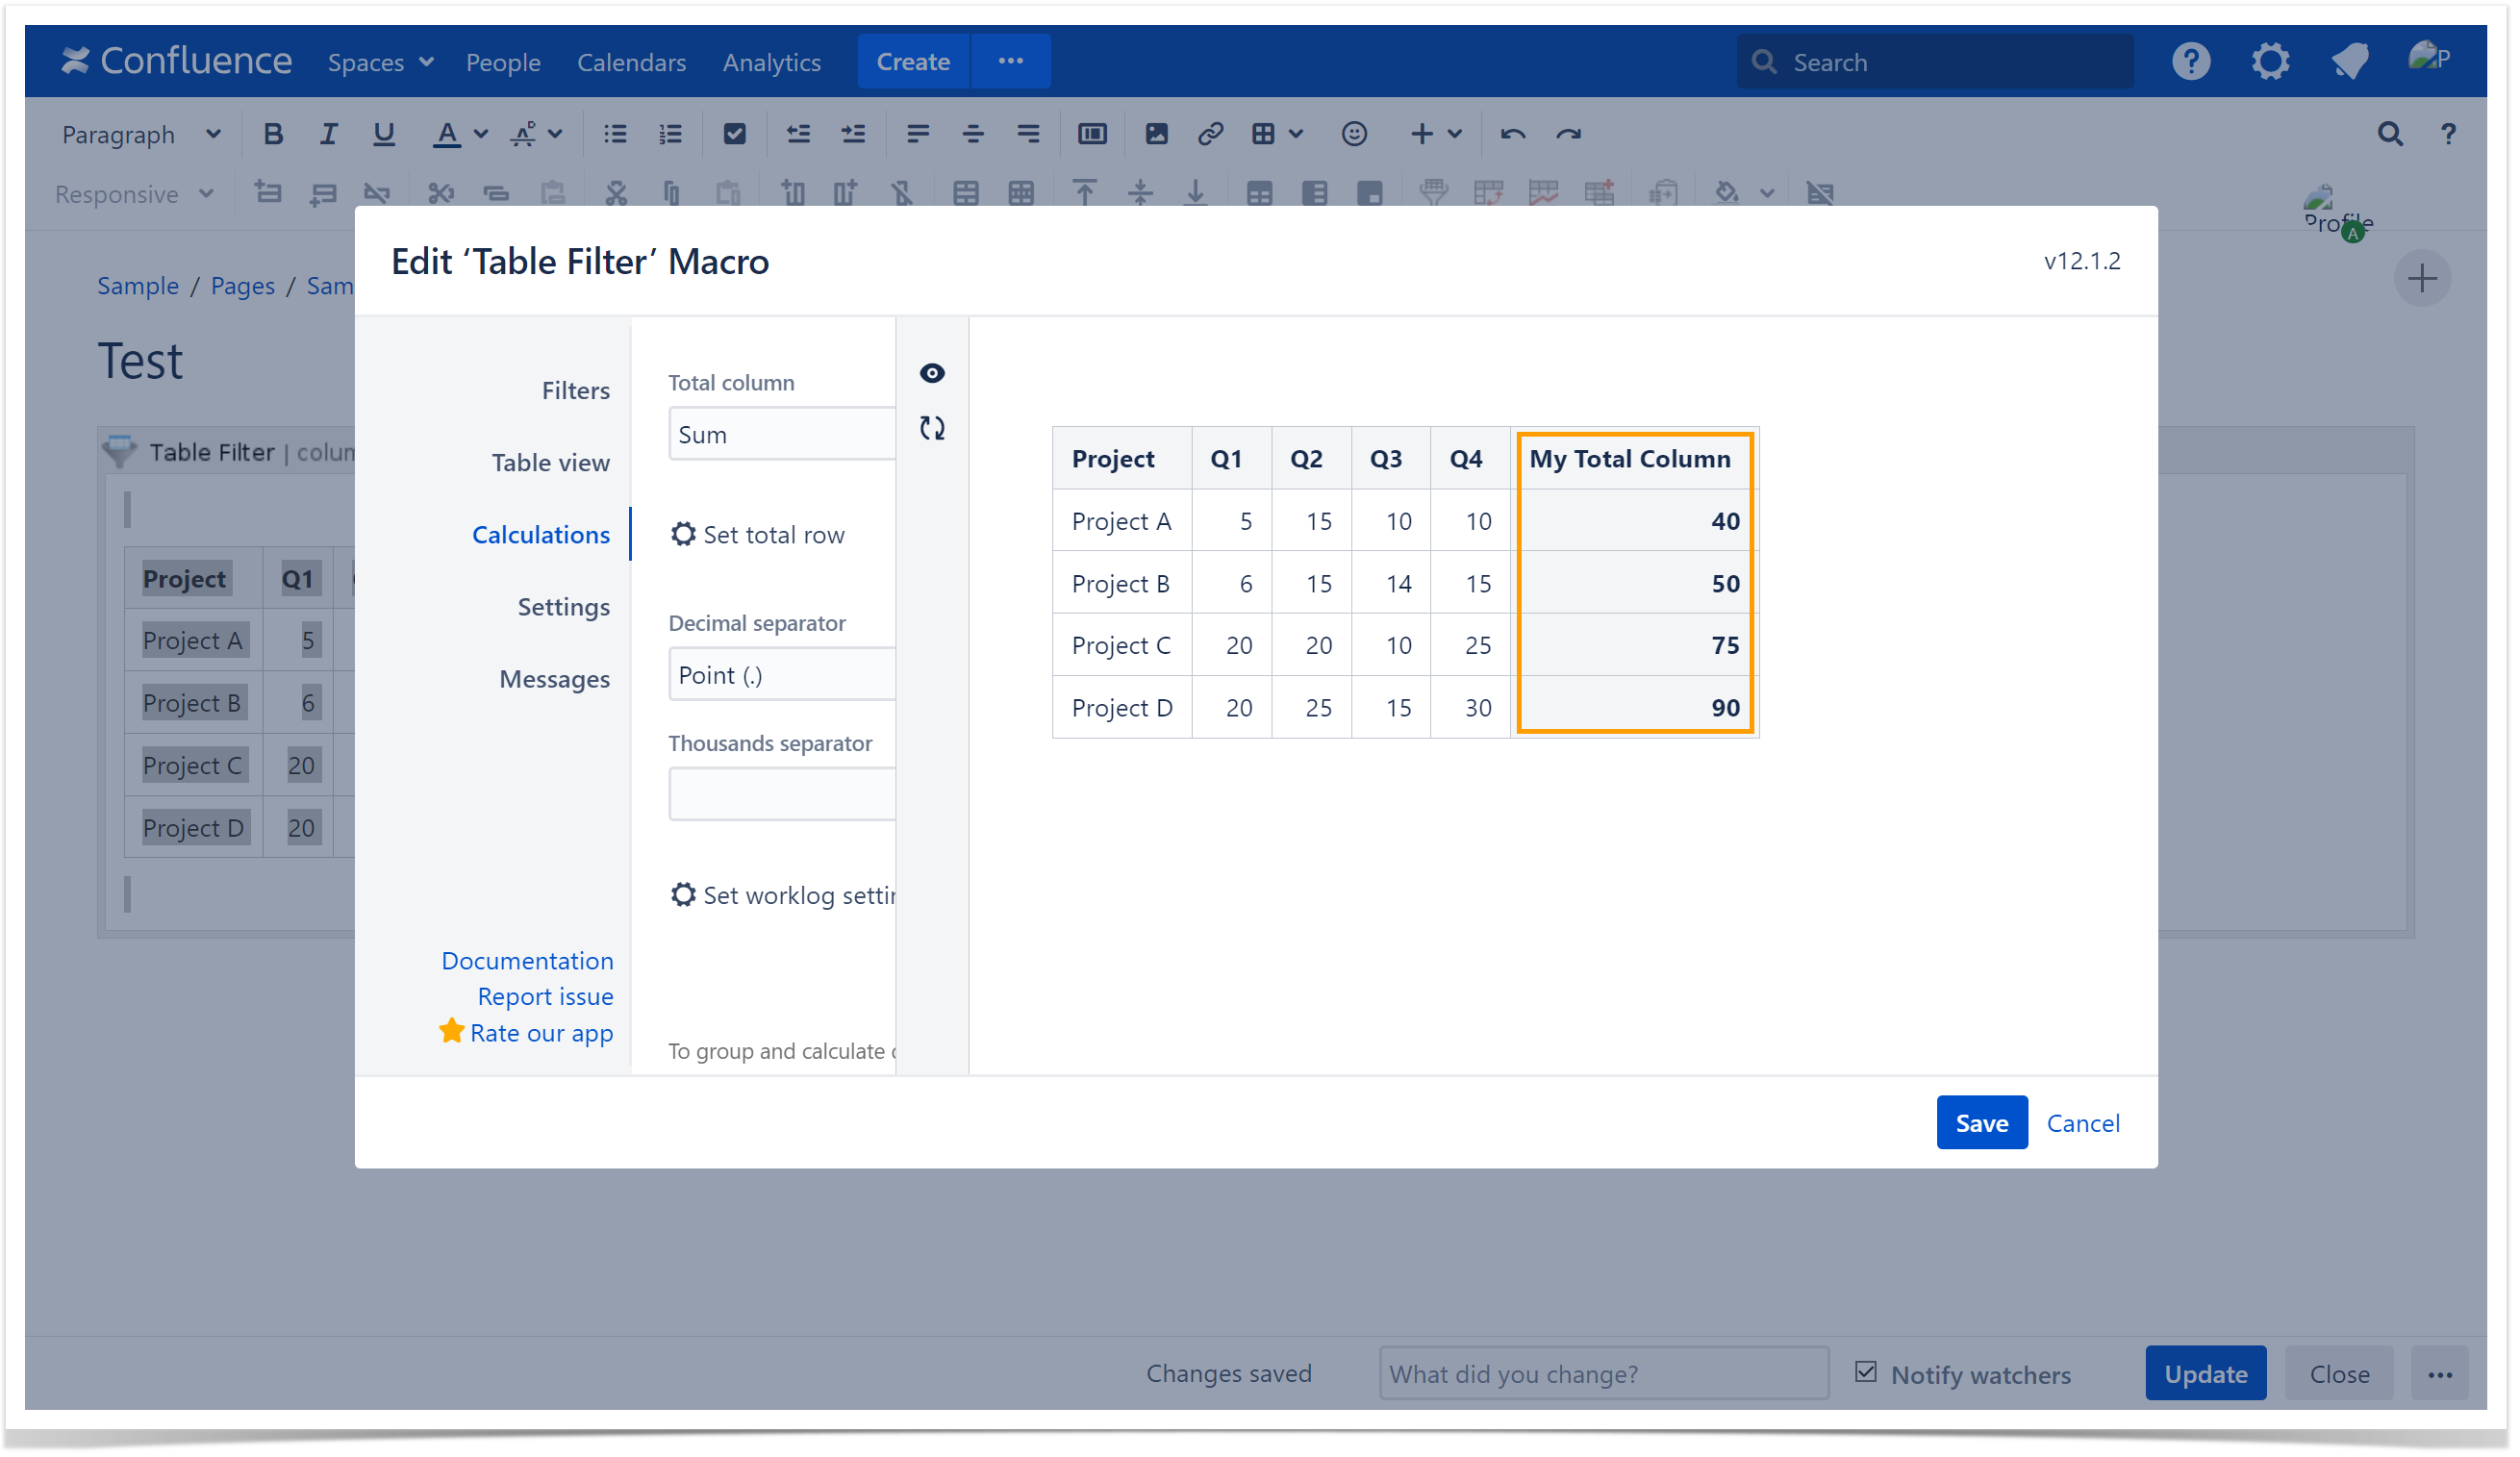
- Once the operation type is selected, the Total column title field becomes visible - you may assign your custom name for the total column.
The default name corresponds to the chosen operation type. - Save the macro and the page.
To rename the Total column:
Locate| Info |
|---|
Please note that on Data Center in the app versions older than 12.1.2 the Total column |
field was called Operation type for Total column. |
Other steps remain the same. |
| Handy Carousel |
|---|
|


Output
totals for columnsthe Total row
The app allows you to count totals for specific columns in output the Total row for your table. The following operations are available:
- Sum
- Average
- Multiplication
- Min
- Max
- Count
- Count not empty
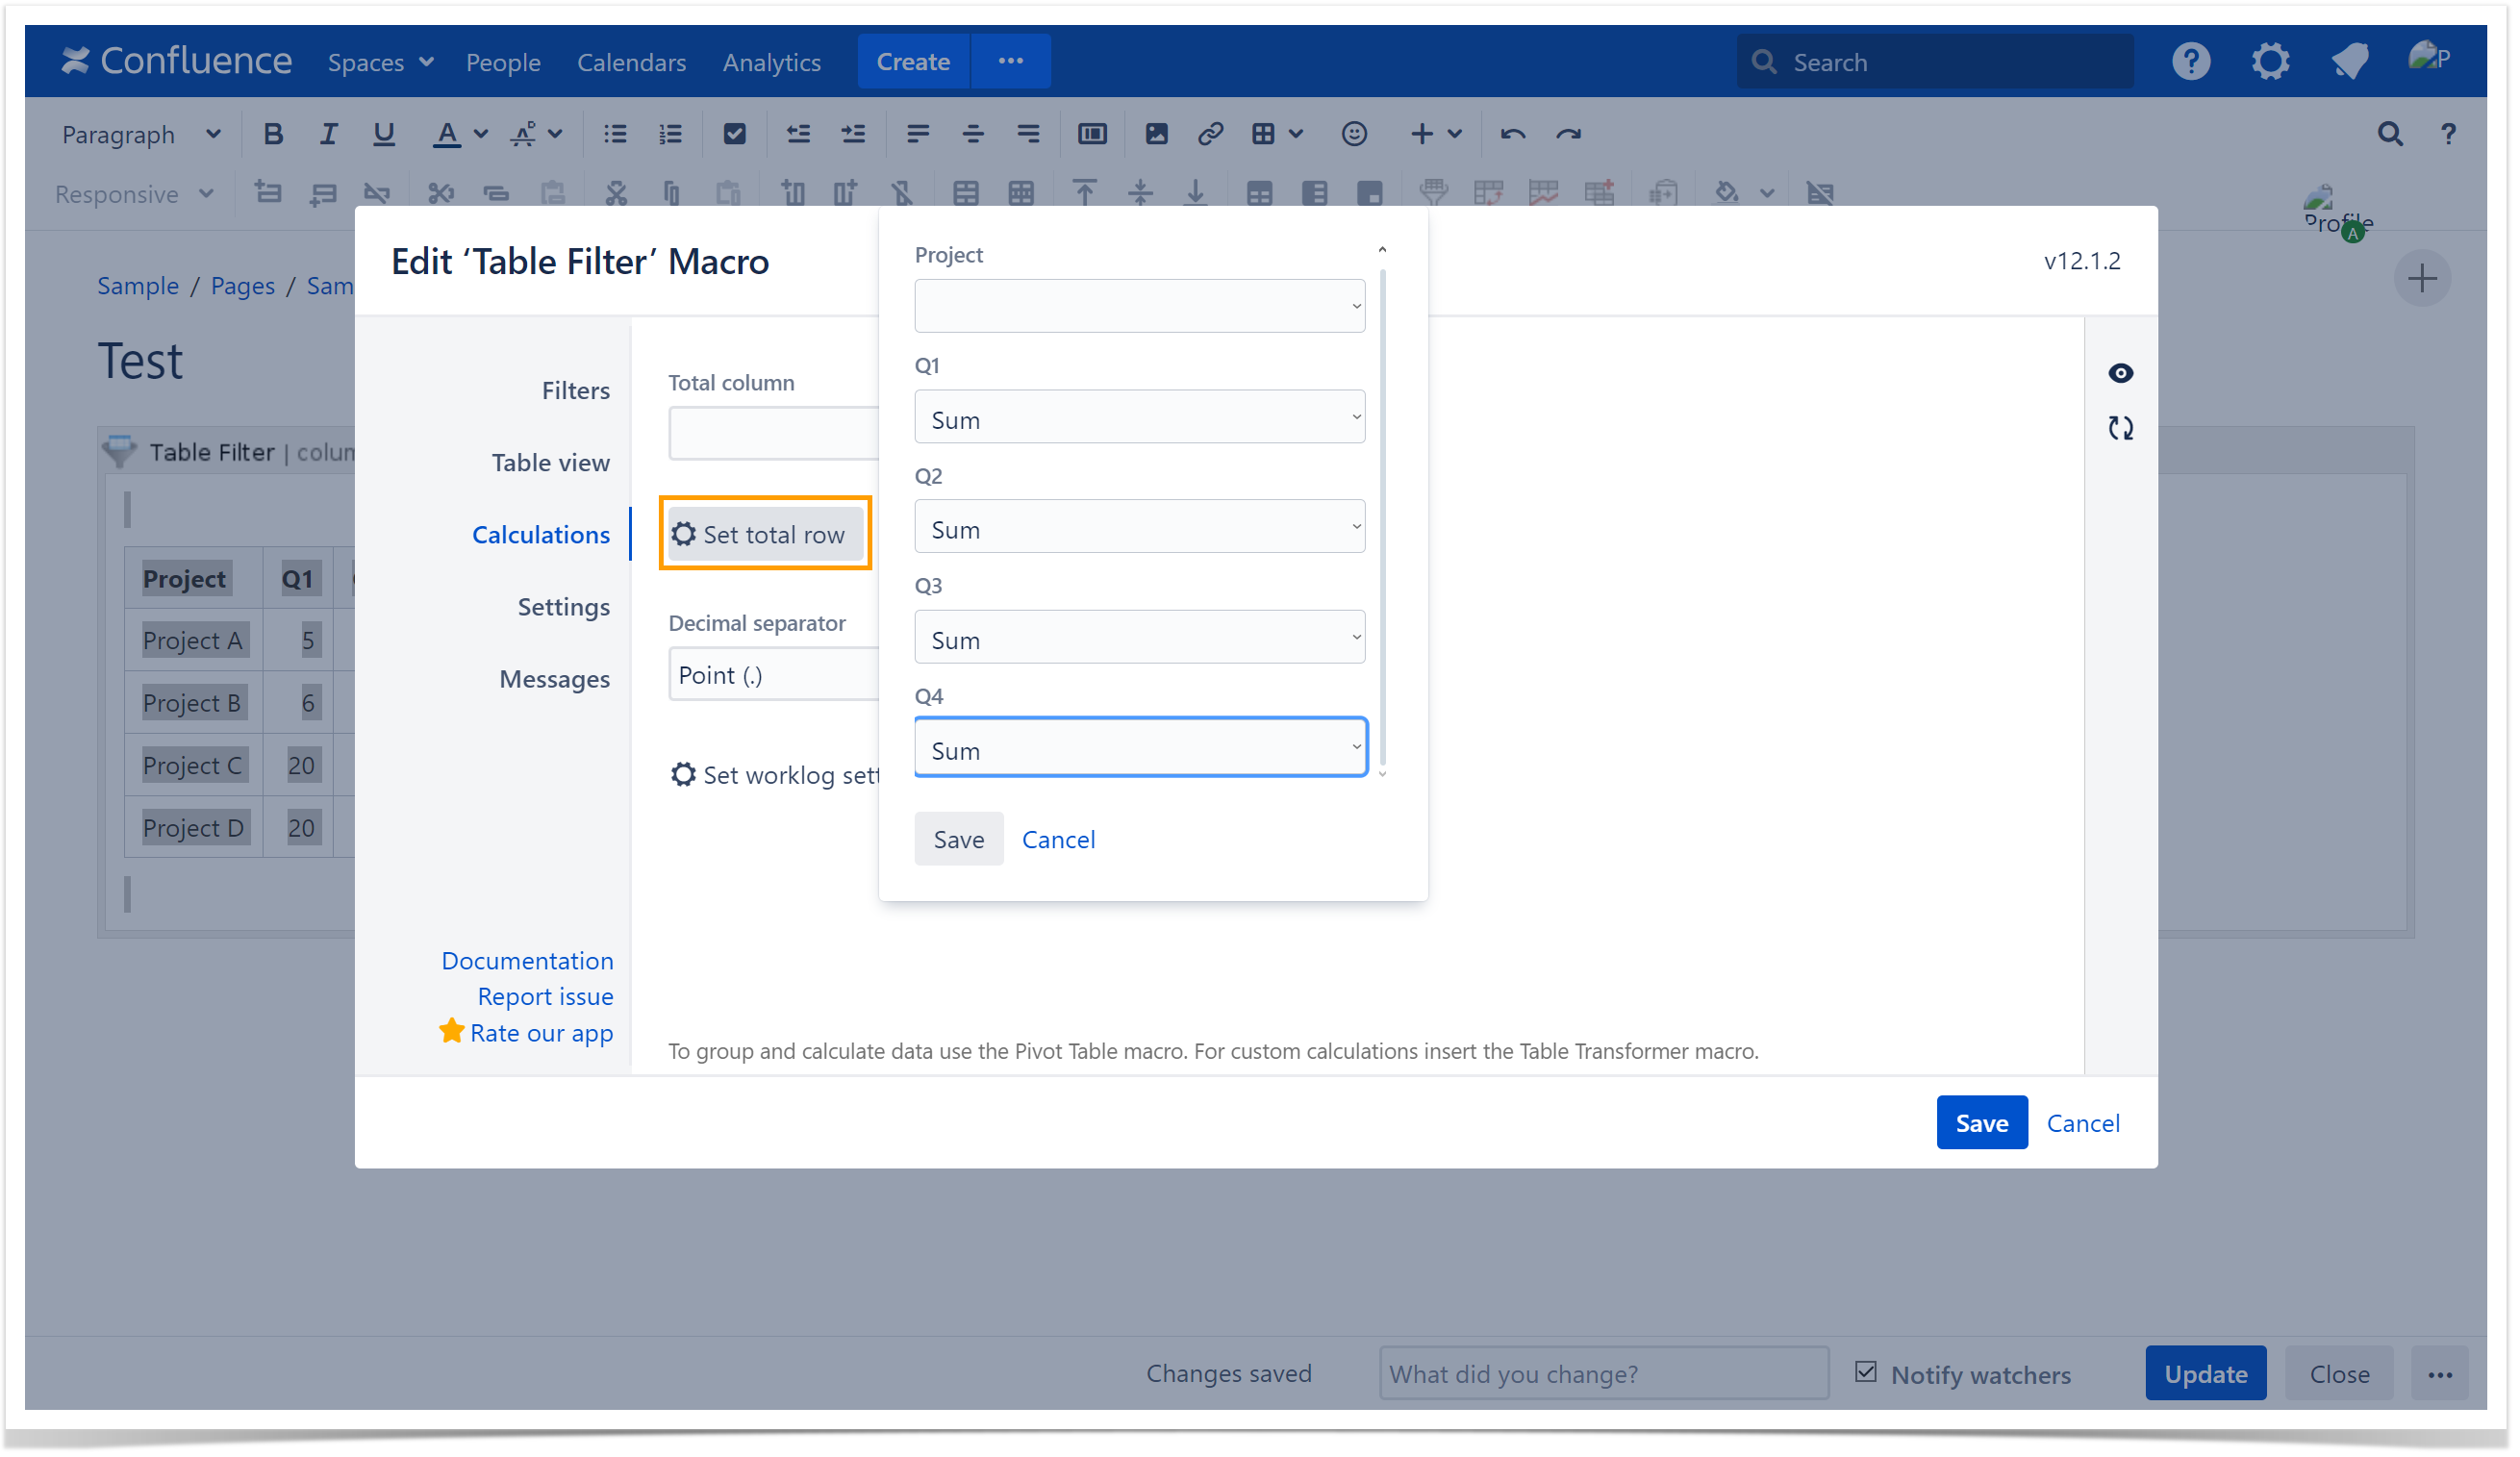
To enable the totals for a columnTotal row for the table:
- Switch the page to the edit mode.
- Select the macro and click Edit.
- Switch to the Calculations tab.
- Click Count totals for columns Set total row.
- Select the operation type for specific columns.
- Save the macro and the page.
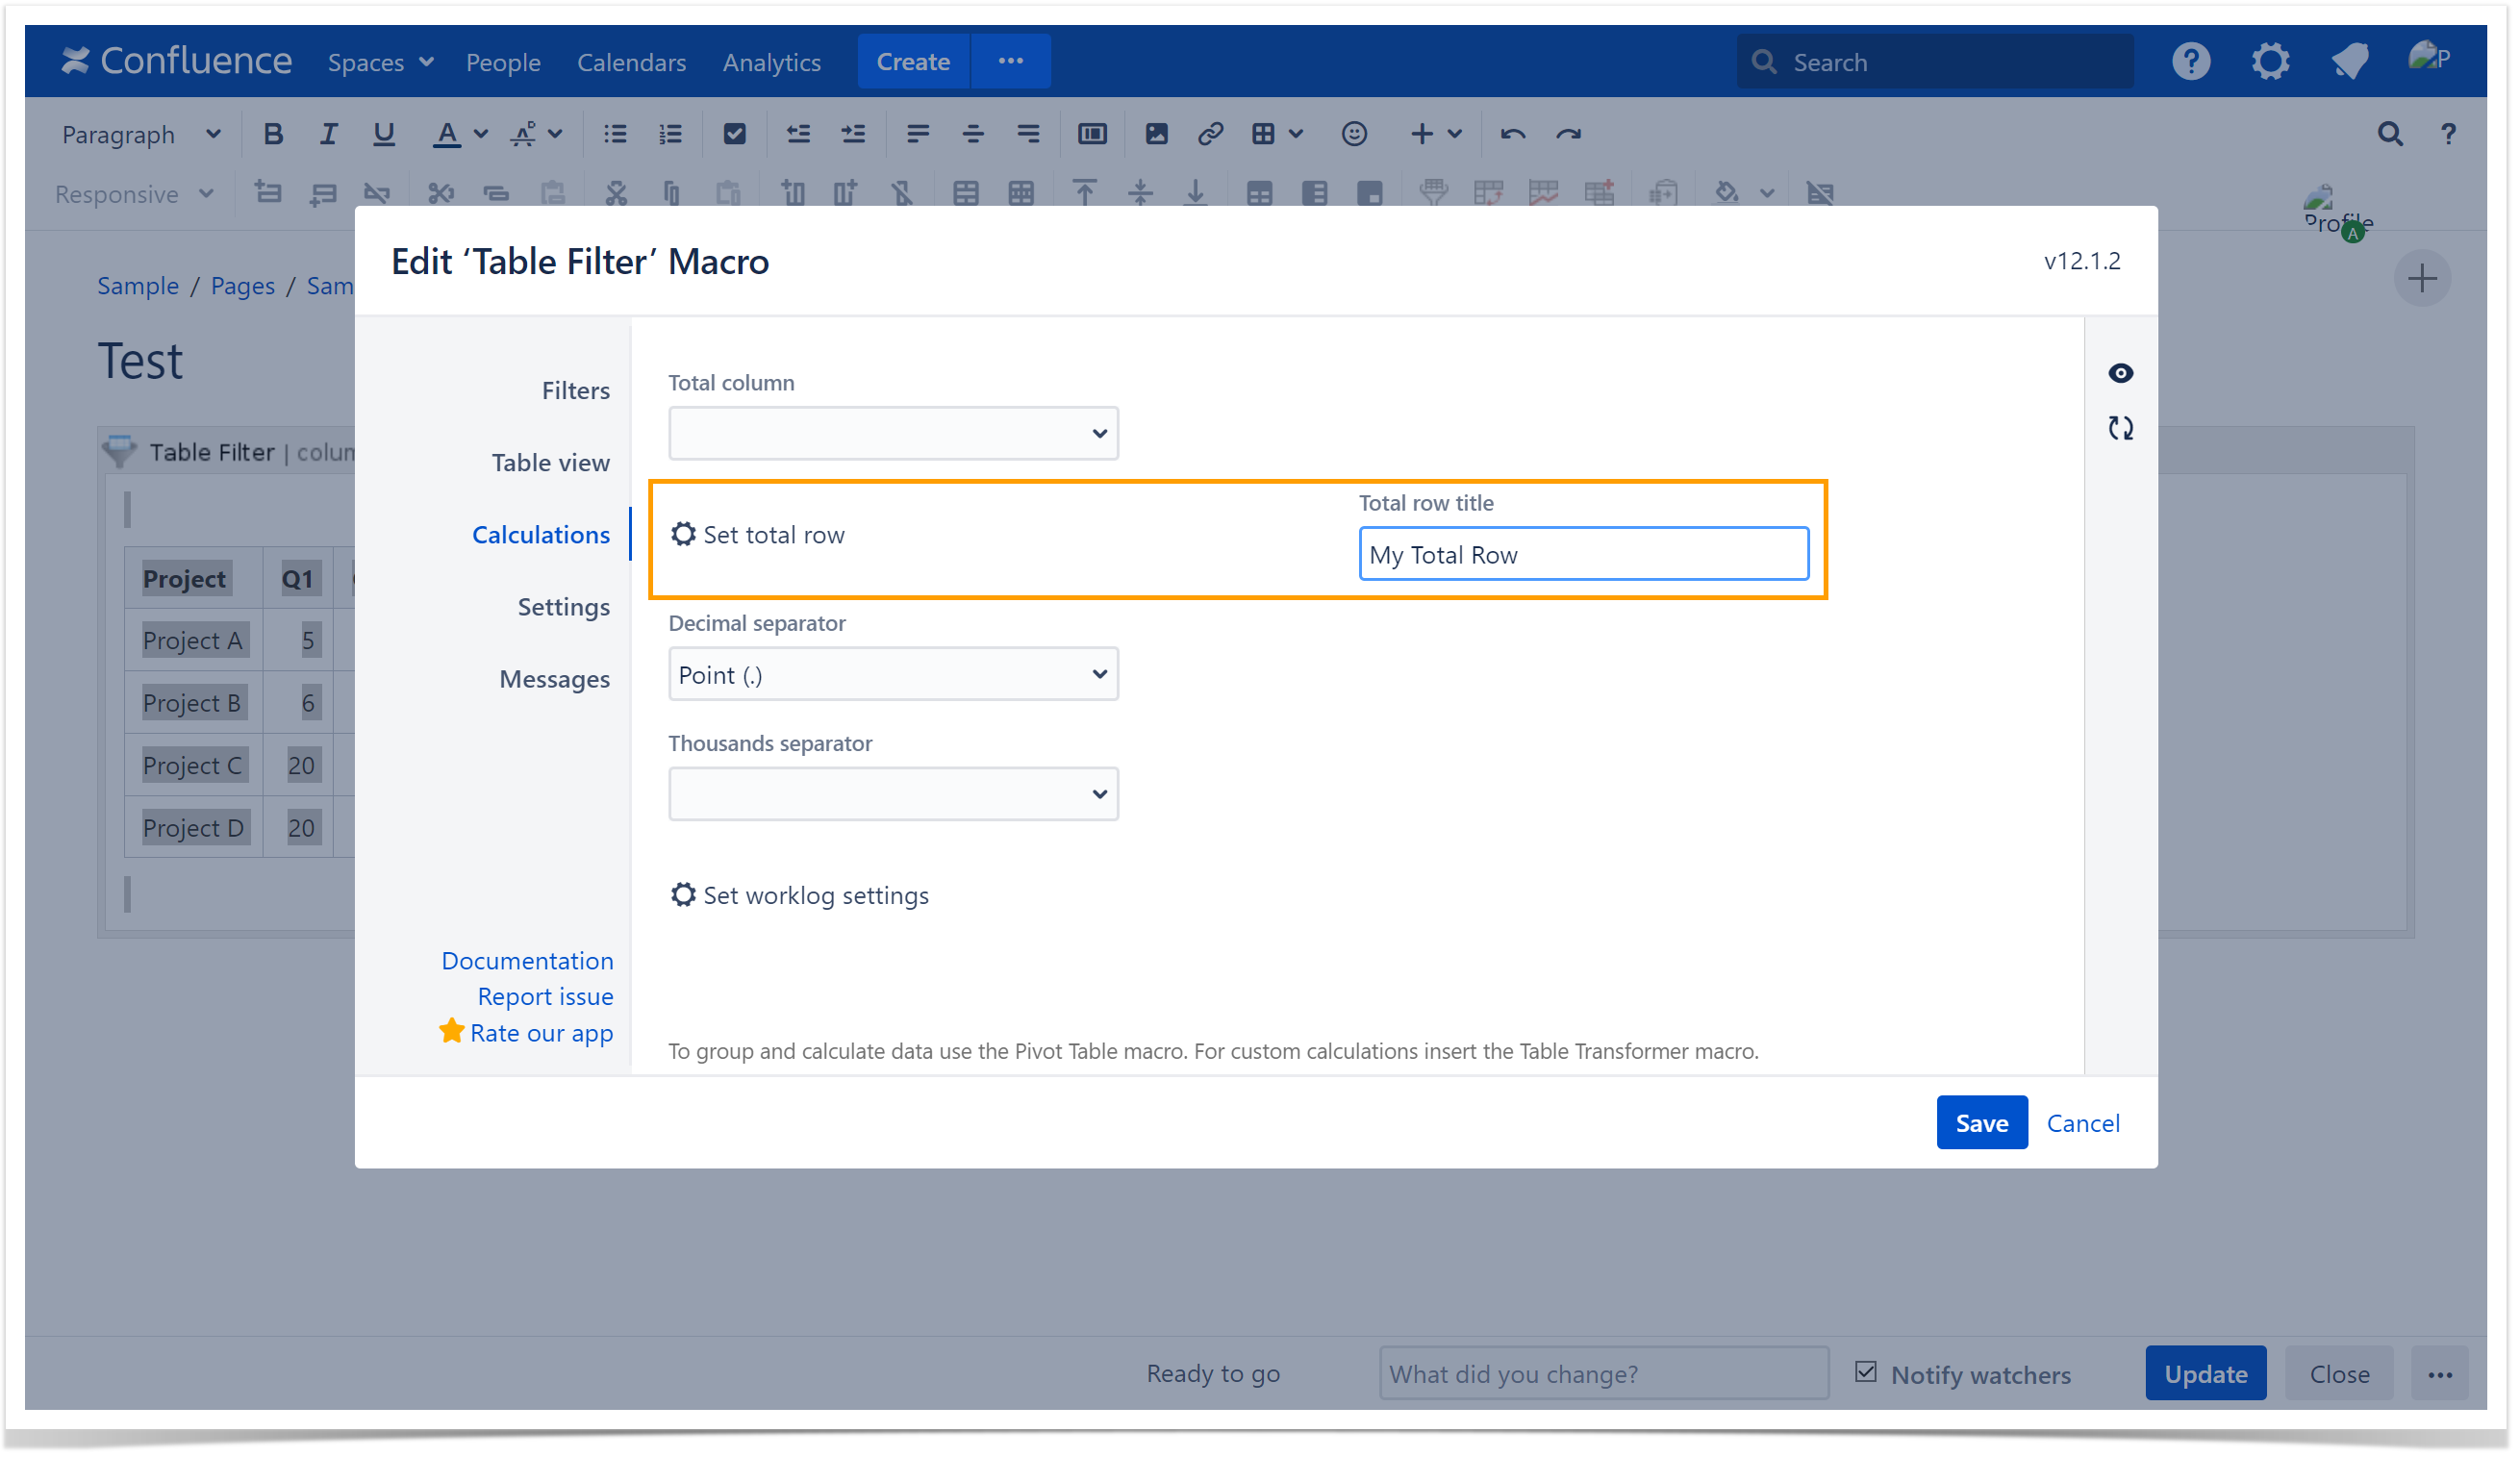
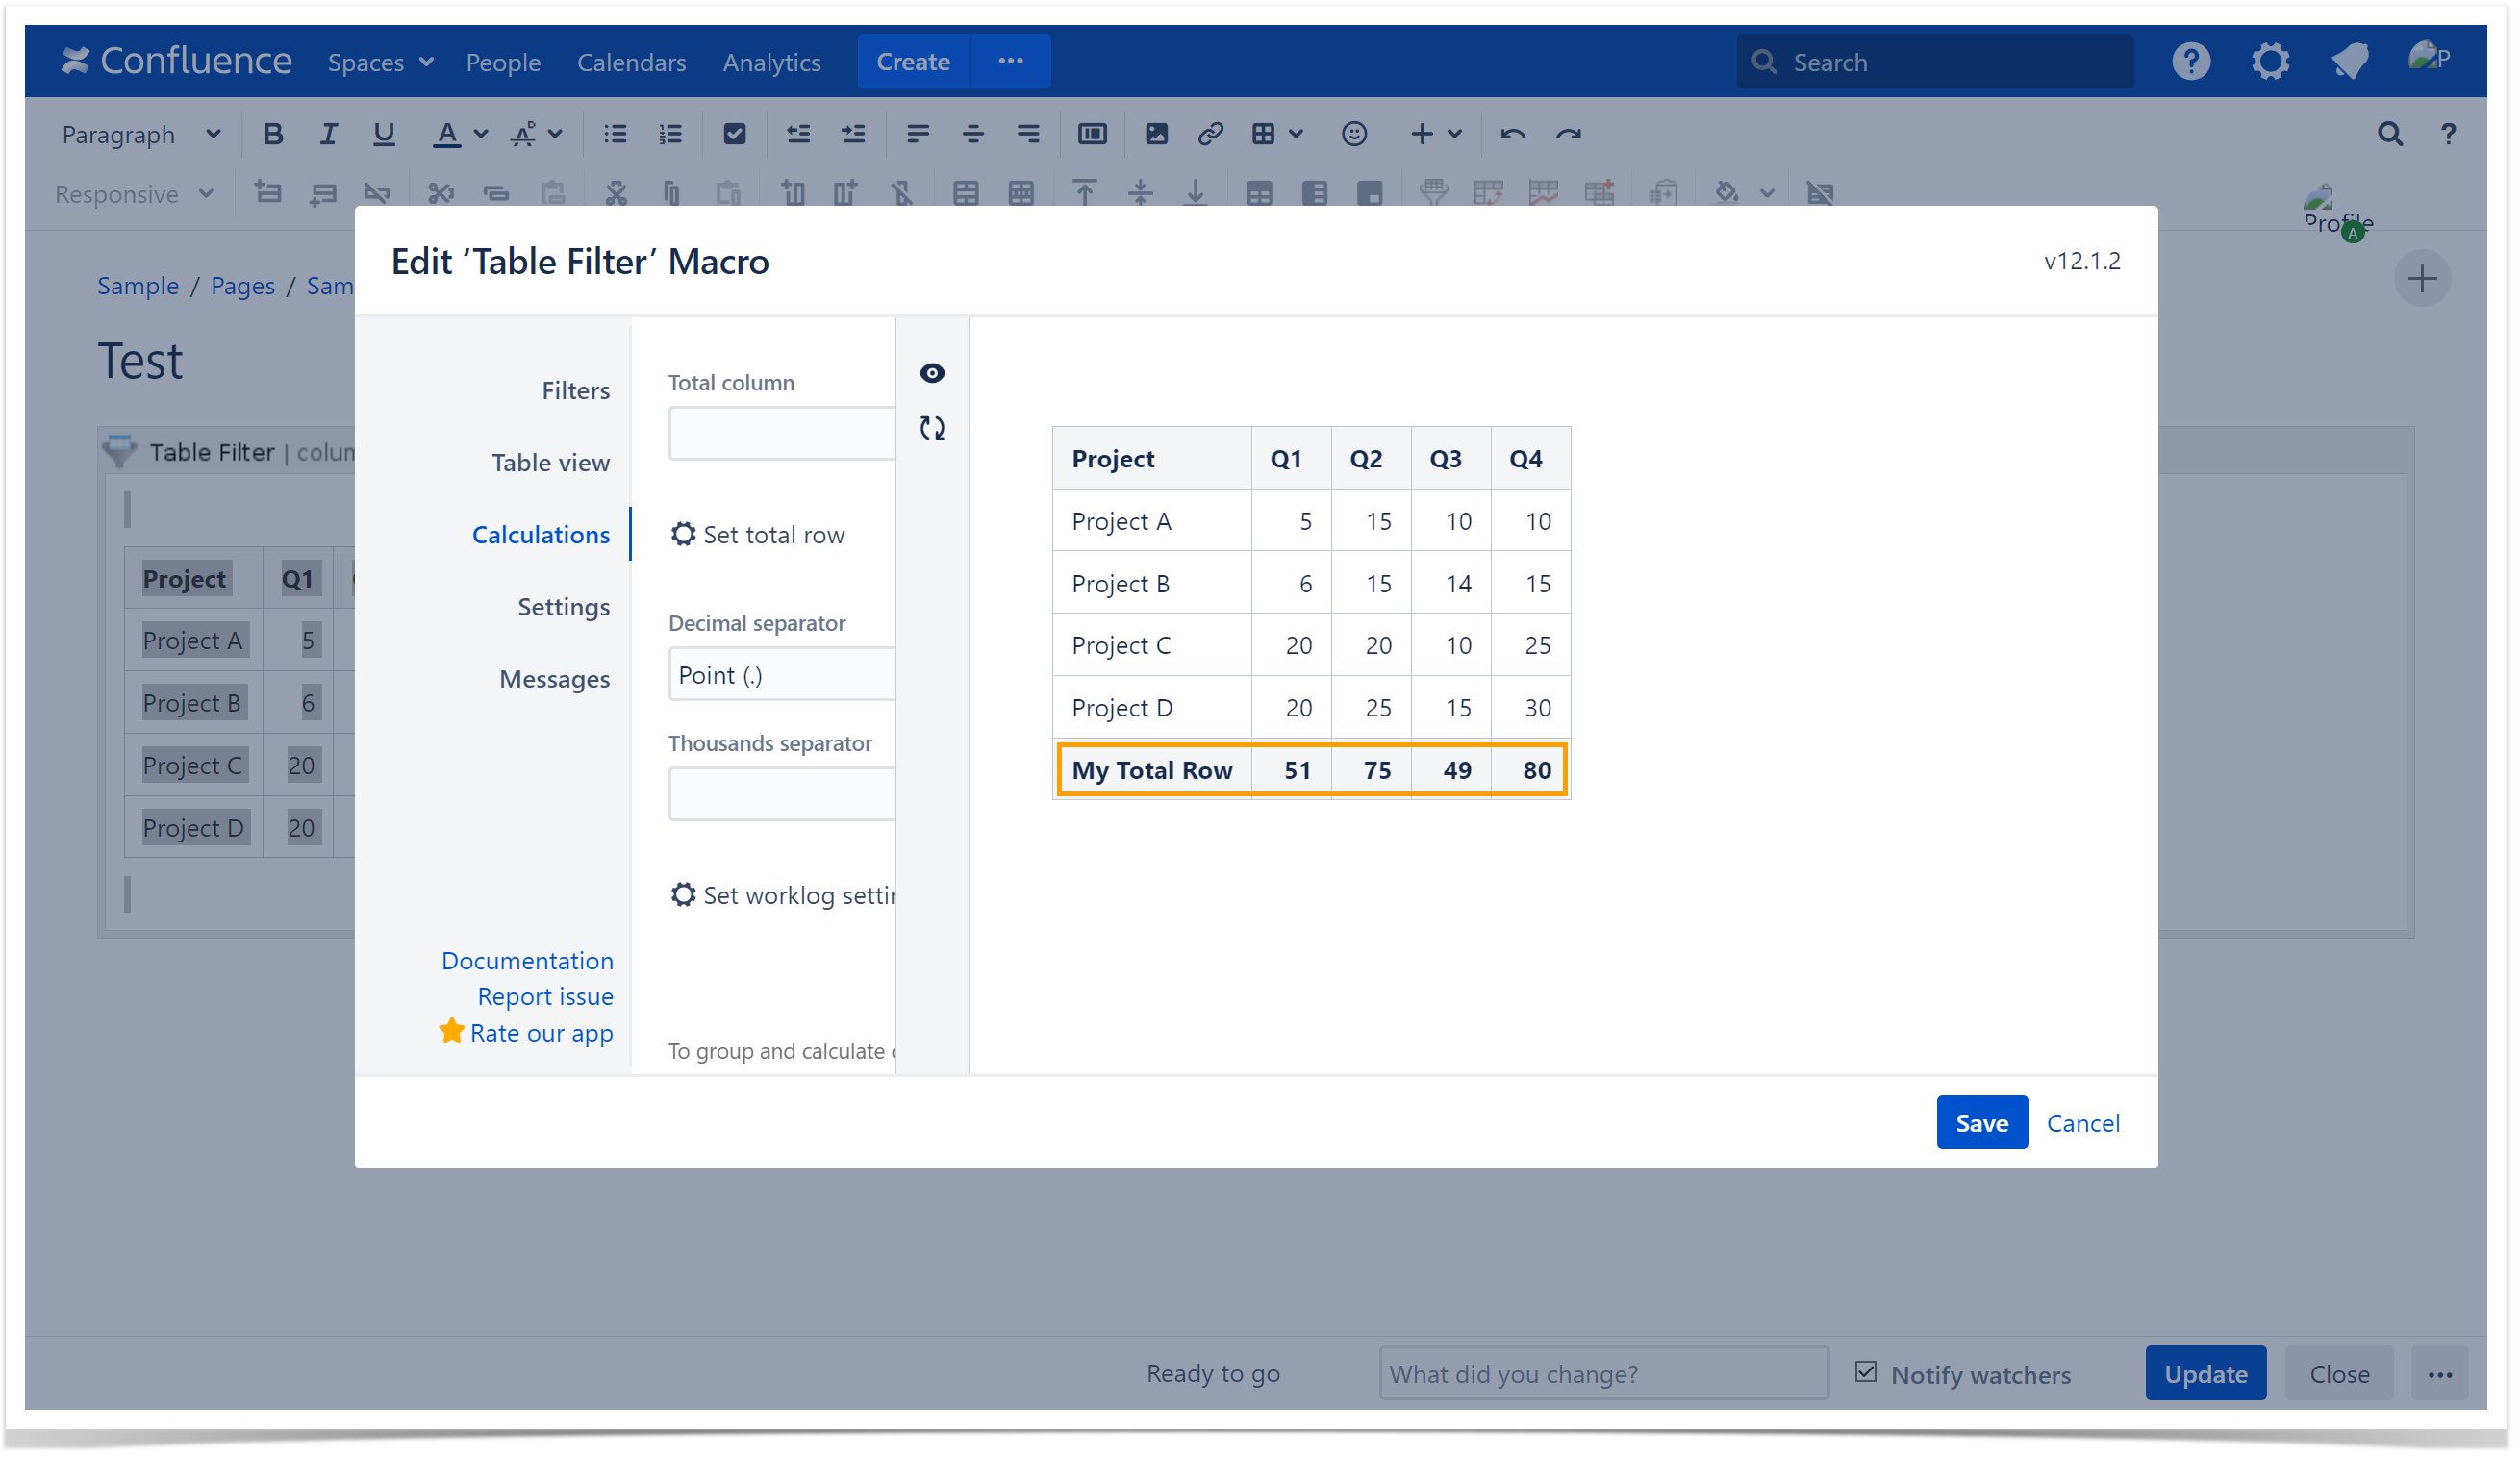
To rename the Total row:
- Locate the Total row title field.
- Enter the name you want Locate the Total row title field and assign your custom name for the total row if required.
The default name for the Total row is "Total". - Save the macro and the page.
| Info |
|---|
Please note that on Data Center in the app versions older than 12.1.2 the Set total row option was called Count totals for columns. Other steps remain the same. |
| Handy Carousel |
|---|
|


Output sparkline charts within tables
The app allows you to embed sparkline charts into the table column. Sparkline charts allow you to quickly visualize your data sets and see the data movements at once.
- Switch the page to the edit mode.
- Select the macro and click Edit.
- Switch to the Table View tab.
- Locate the Sparkline charts slider and tick it.
- Specify the appropriate name for the column outputting sparkline charts.
- Click Save.
- Once you save the page, you will see sparkline charts in a new table column.
| Info |
|---|
If your table contains decimal numbers, you may need to specify the correct decimal separator on the Filtration tab. |
| Handy Carousel |
|---|
|


Learn how to perform complex calculations and aggregate table data:
| Table Excerpt | ||||||||||||||||||||||||||||||||||
|---|---|---|---|---|---|---|---|---|---|---|---|---|---|---|---|---|---|---|---|---|---|---|---|---|---|---|---|---|---|---|---|---|---|---|
| ||||||||||||||||||||||||||||||||||
|