Overview
| Section | |||||||||||||||||||||||||||||||||||||||||||||||||||||||||||||||||
|---|---|---|---|---|---|---|---|---|---|---|---|---|---|---|---|---|---|---|---|---|---|---|---|---|---|---|---|---|---|---|---|---|---|---|---|---|---|---|---|---|---|---|---|---|---|---|---|---|---|---|---|---|---|---|---|---|---|---|---|---|---|---|---|---|---|
|


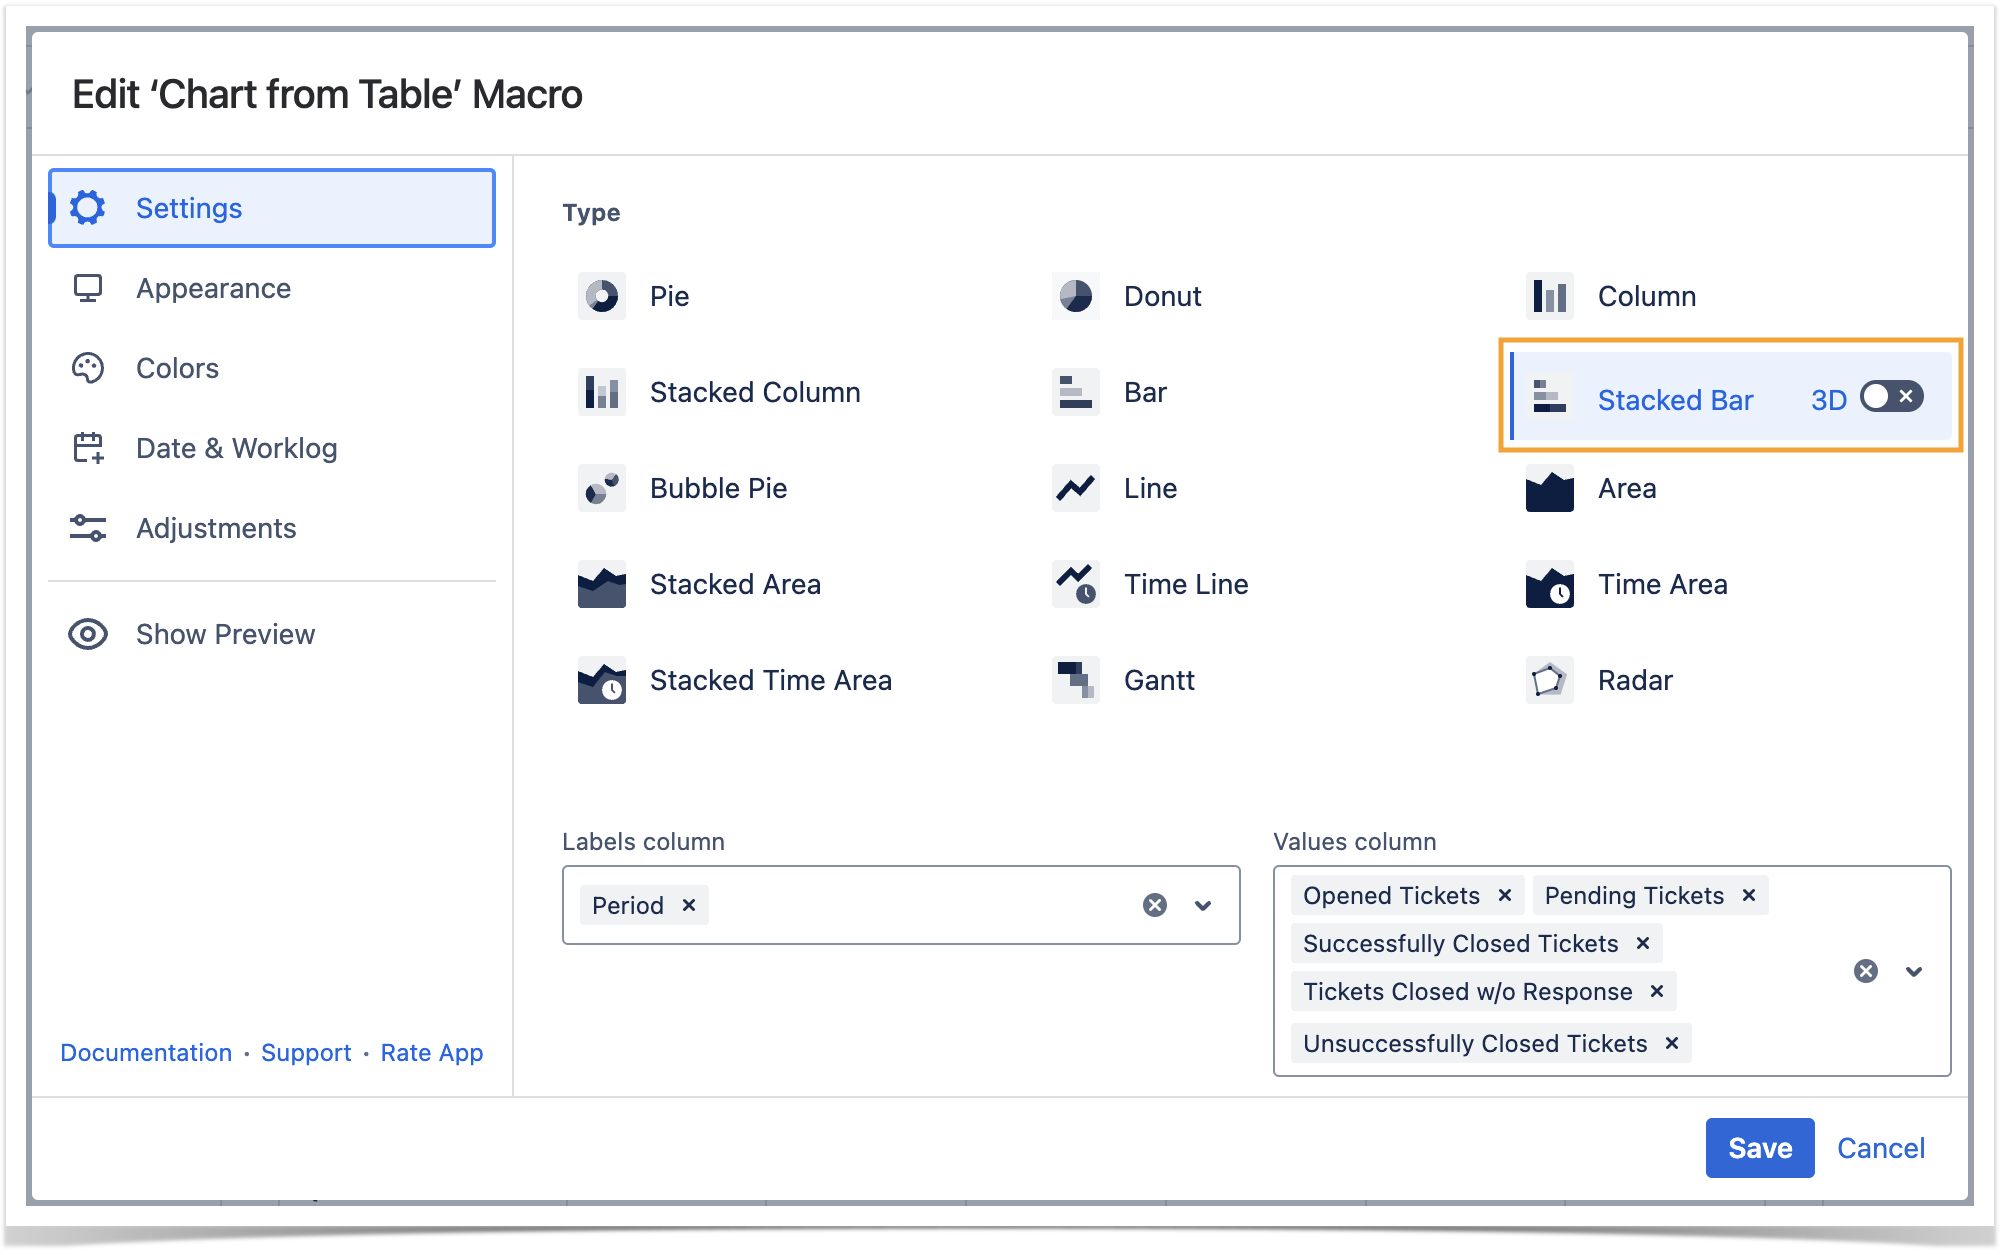
Settings Tab
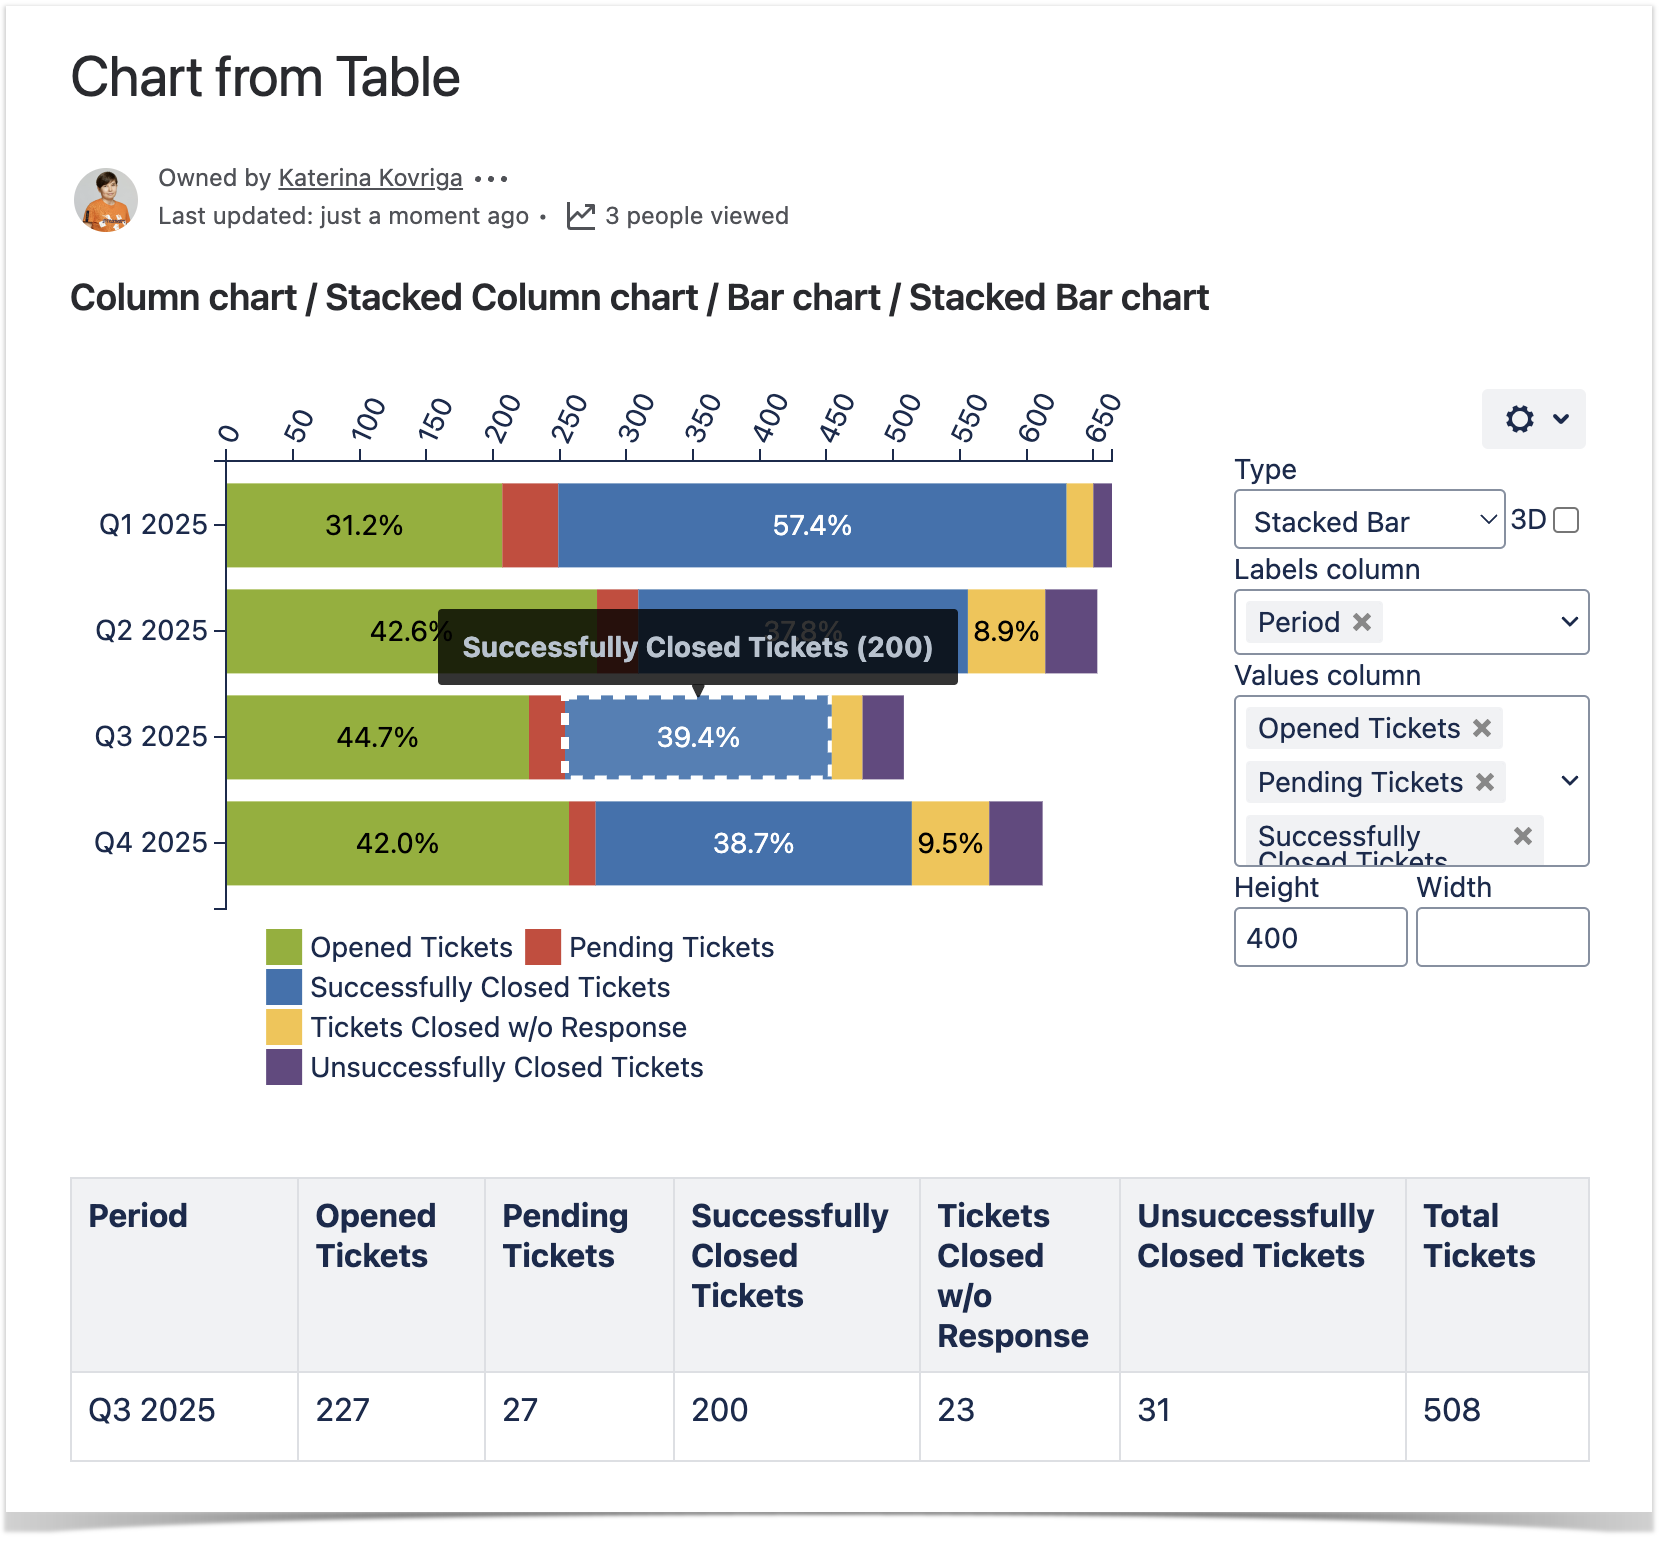
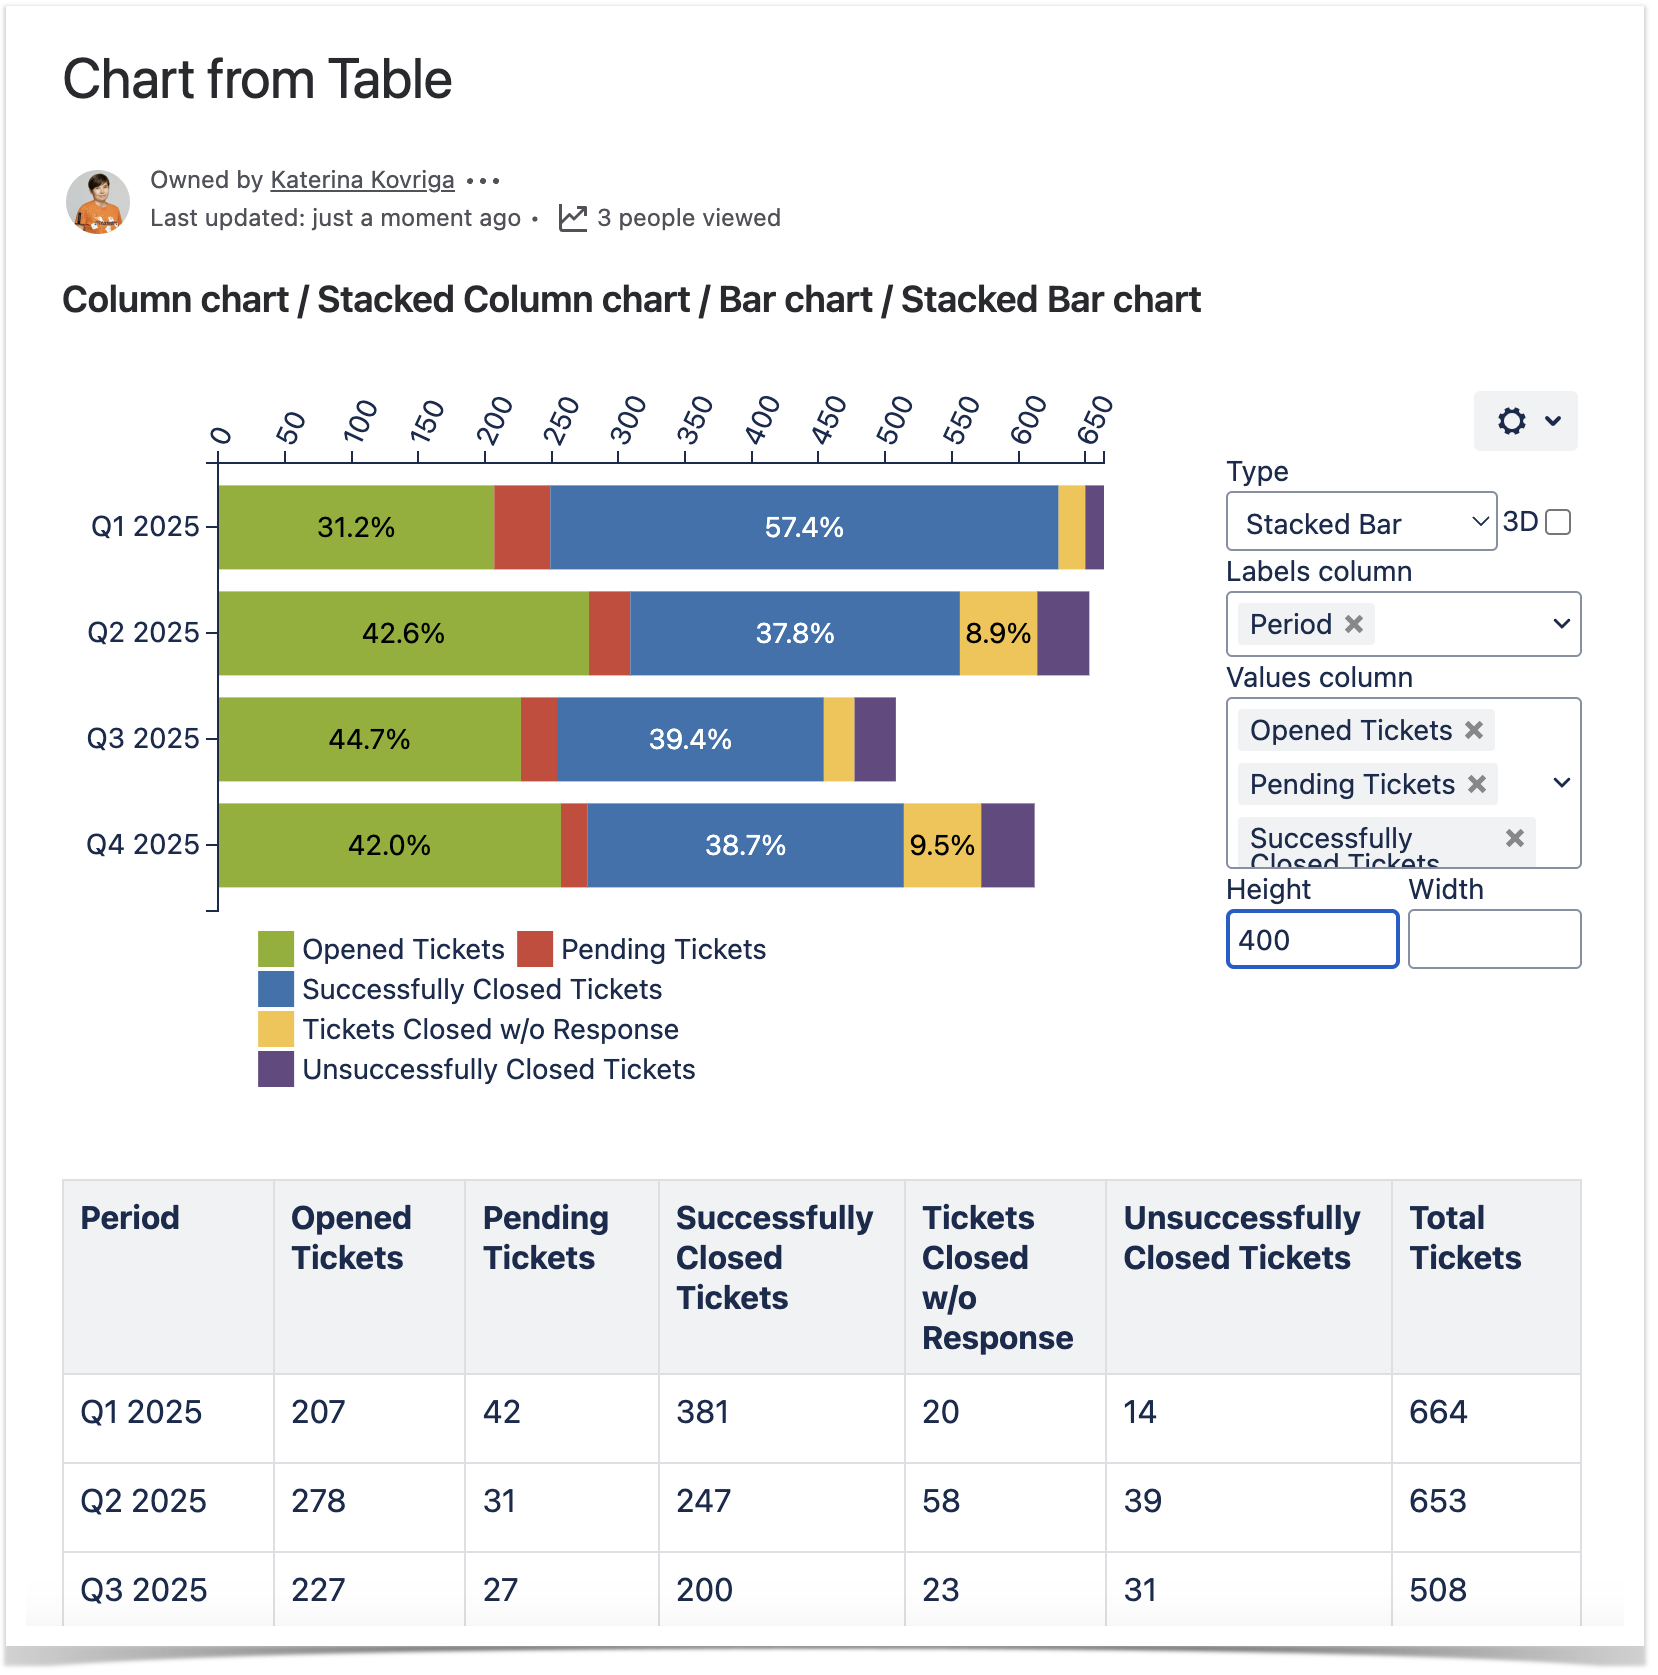
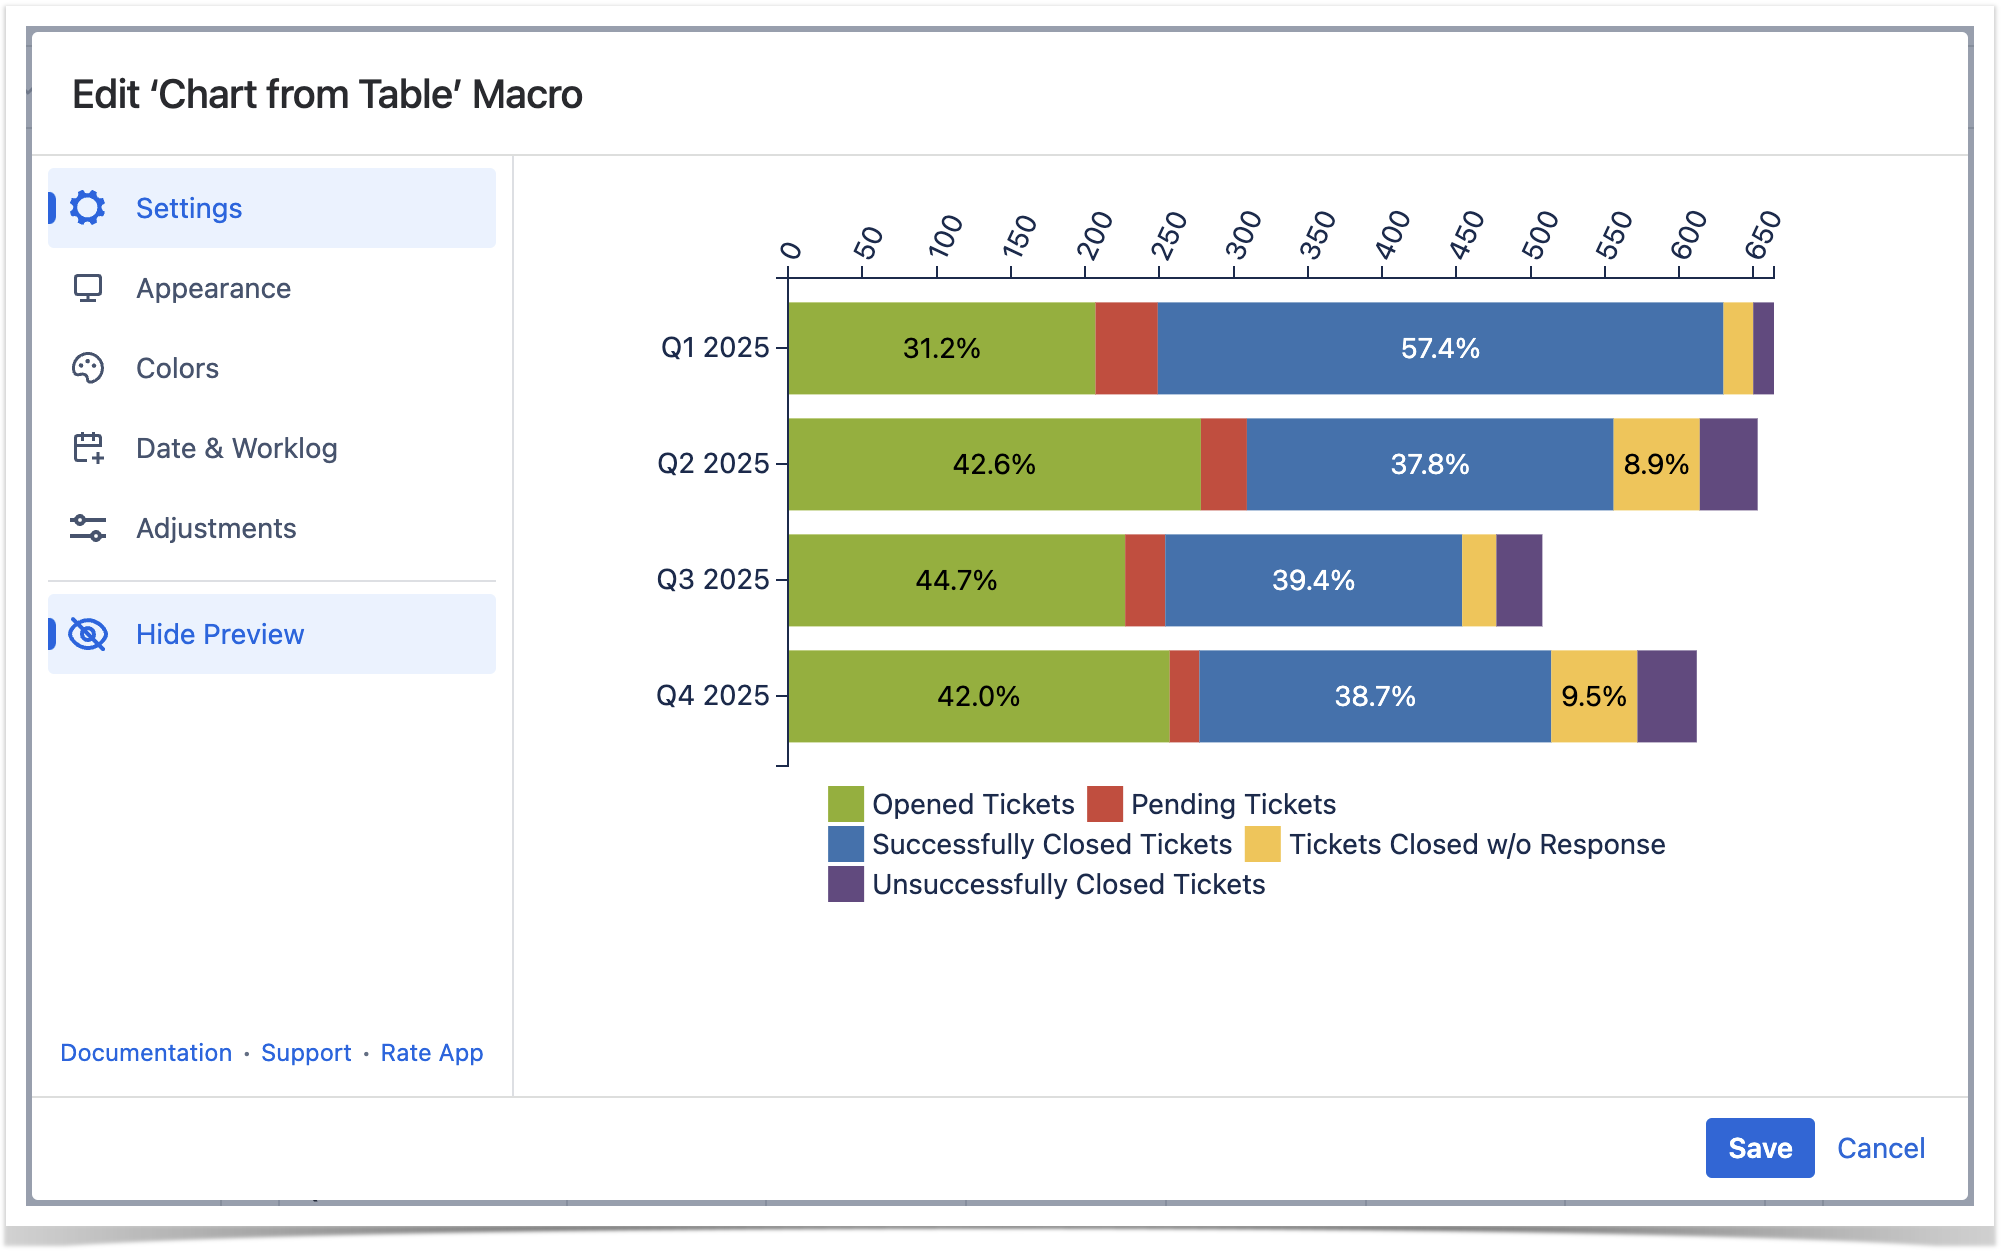
Select the chart type
To select the chart type in the page view mode:
- Insert the Chart from Table macro.
- Hover over the chart controls on the right of the table.
- Locate the Type option and select the chart type. The The chart will be automatically re-generatedregenerated.
- To save the modifications in the macro body, click the cogwheel icon and select Save changes.
To select the chart type in the macro browser:
- Switch the page to the edit mode.
- Insert the Chart from Table macro and paste the table within the macro body.
- Select the macro and click Edit.
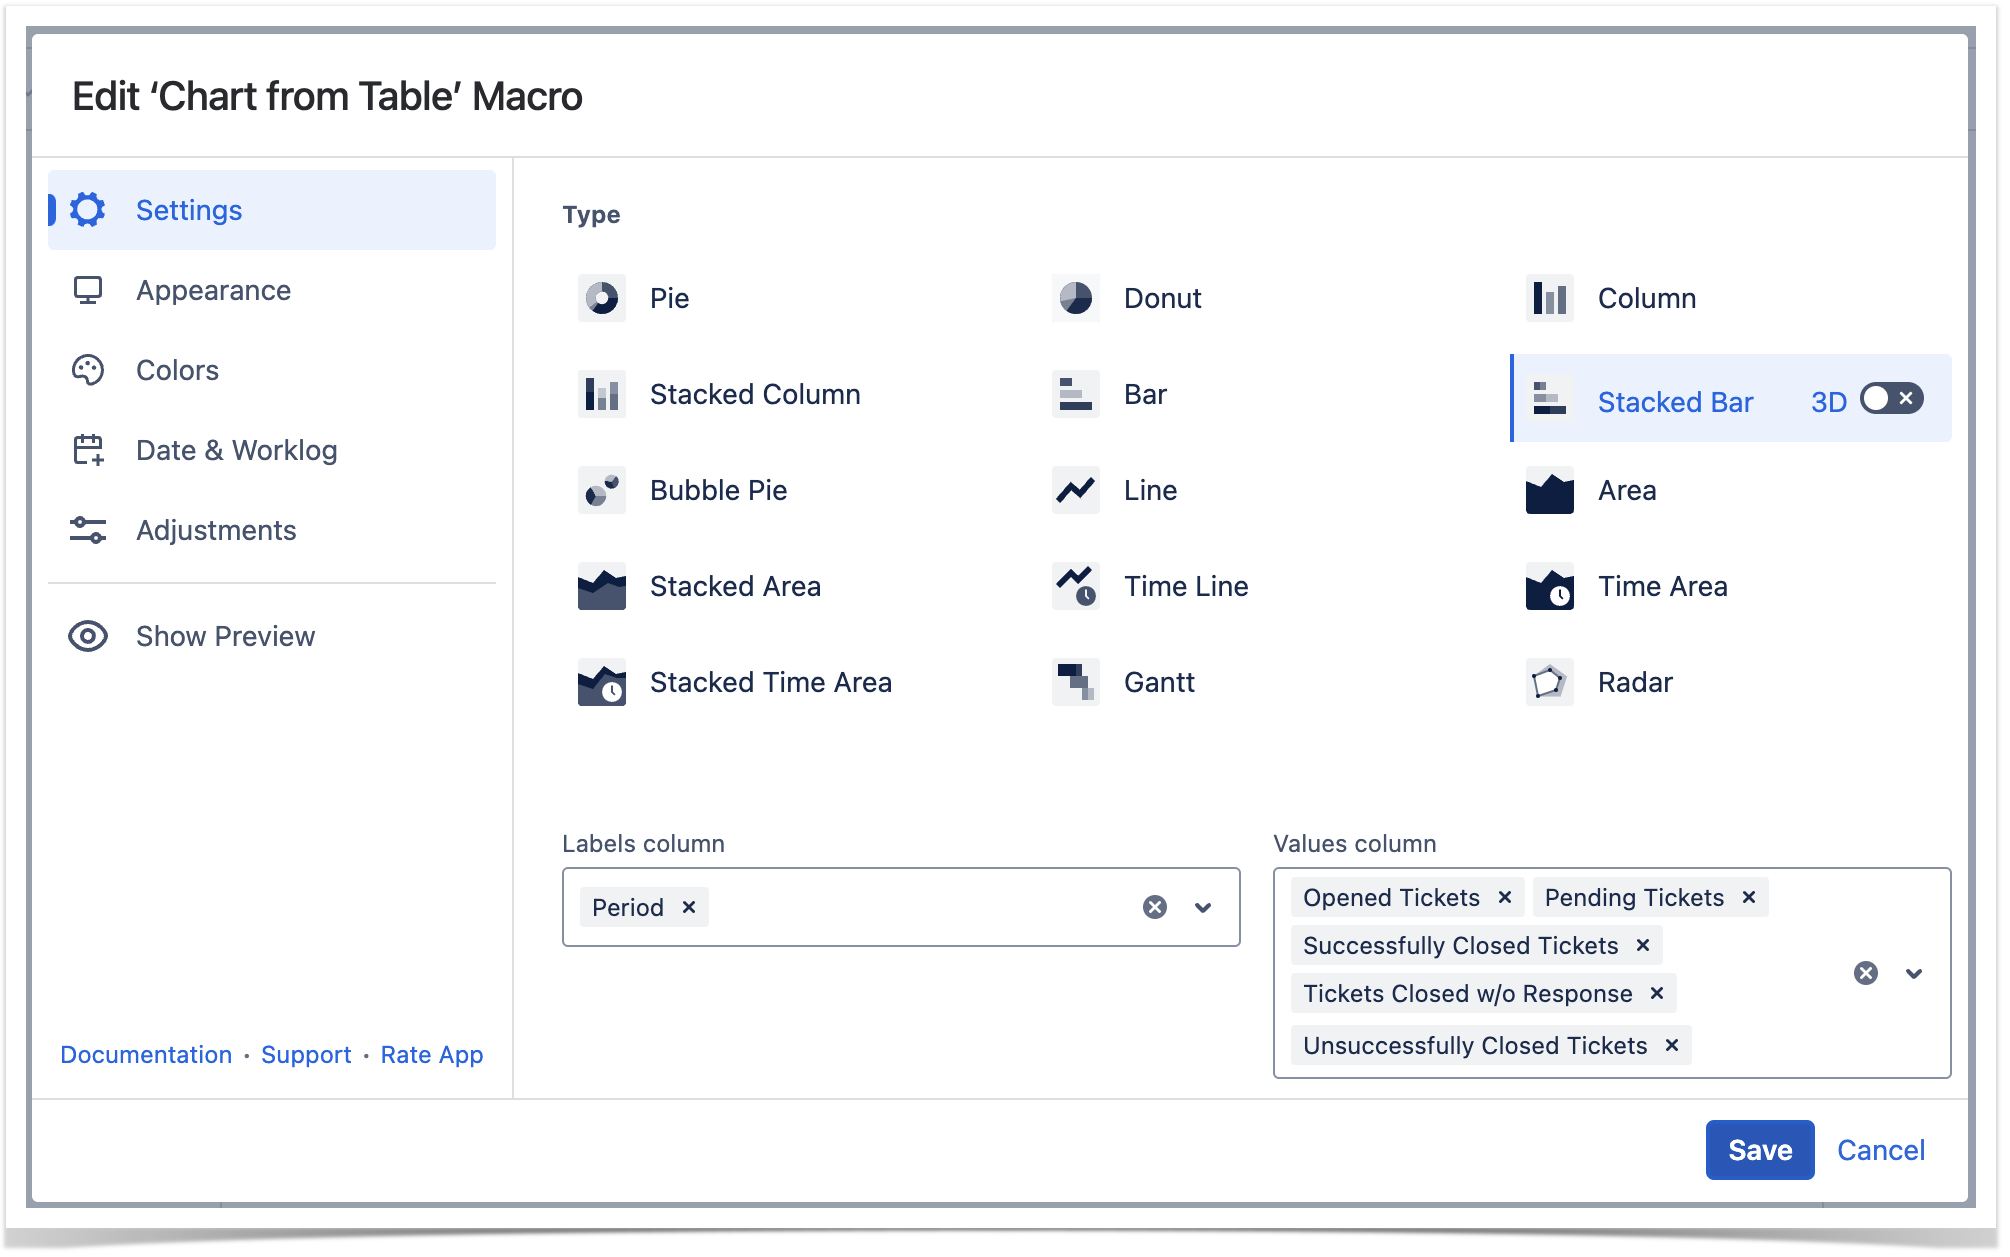
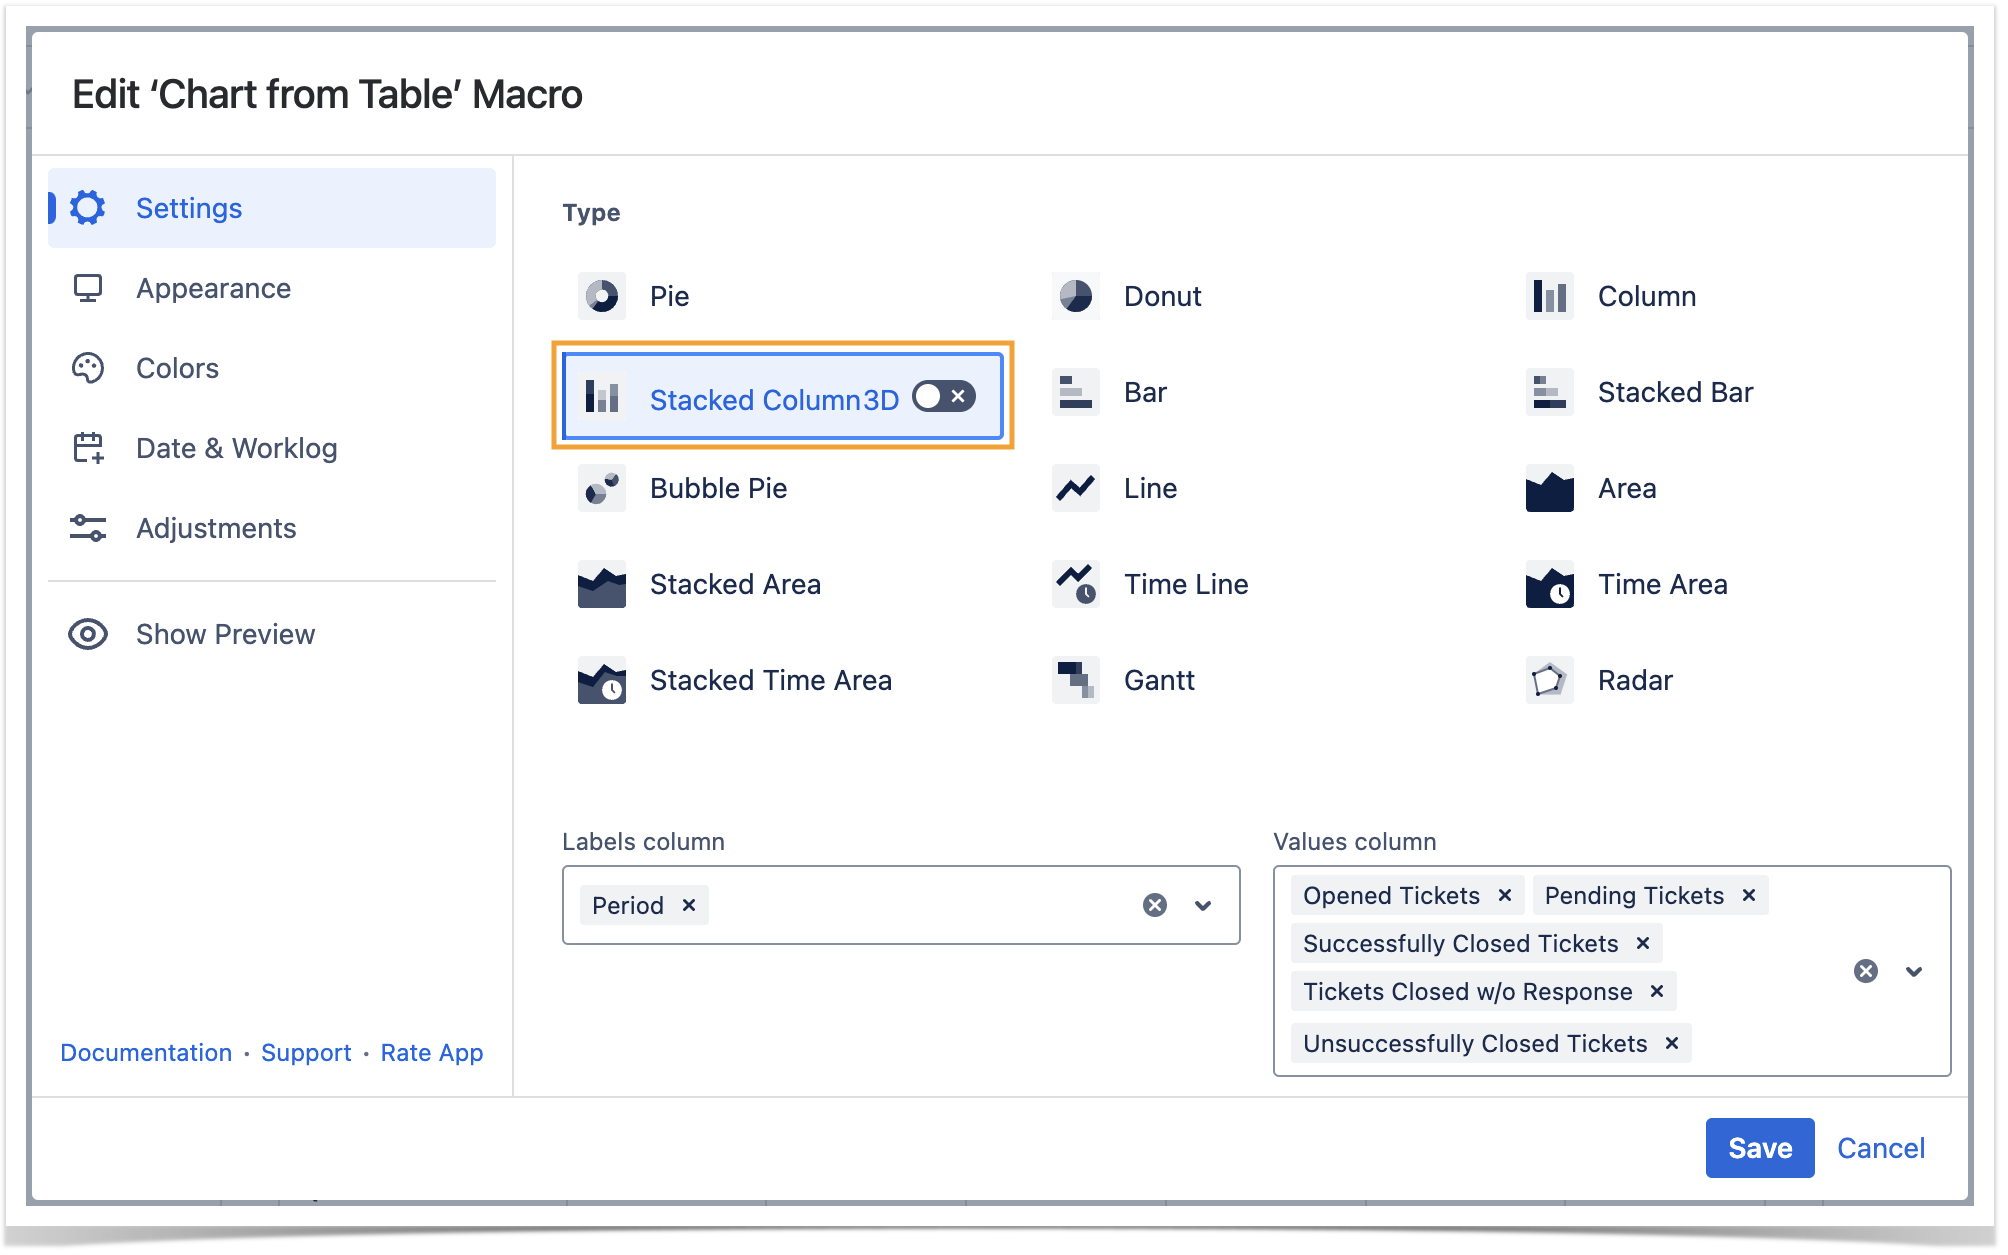
- Locate the Type option in the Settings tab and select the chart type.
- Save the macro and the page.
| Handy Carousel | ||
|---|---|---|
| ||
|
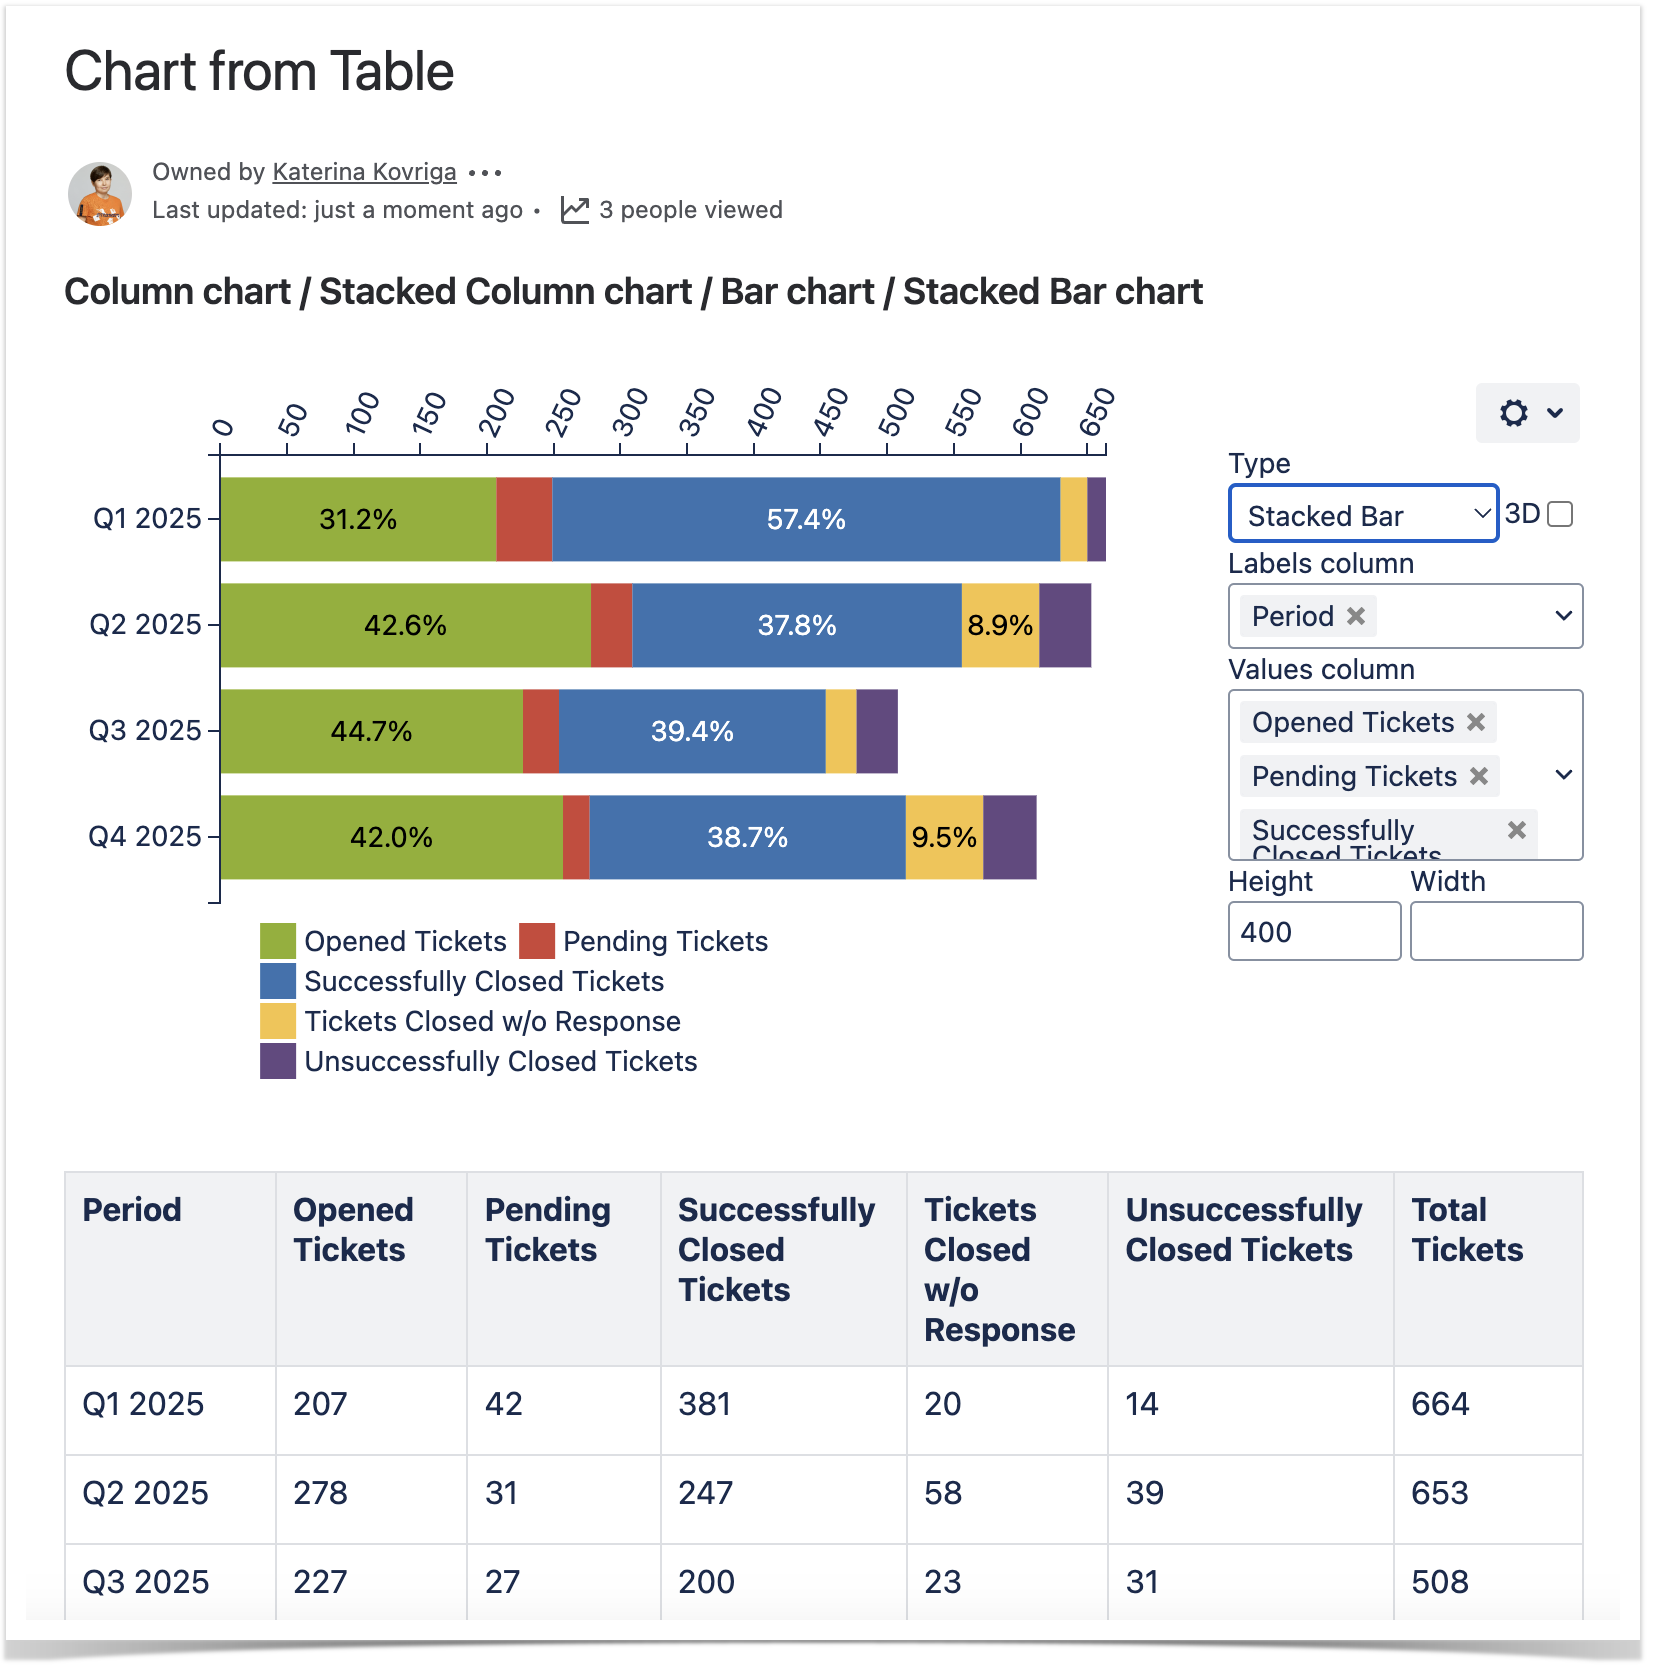


Select data series
Labels column - the column containing labels for data values.
Values column - the column or columns containing numerical values for chart generation.
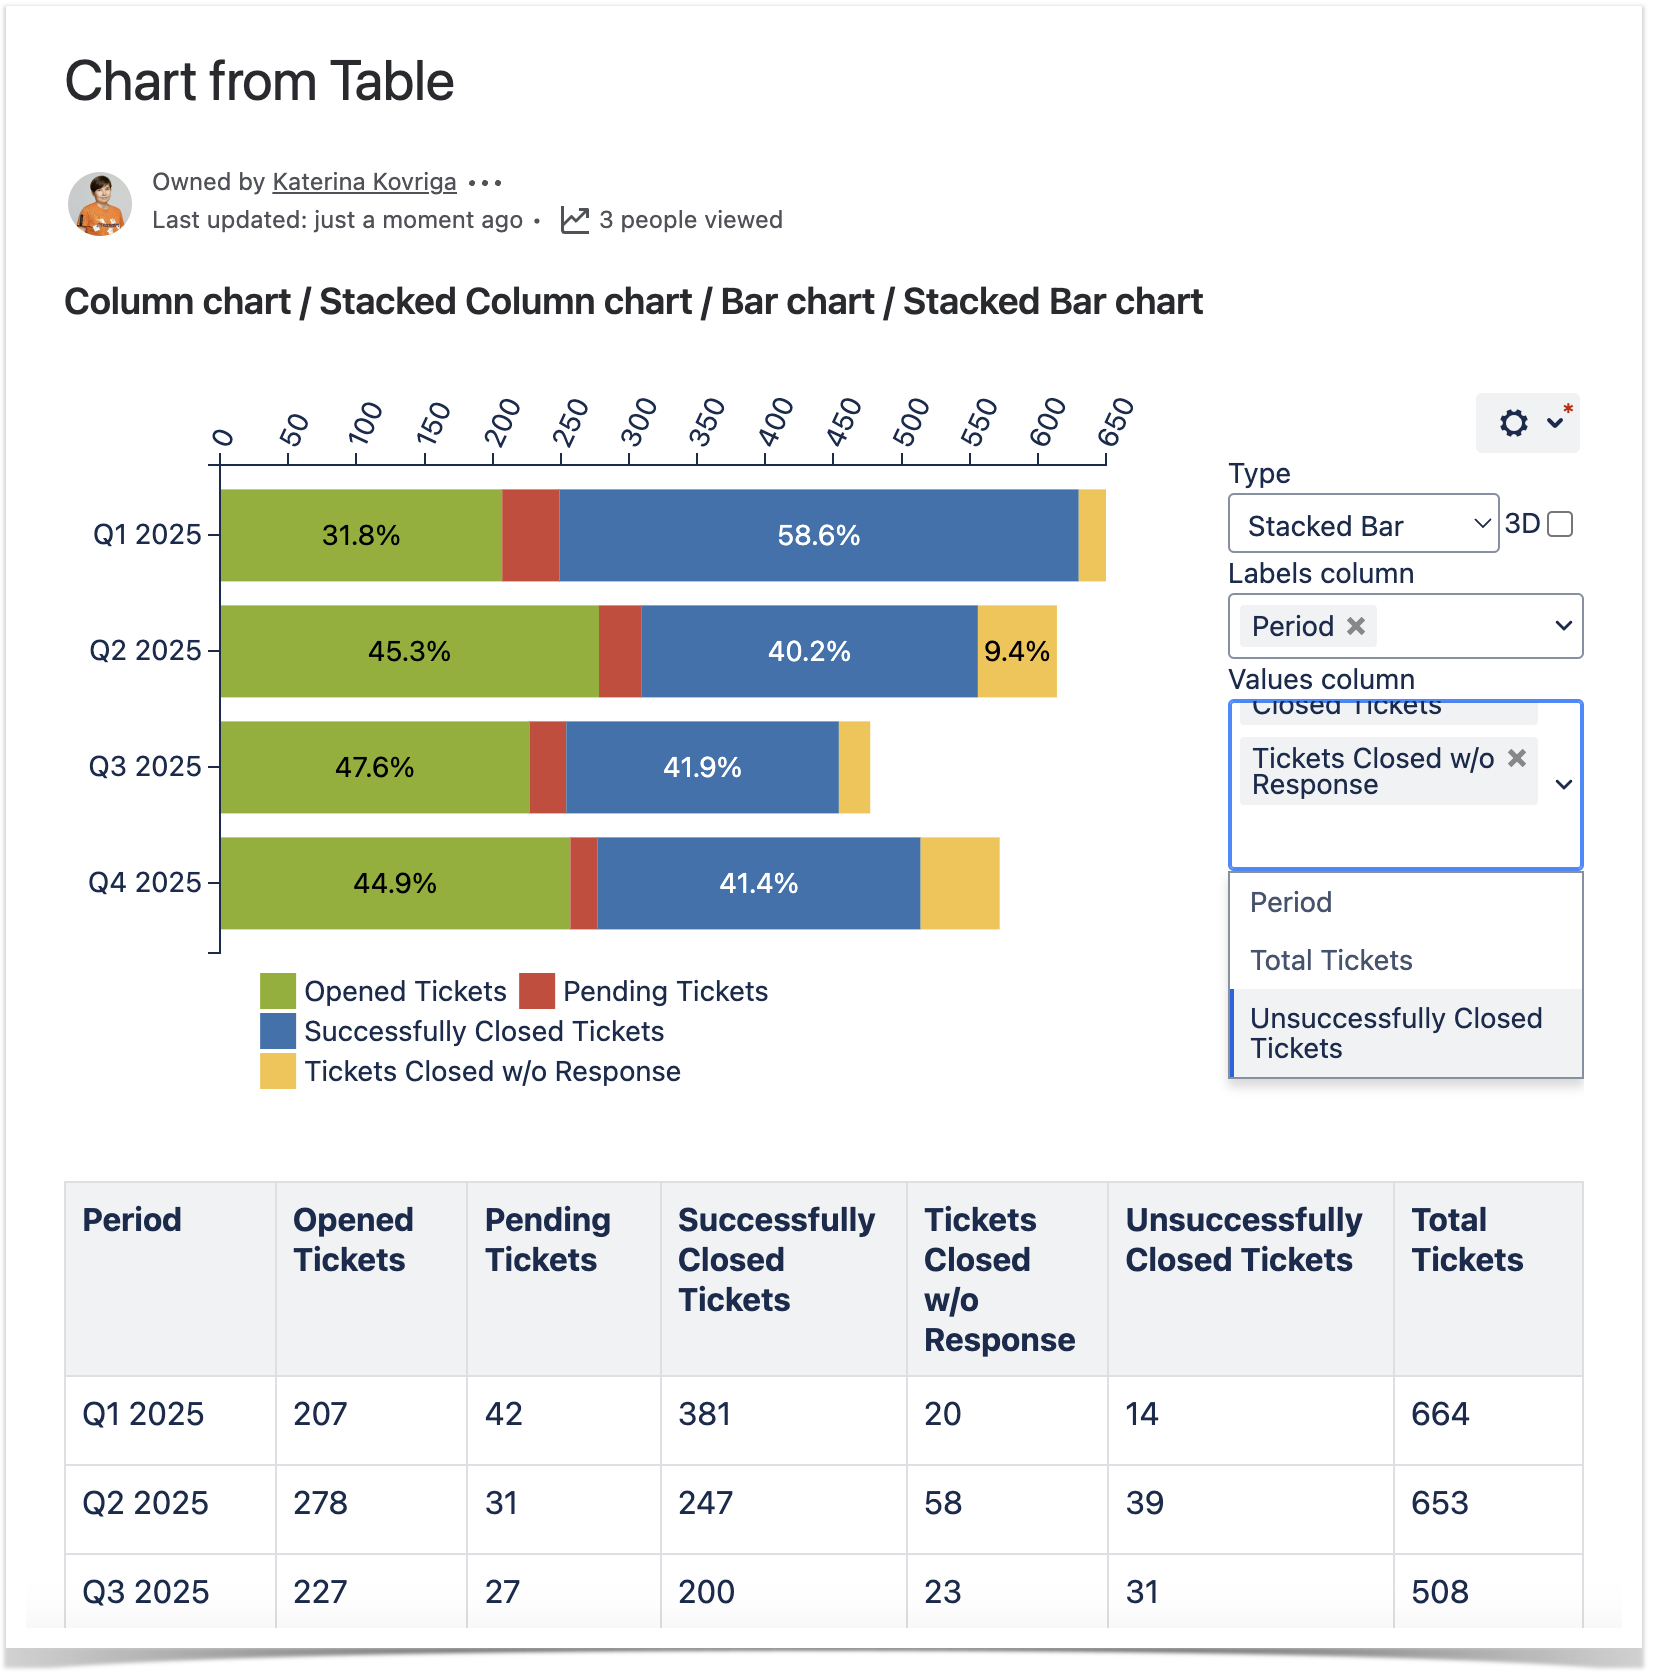
To select data series in the page view mode:
- Insert the Chart from Table macro.
- Hover over the chart controls on the right of the table.
- Locate the Labels column and Values column options and select the table columns containing data for chart generation. The chart will be automatically re-generatedregenerated.
- To save the modifications in the macro body, click the cogwheel icon and select Save changes.
To select data series in the macro browser:
- Switch the page to the edit mode.
- Insert the Chart from Table macro and paste the table within the macro body.
- Select the macro and click Edit.
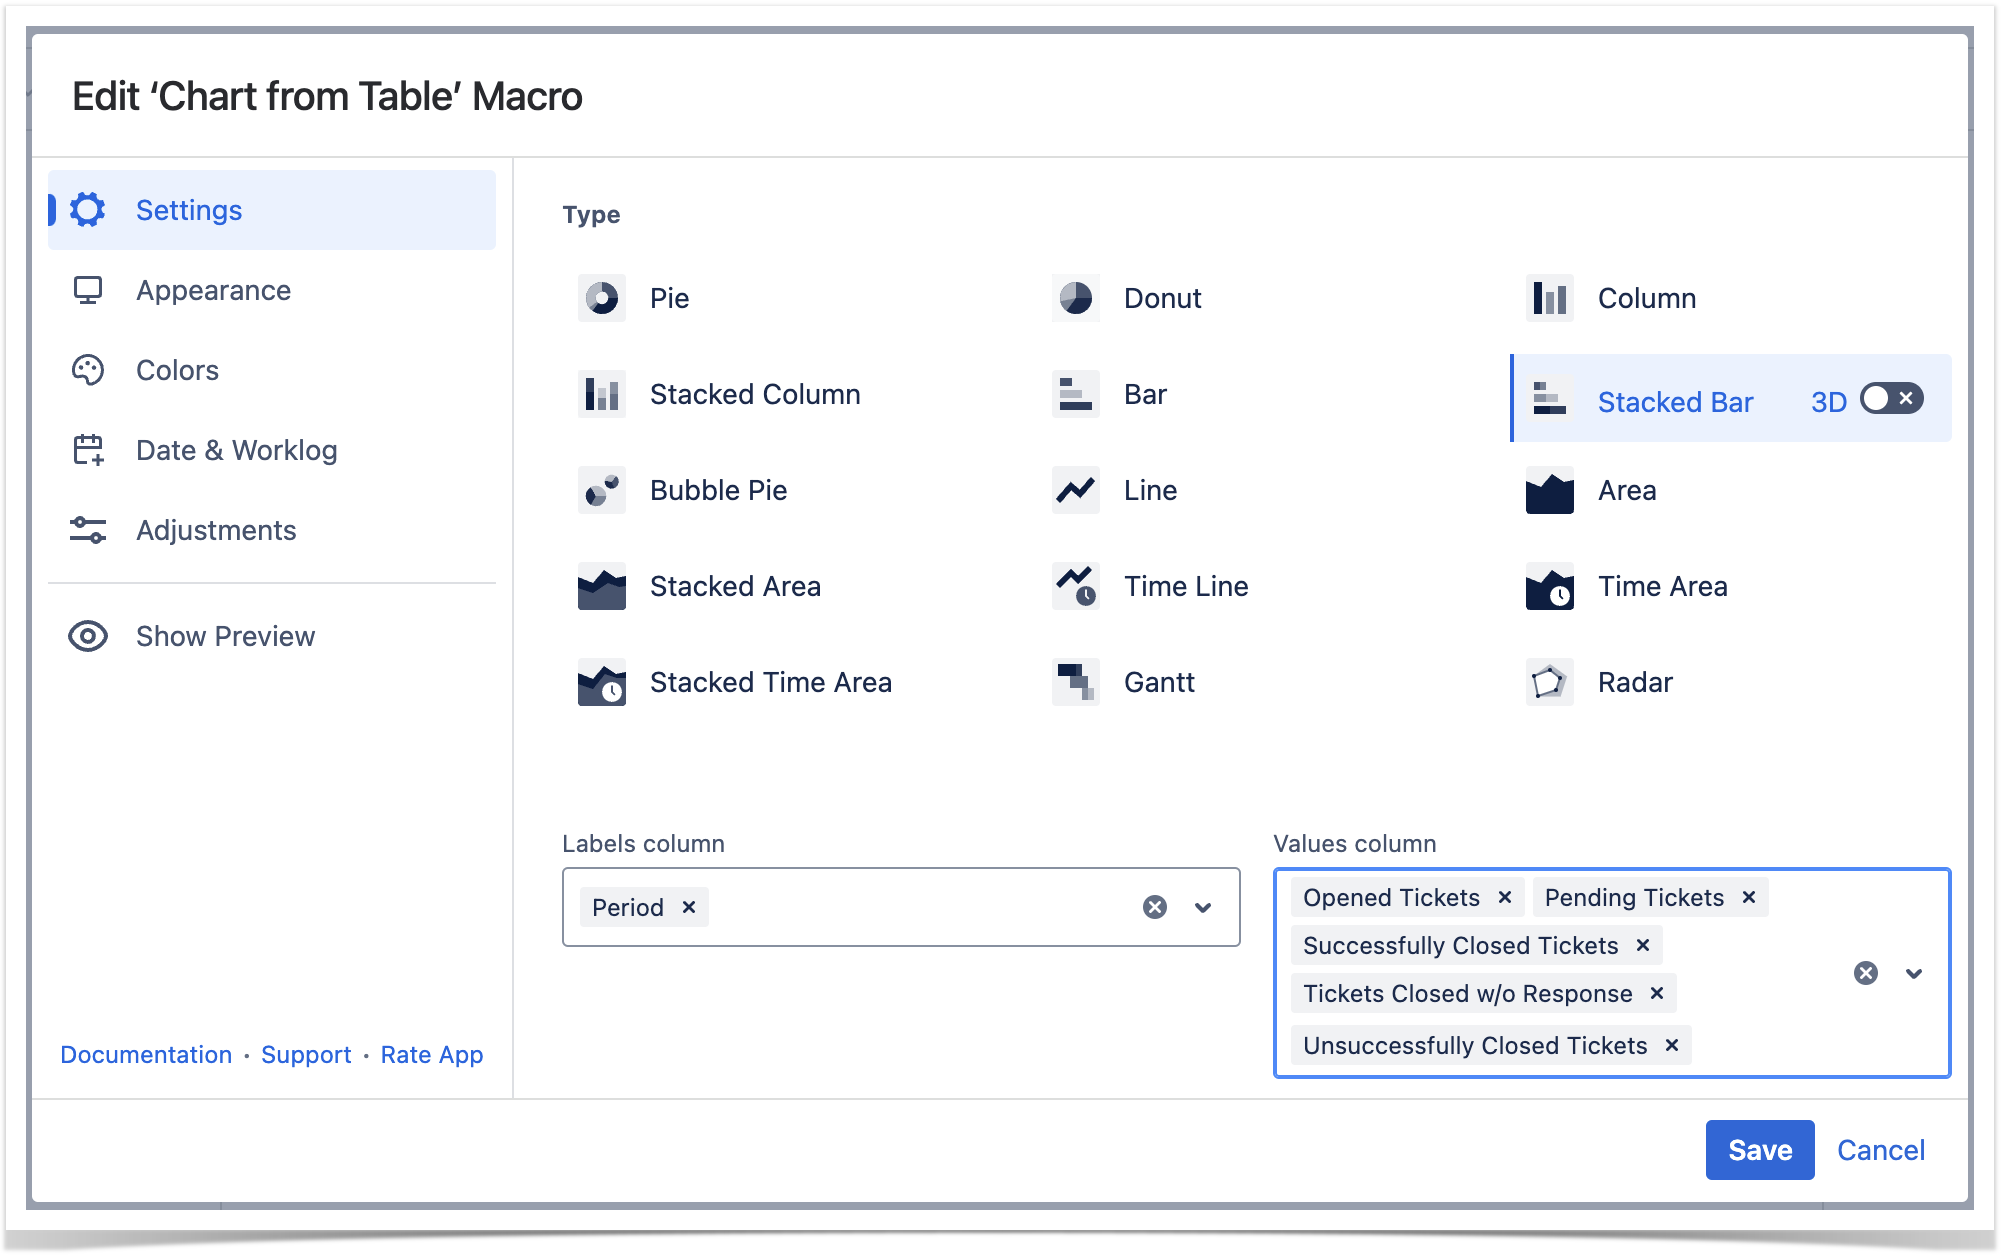
- Locate the the Labels column and and Values column options options in the Settings tab and select the table columns containing data for chart generation.
- Save the macro and the page.
| Handy Carousel | ||
|---|---|---|
| ||
|


Adjustments Tab
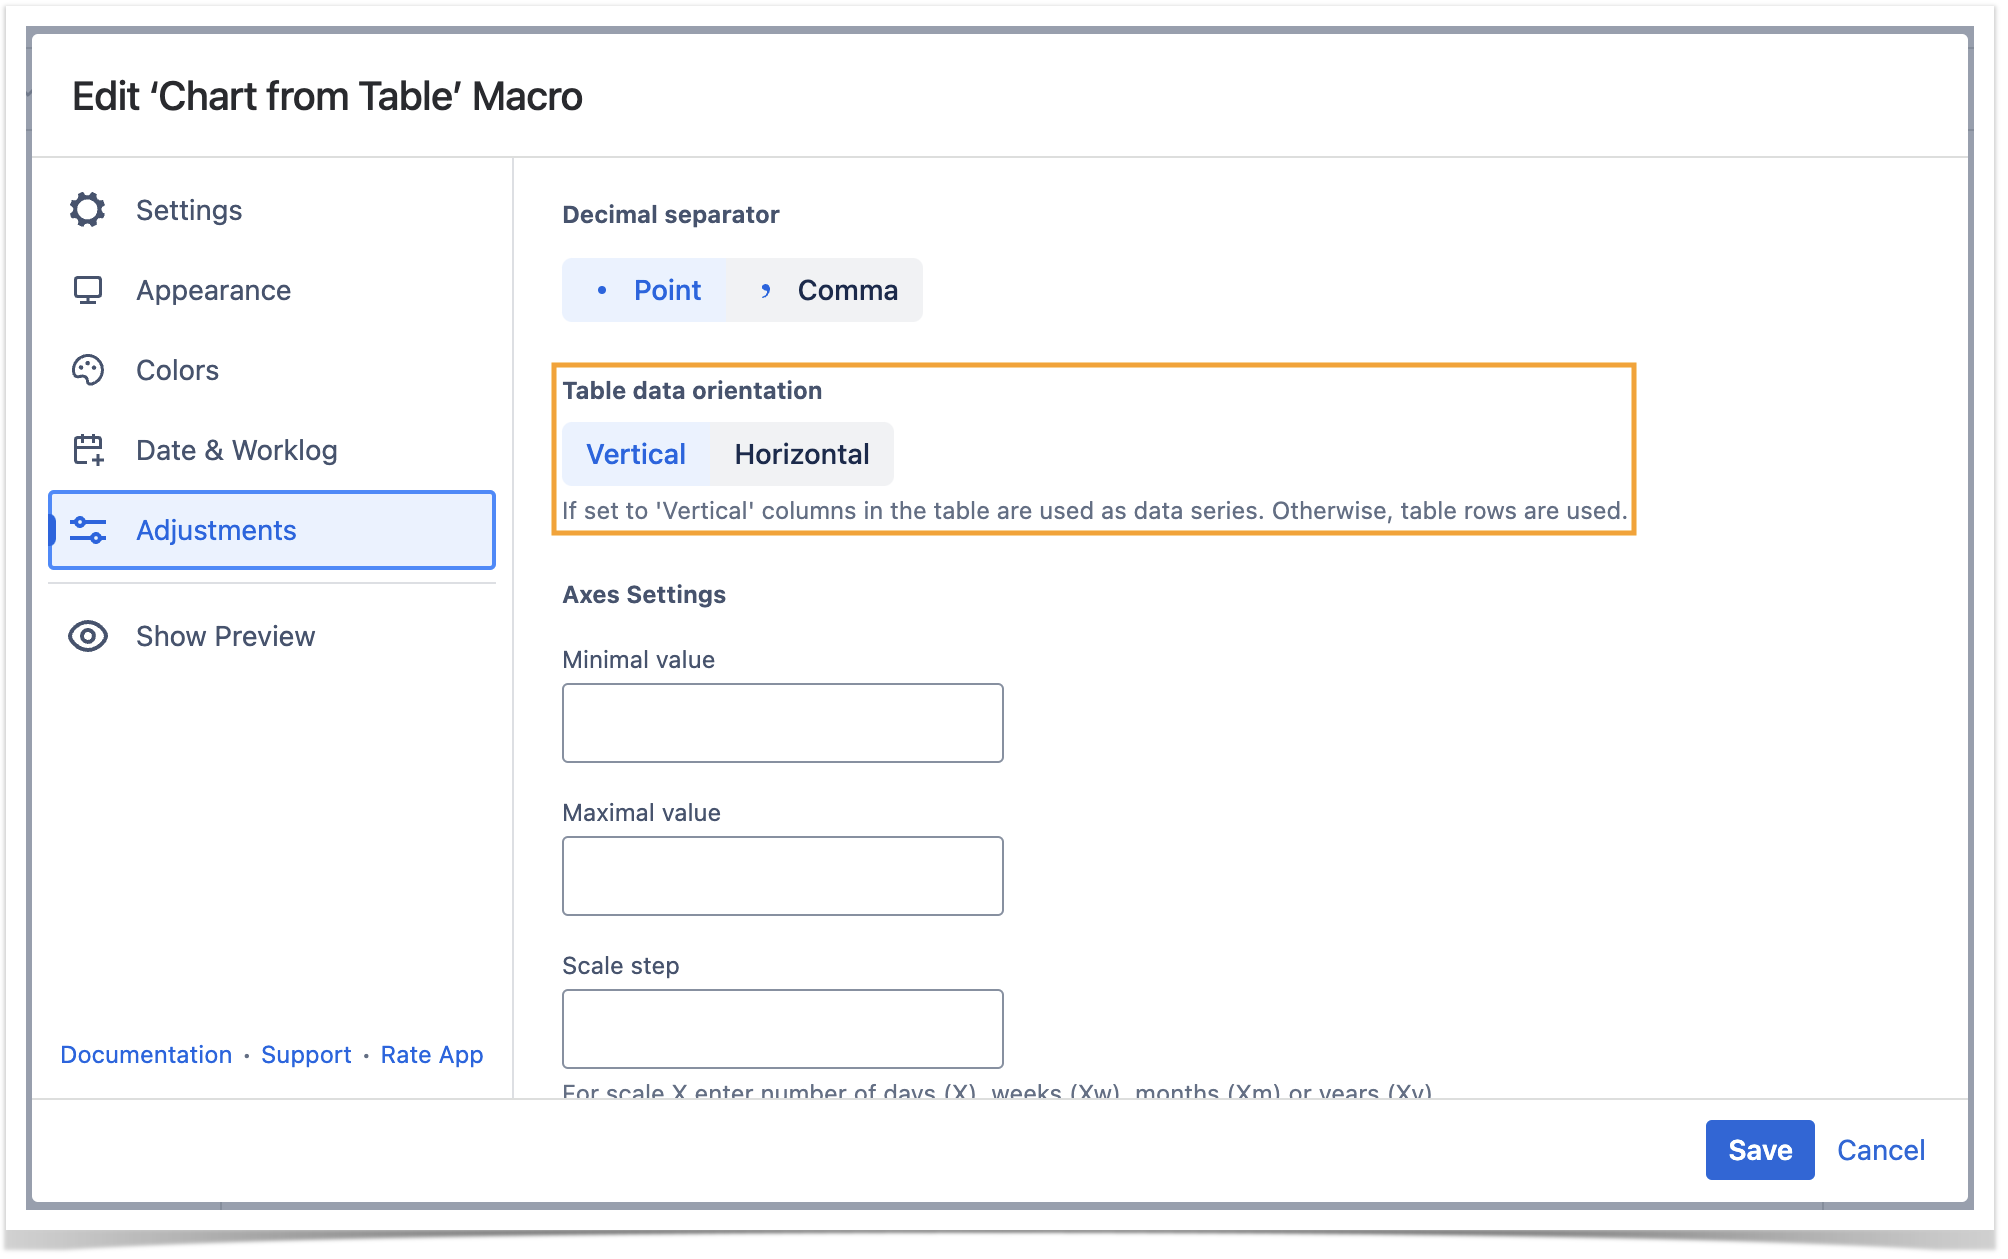
Set the table data orientation

Set the decimal separator
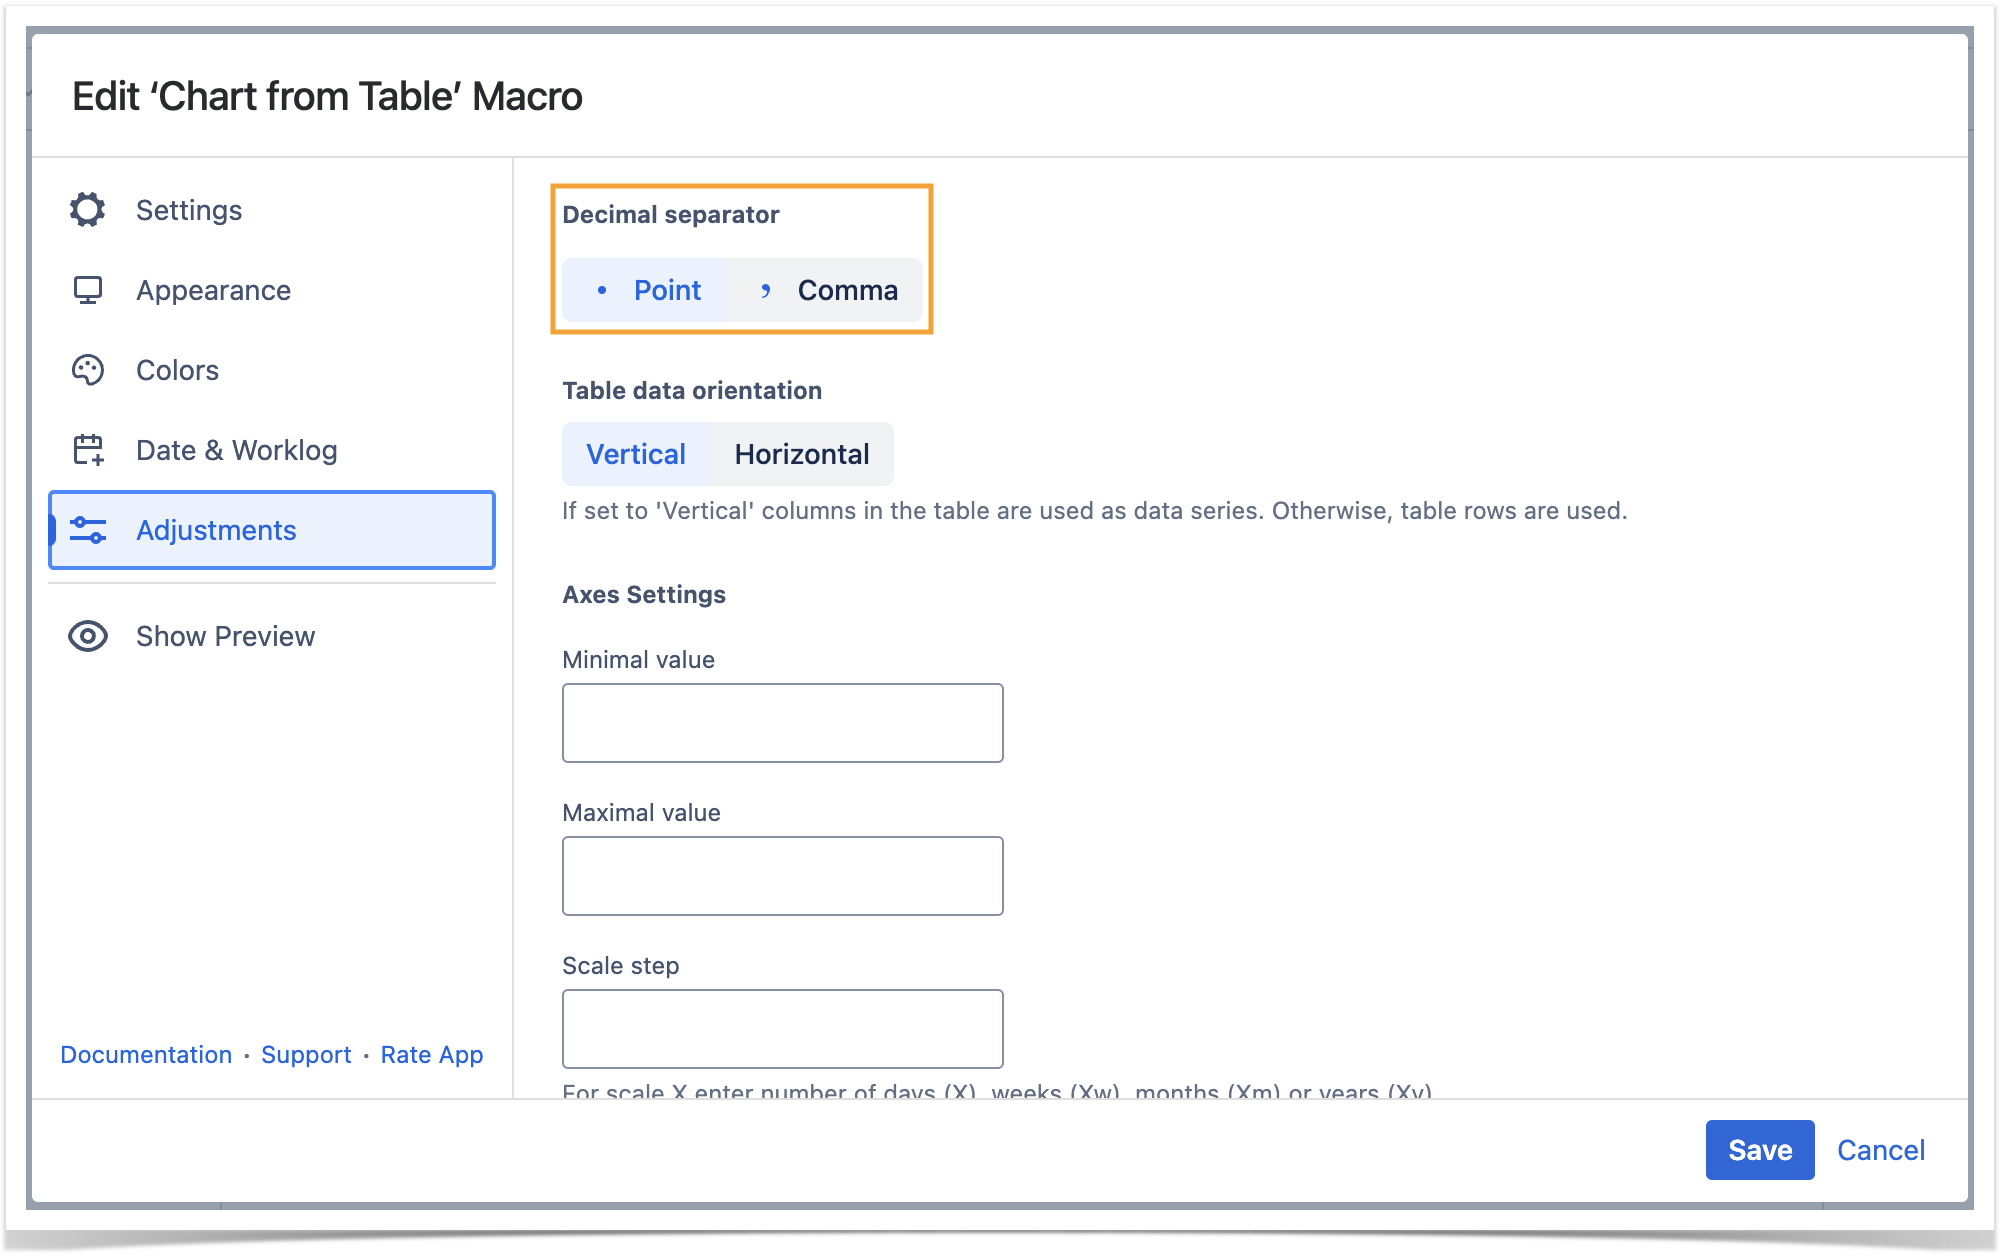
- Switch the page to the edit mode.
- Select the macro and click Edit.
- Switch to the Adjustments tab.
- Locate the Decimal separator option.
- Specify the correct decimal separator for numeric values in the source table (point or comma).
- Save the macro and the page.

Set the
worklog settingstable data orientation
- Switch the page to the edit mode.
- Select the macro and click Edit.
- Switch to the Adjustments tab.Click the
- Set worklog settings buttonLocate the Table data orientation option.
- In the opened form, define the worklog parameters, as follows:
- Days in week - enter the number of business days in a week.
- Hours in day - enter the number of working hours in one business day.
- Time format - select the used time format in worklog values.
- Week shortening - enter the shortening for the week time unit if you use any language different from English.
- Day shortening - enter the shortening for the day time unit if you use any language different from English.
- Hour shortening - enter the shortening for the hour time unit if you use any language different from English.
- Minute shortening - enter the shortening for the minute time unit if you use any language different from English.
- Select the Vertical or Horizontal option.
- Save the macro and the page.
| Info |
|---|
| Worklog time units in different languages are denoted with different shortenings. Please adjust them according to your JIRA localization settings. |

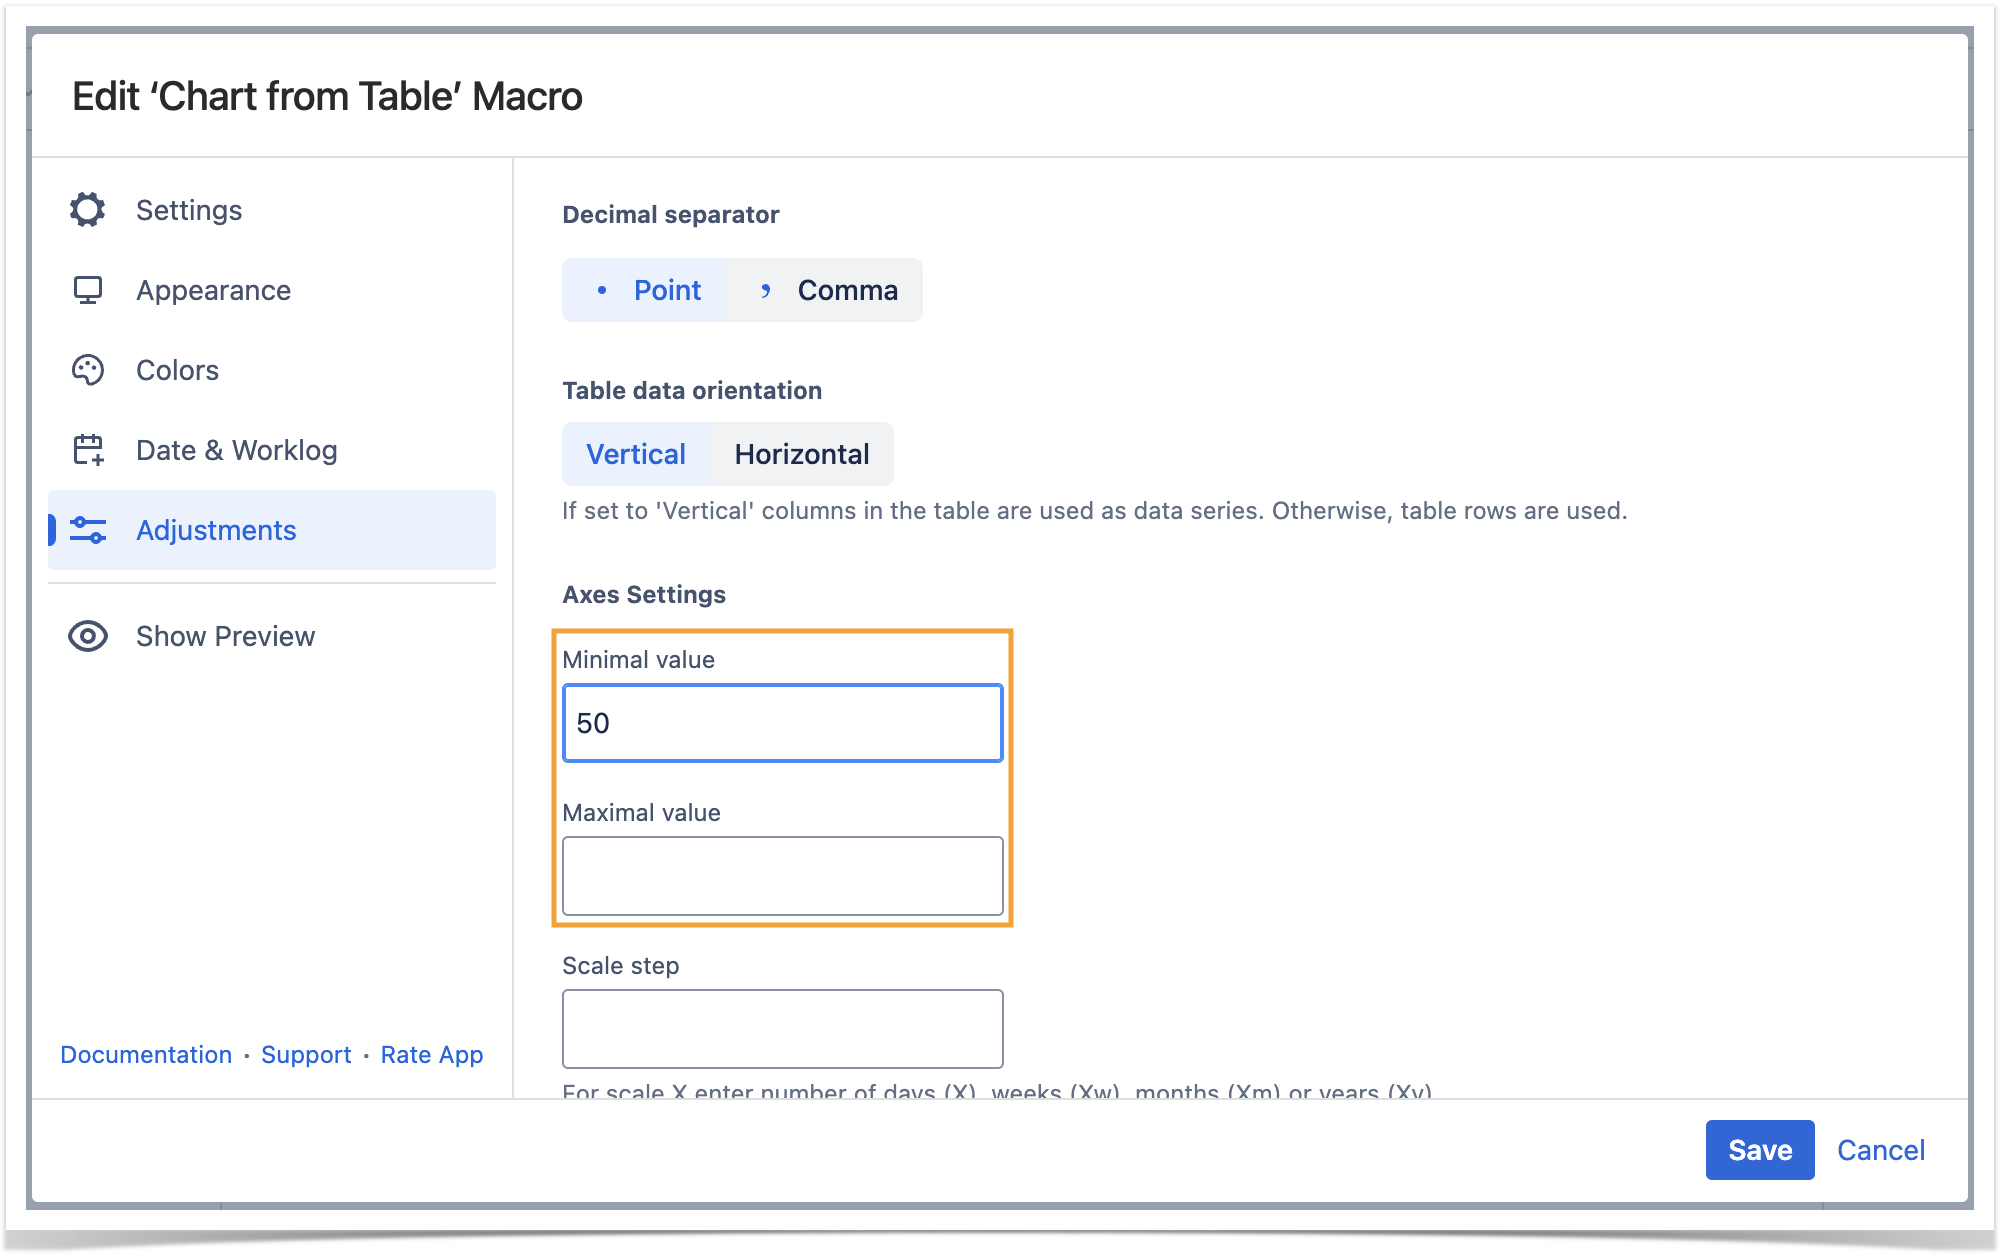
Set the minimal and maximal values
Minimal value - the minimal value for showing only data values greater than the specified minimal value.
Maximal value - You can specify the maximal value for showing only data values not greater than the specified maximal value.
- Switch the page to the edit mode.
- Select the macro and click Edit.
- Switch to the Adjustments tab.
- Locate the the Minimal and Maximal value options and set the values.
- Save the macro and the page.

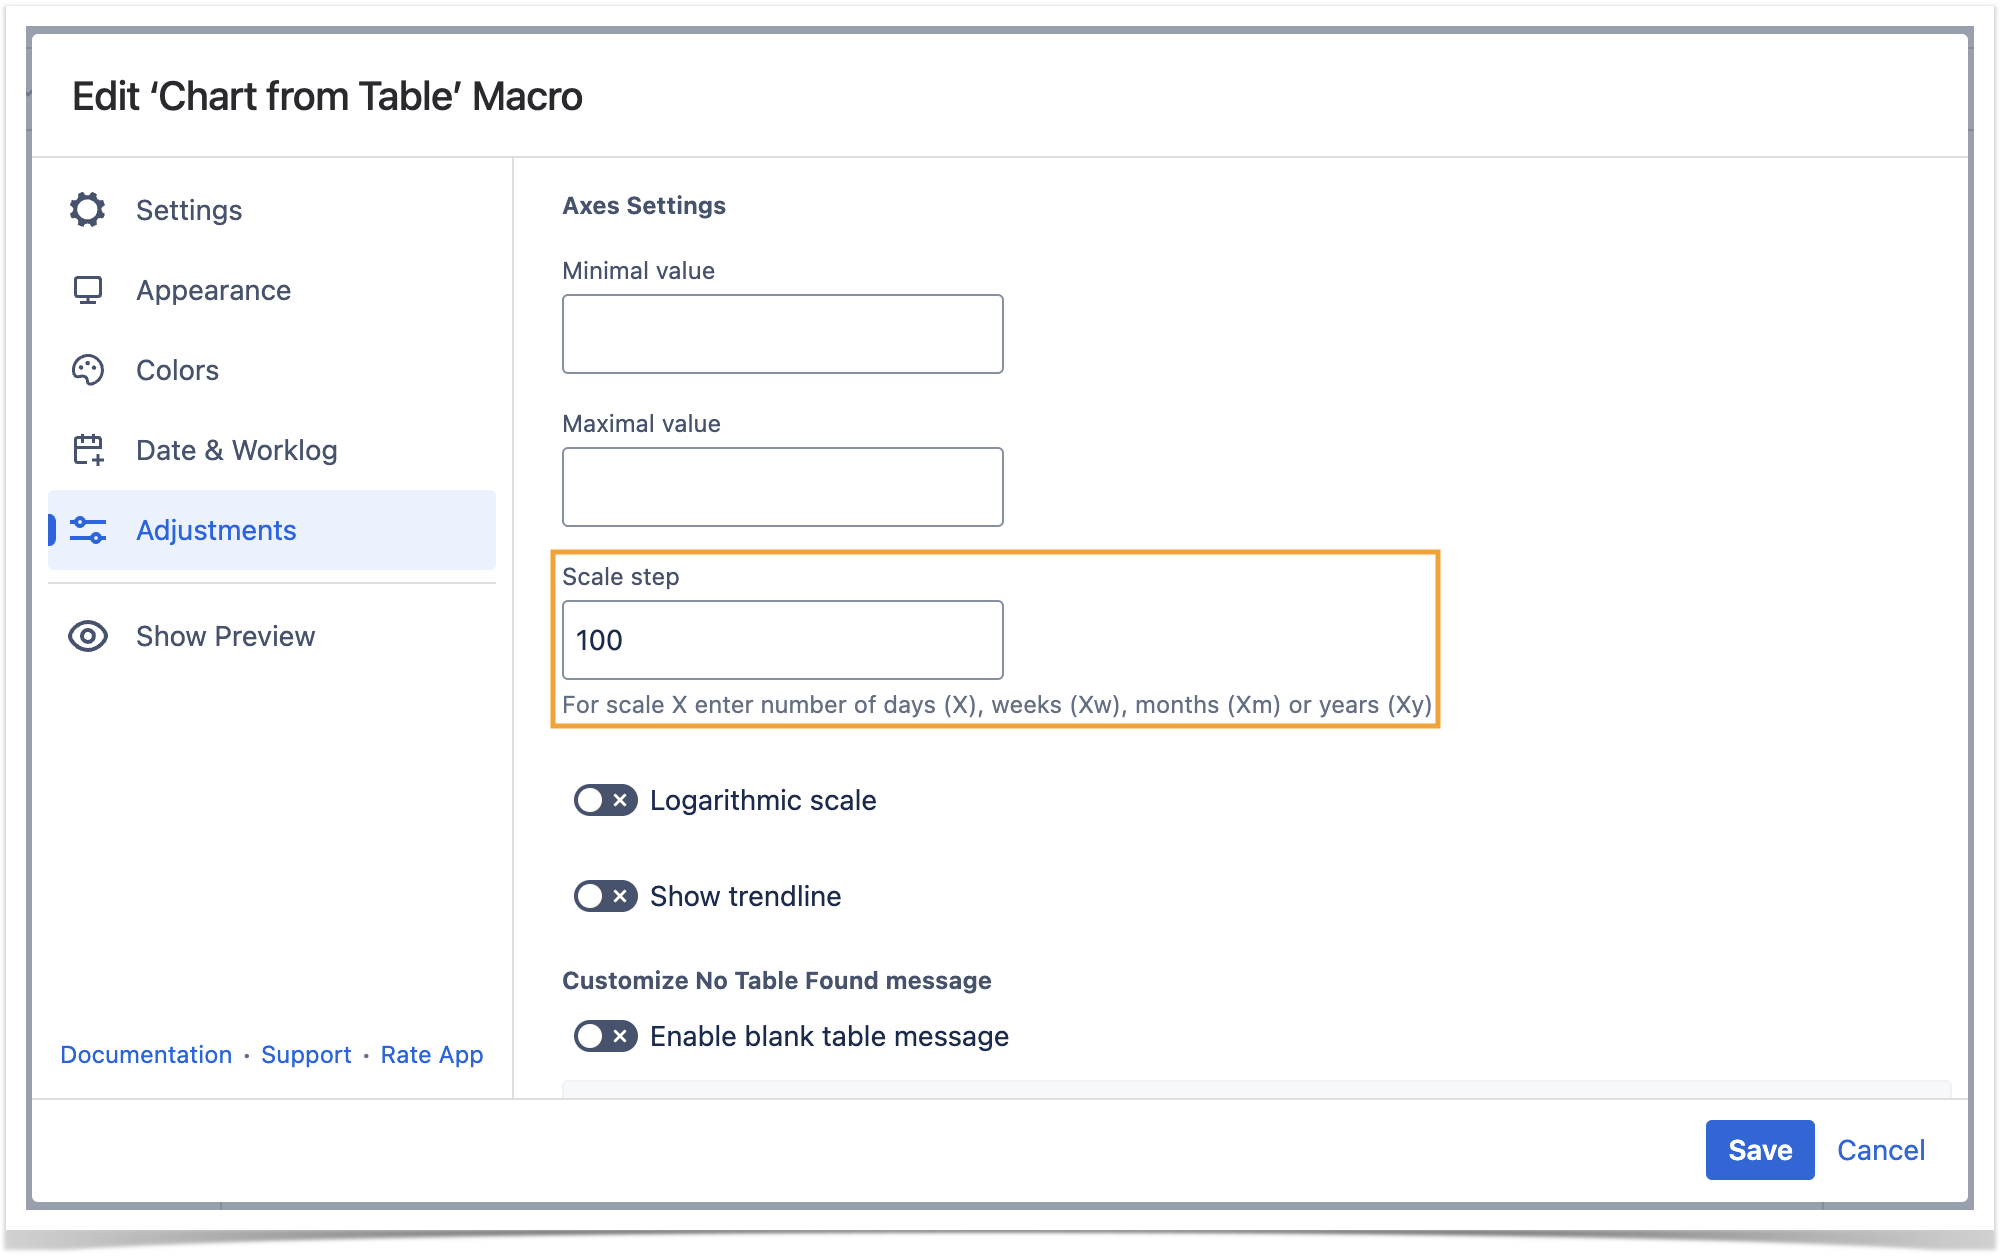
Set the scale step
Scale Step - the required scale step for showing the numeric values in the chart.
- Switch the page to the edit mode.
- Select the macro and click Edit.
- Switch to the Adjustments tab.
- Locate the appropriate option depending on the chart type and set the scale step.
- Save the macro and the page.

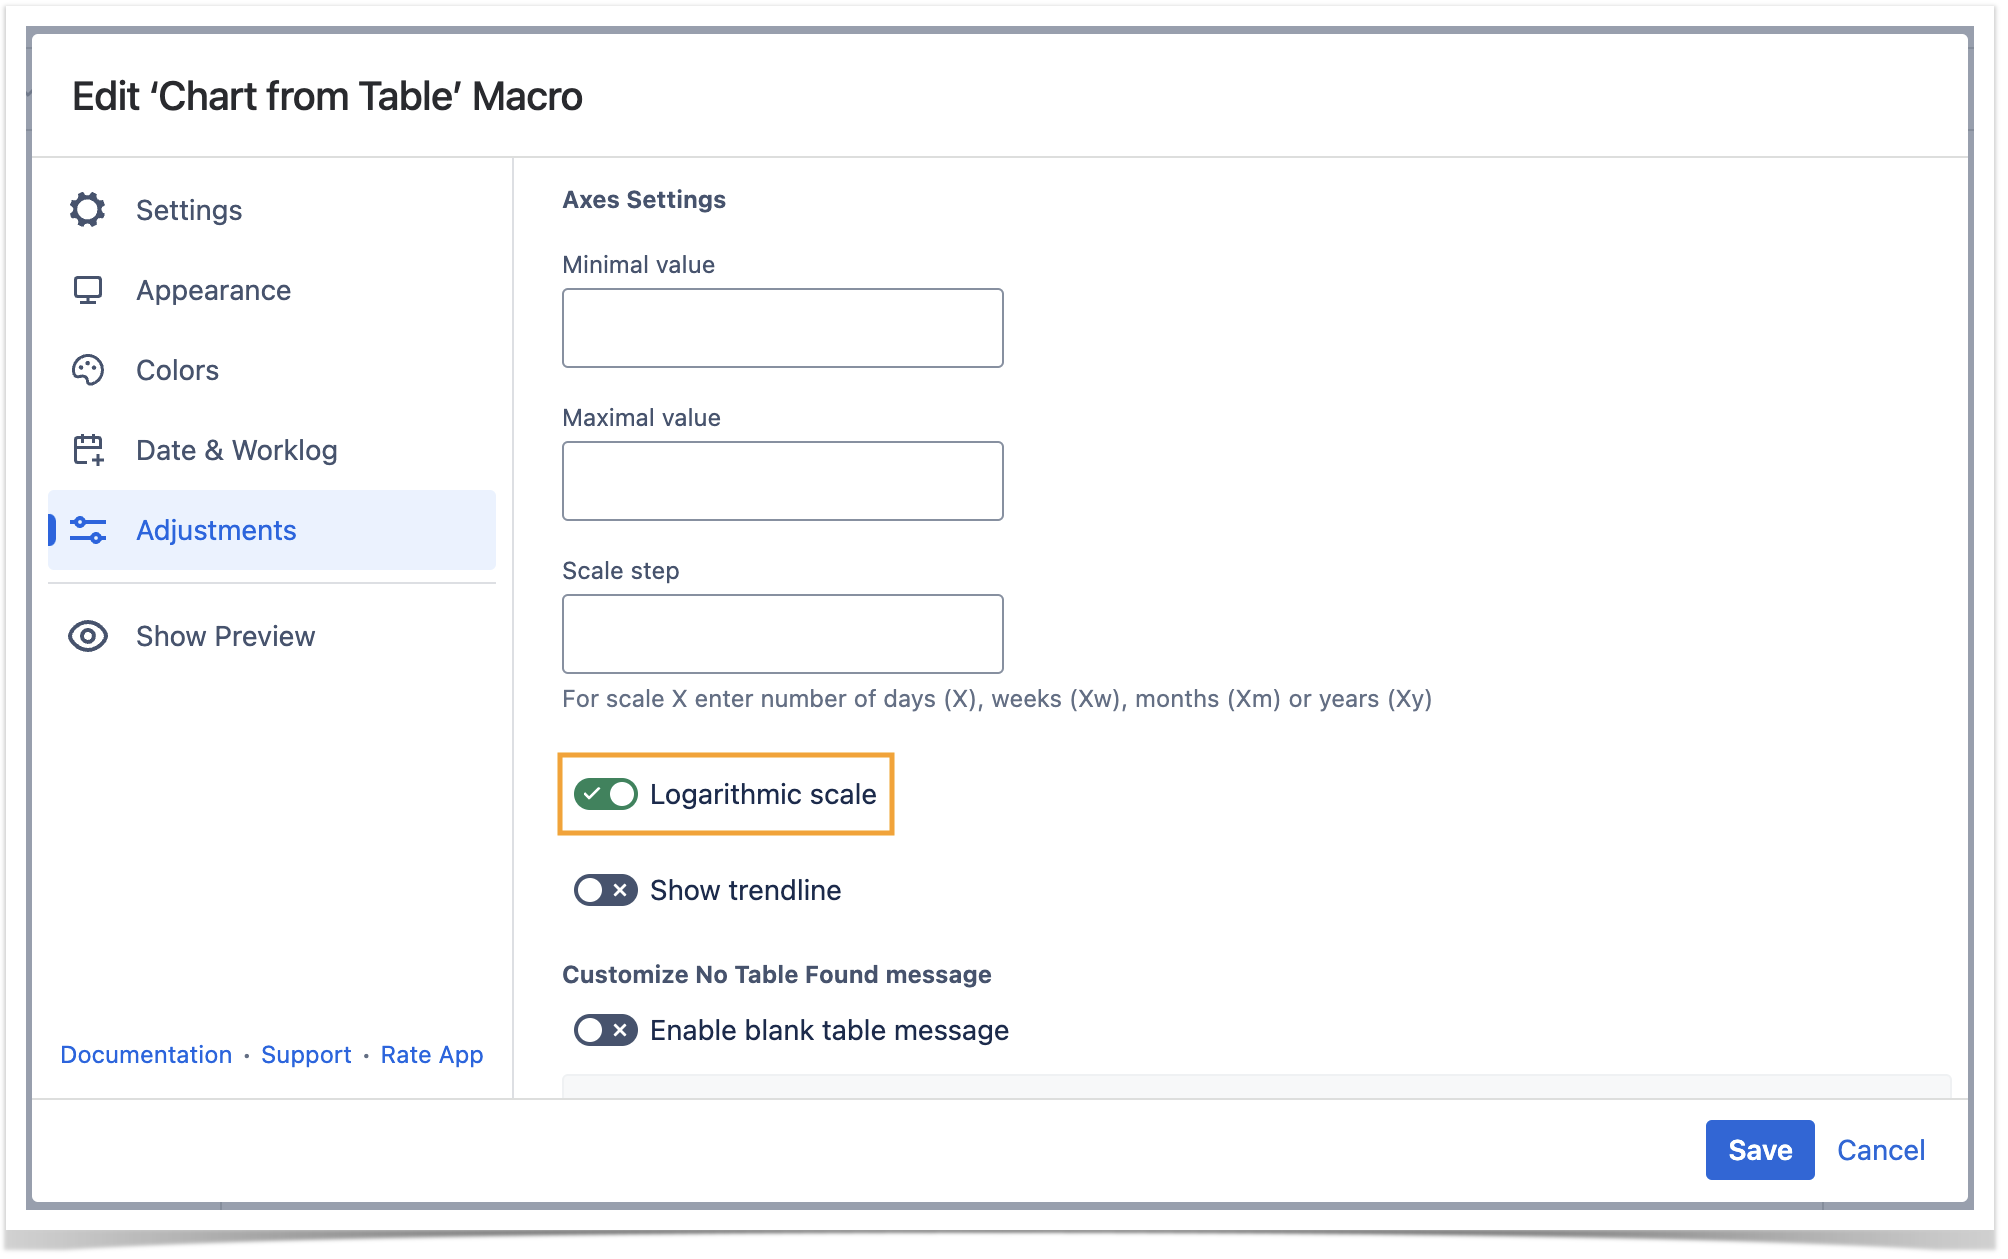
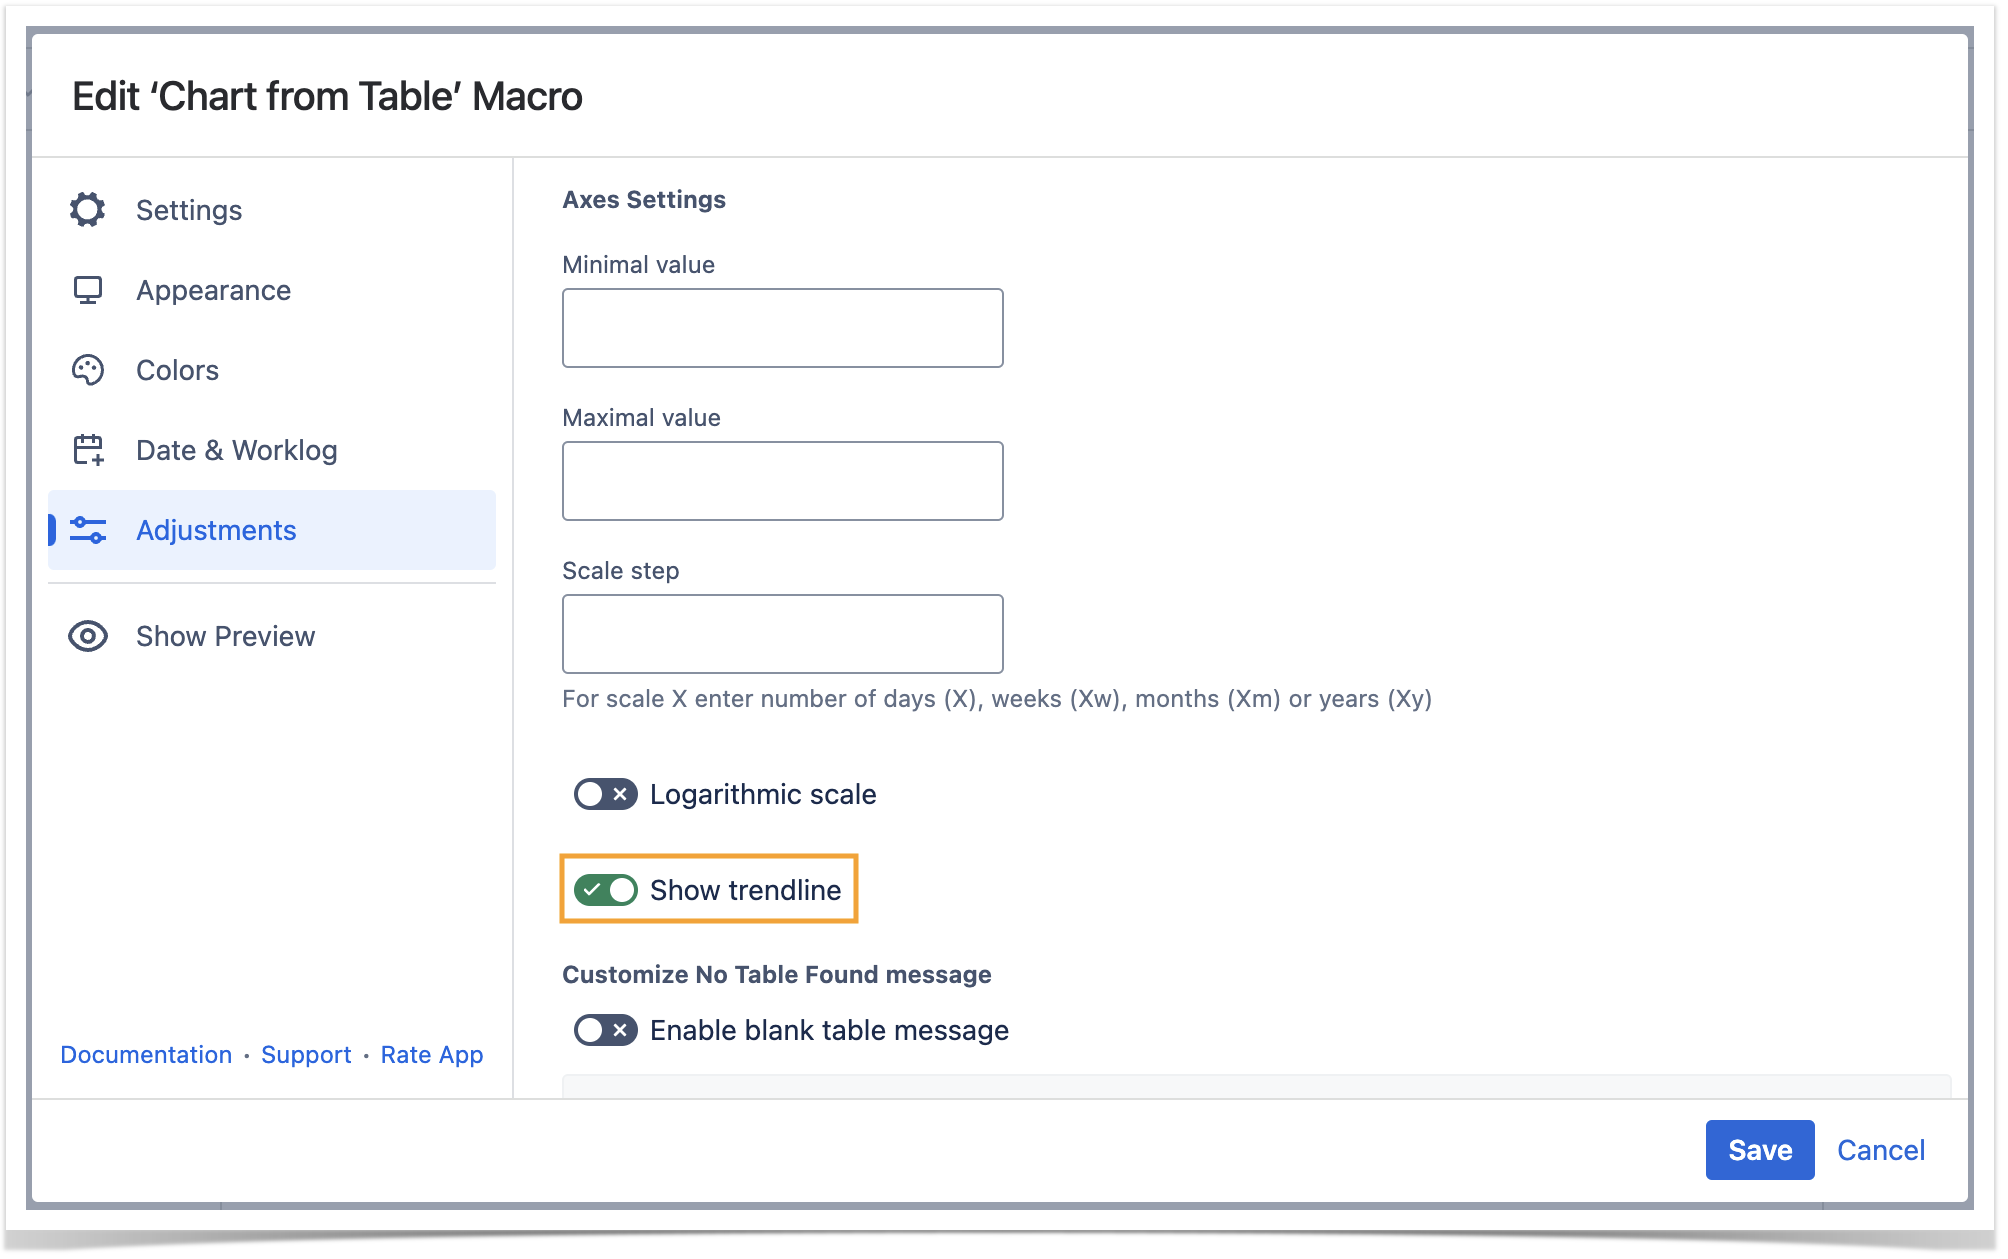
Set the logarithmic scale
Logarithmic Scale - the option for very small or very large numeric values that cannot be properly aligned on the standard arithmetic scale.
- Switch the page to the edit mode.
- Select the macro and click Edit.
- Switch to the Adjustments tab.
- Locate the the Logarithmic Scale option and enable the option.
- Save the macro and the page.

Show trendline
- Switch the page to the edit mode.
- Select the macro and click Edit.
- Switch to the Adjustments tab.
- Locate and enable the Show trendline option.
- Save the macro and the page.
Date & Worklog Tab
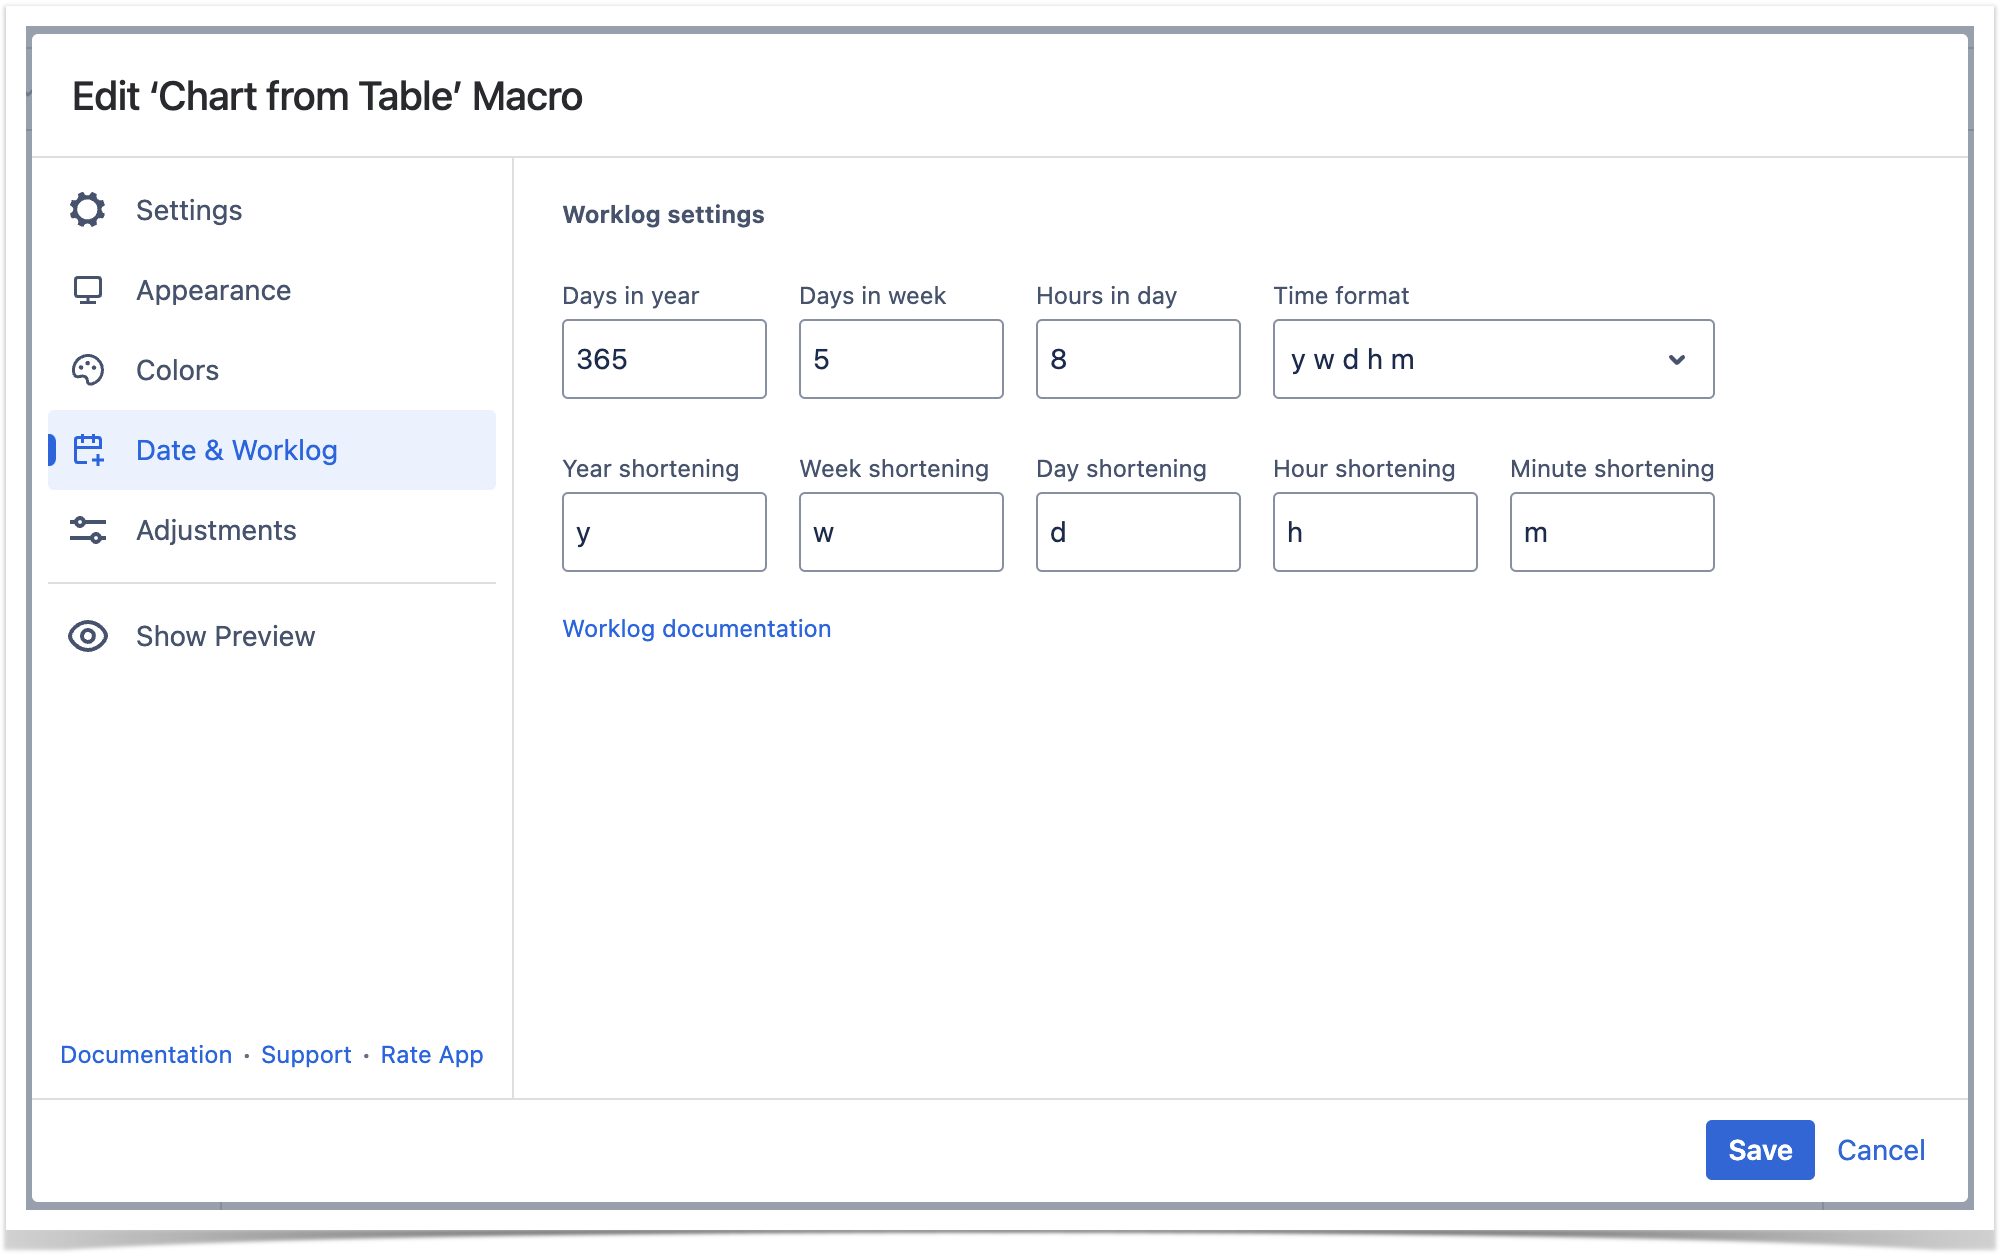
Set the worklog settings
| Info |
|---|
| Please ensure that the worklog parameters set in the macro are identical to parameters configured in Atlassian JIRA. |
- Switch the page to the edit mode.
- Select the macro and click Edit.
- Switch to the Date & Worklog tab.
- Locate the Worklog settings option.
- Define the worklog parameters, as follows:
- Days in year - enter the number of days in a year.
- Days in week - enter the number of business days in a week.
- Hours in day - enter the number of working hours in one business day.
- Time format - select the used time format in worklog values.
- Year shortening - enter the shortening for the year time unit if you use any language different from English.
- Week shortening - enter the shortening for the week time unit if you use any language different from English.
- Day shortening - enter the shortening for the day time unit if you use any language different from English.
- Hour shortening - enter the shortening for the hour time unit if you use any language different from English.
- Minute shortening - enter the shortening for the minute time unit if you use any language different from English.
- Save the macro and the page.
| Info |
|---|
| Worklog time units in different languages are denoted with different shortenings. |

| Please adjust them according to your JIRA localization settings. |
Appearance
LookTab
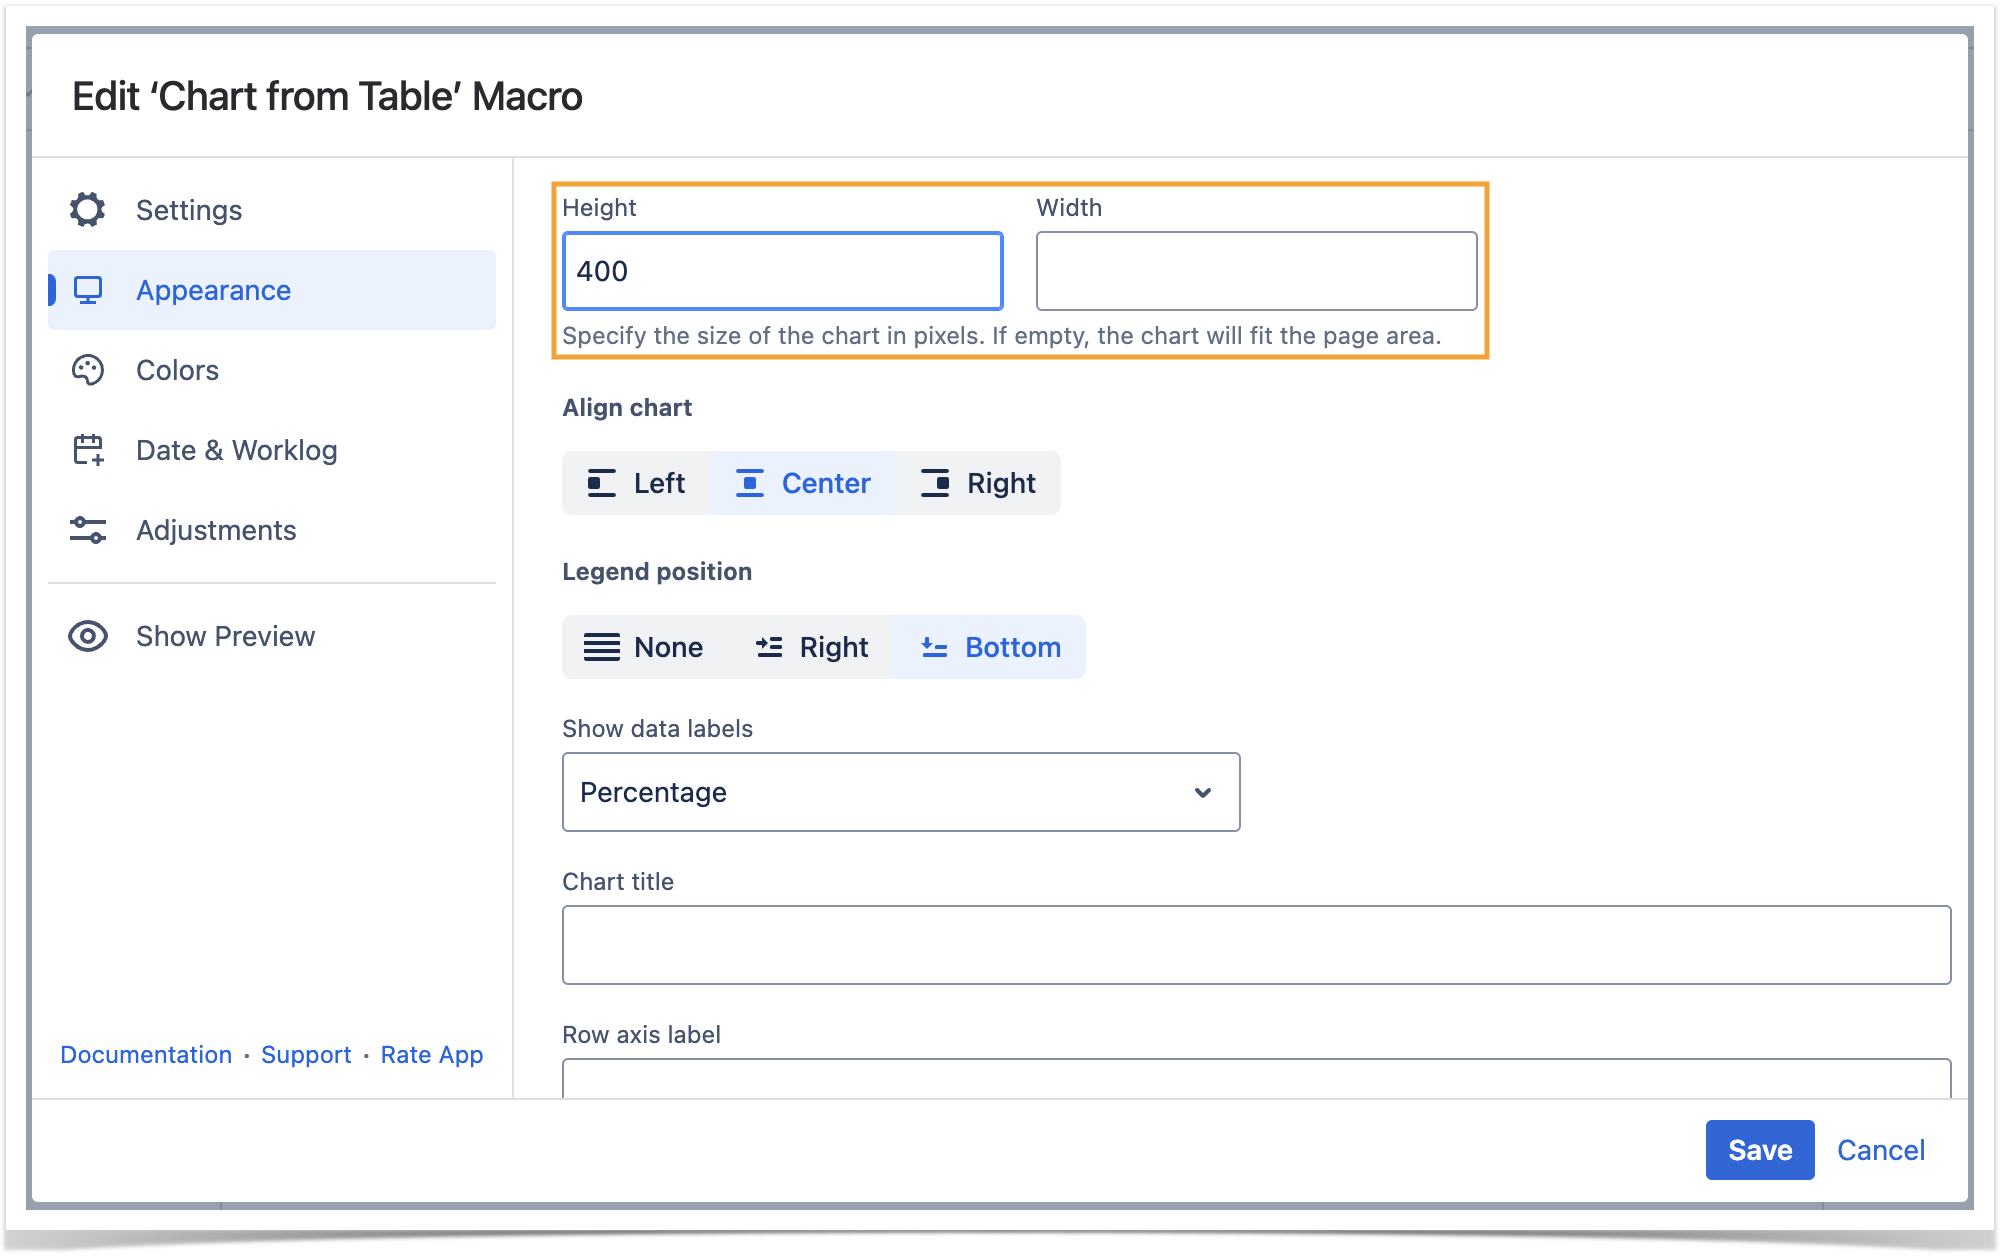
Set the height and width of the chart
- Switch the page to the edit mode.
- Select the macro and click Edit.
- Switch to the LookAppearance tab.
- Locate the Height and Width fields.
- Enter the appropriate dimensions of the chart.
Save the macro and the page.
| Info |
|---|
To set the Height and Width of the chart in the page view mode:
|
| Handy Carousel | ||
|---|---|---|
| ||

|

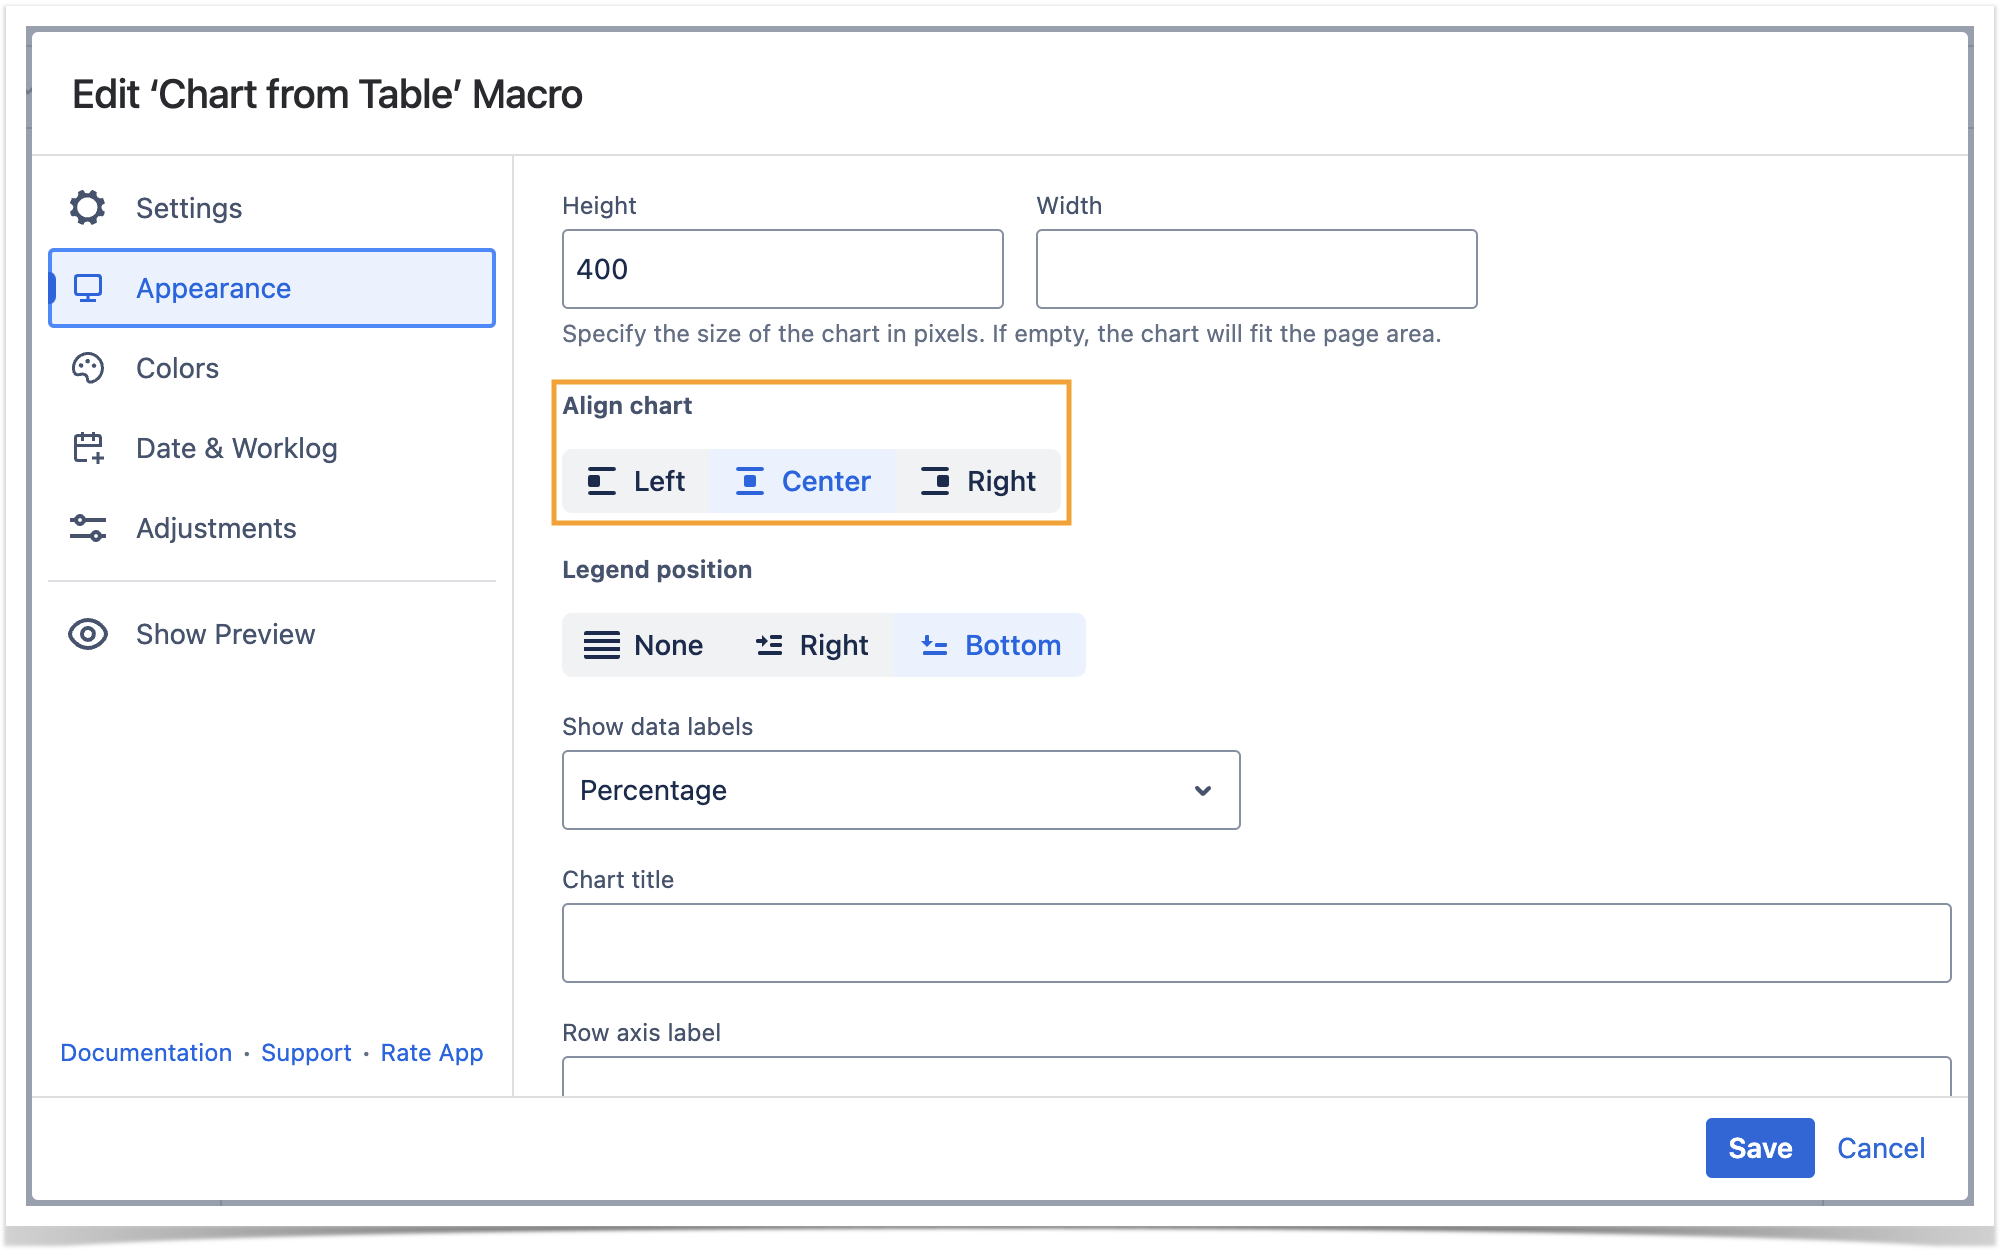
Align chart
- Switch the page to the edit mode.
- Select the macro and click Edit.
- Switch to the LookAppearance tab.
- Locate the Select colors button and click itAlign chart option.
- Select the appropriate colors for each label.
- To set individual column colors, locate the Color scheme option.
- chart alignment, as follows:
- Left
- Center
- Right
- Save the macro and the page.
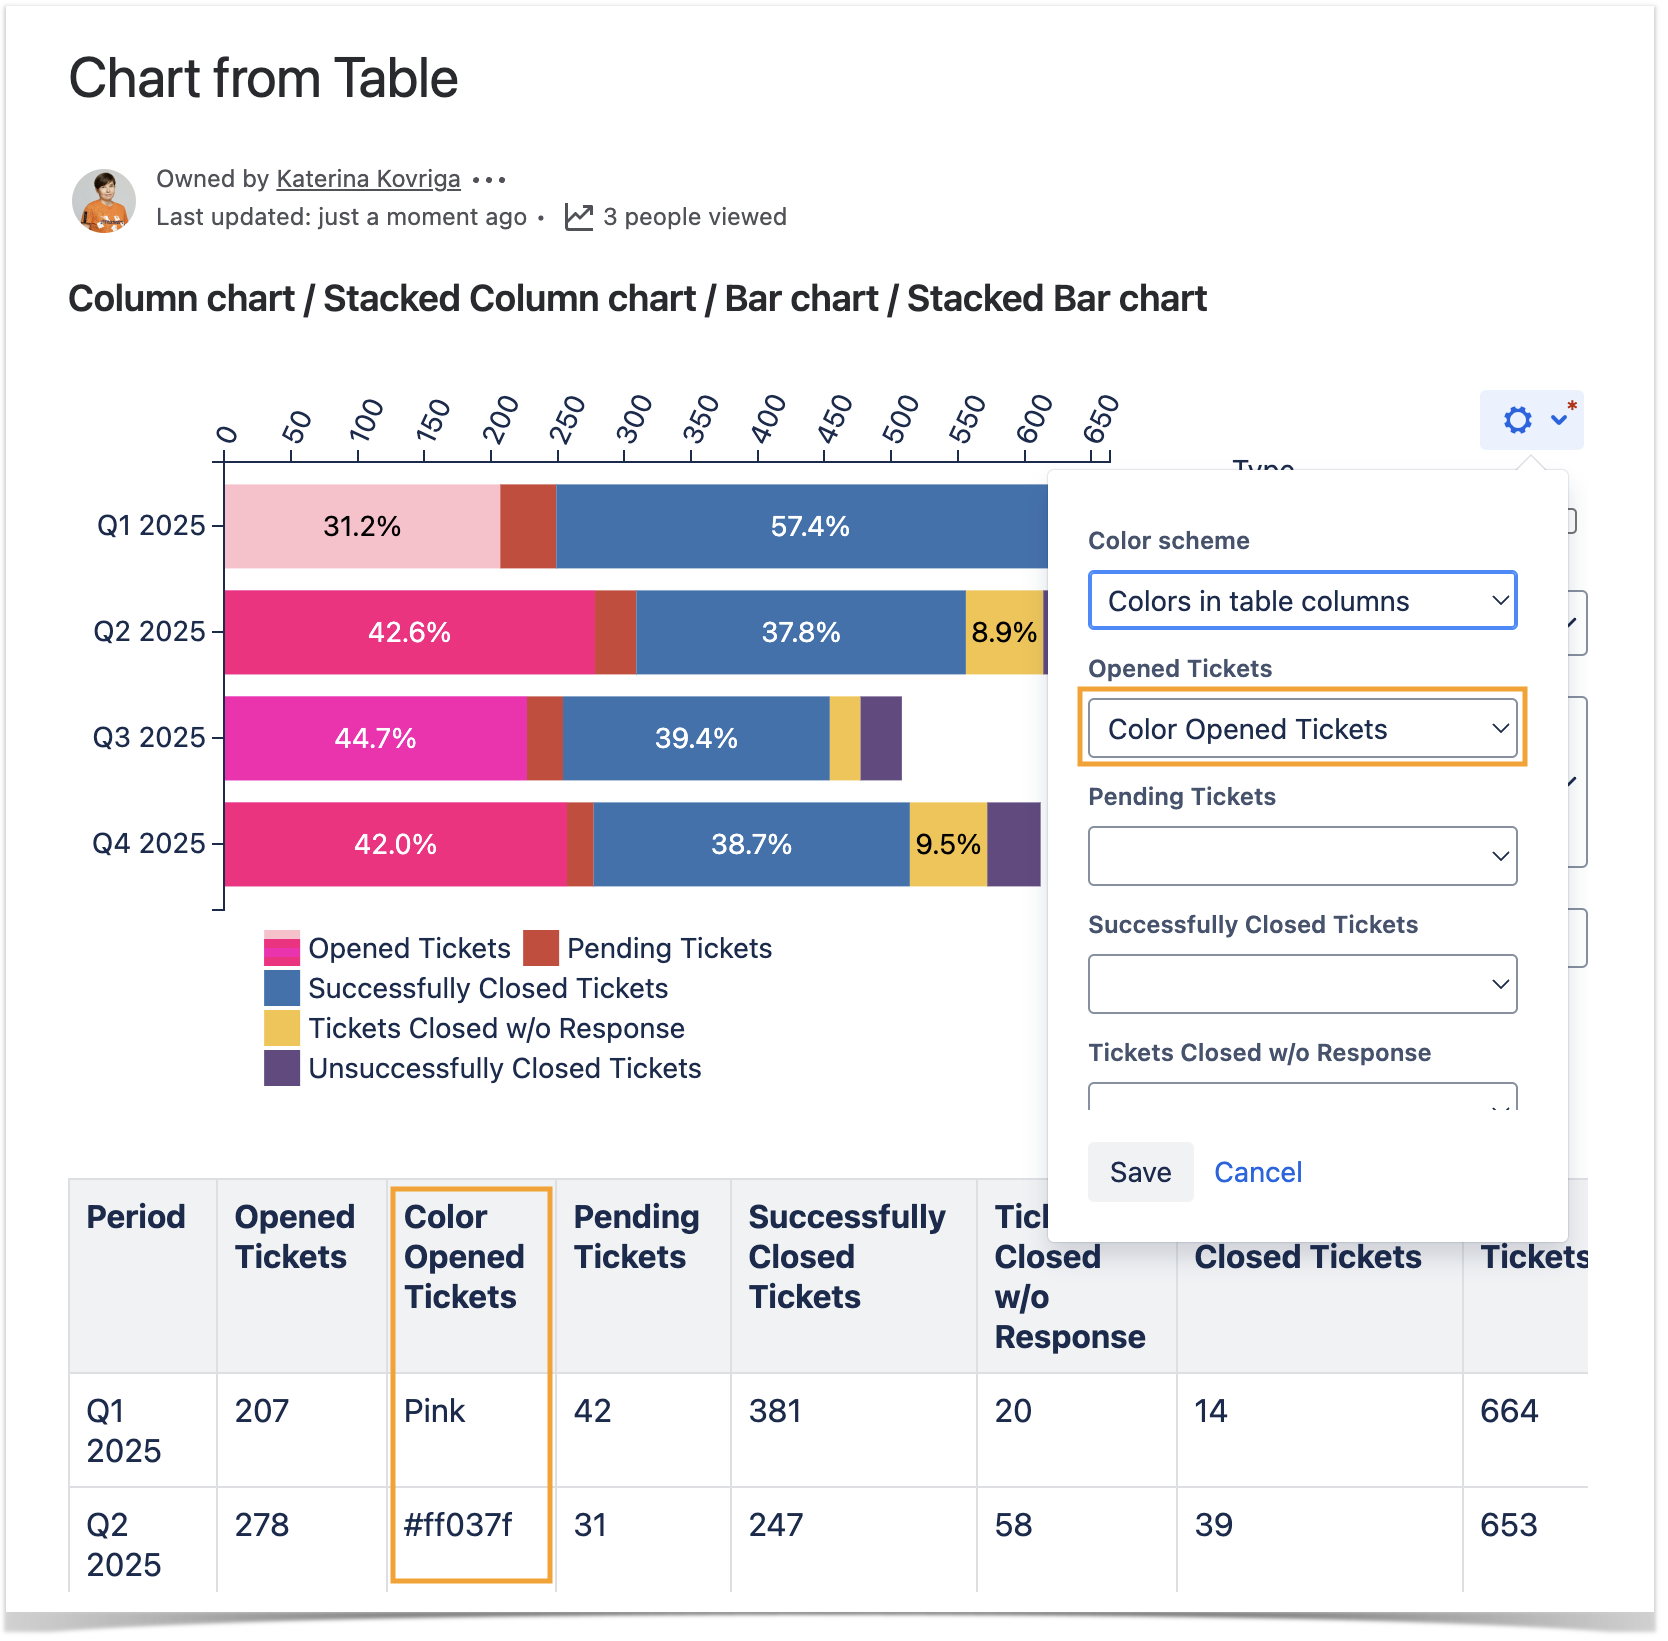
To set the colors in the page view mode:
- Hover over the chart controls on the right of the table.
- Click the cogwheel icon, locate the Select colors option. Select the Multicolor or Colors in the table columns option. Pick the colors or columns with colors and click Apply. The chart will be automatically re-generated.
- To save the modifications in the macro body, click the cogwheel icon and select Save changes .
| Handy Tip | ||
|---|---|---|
| ||
The Multicolor setting enables you to select the appropriate colors for each value of the Label column specified in the data series field of the chart. |
| Handy Tip | ||
|---|---|---|
| ||
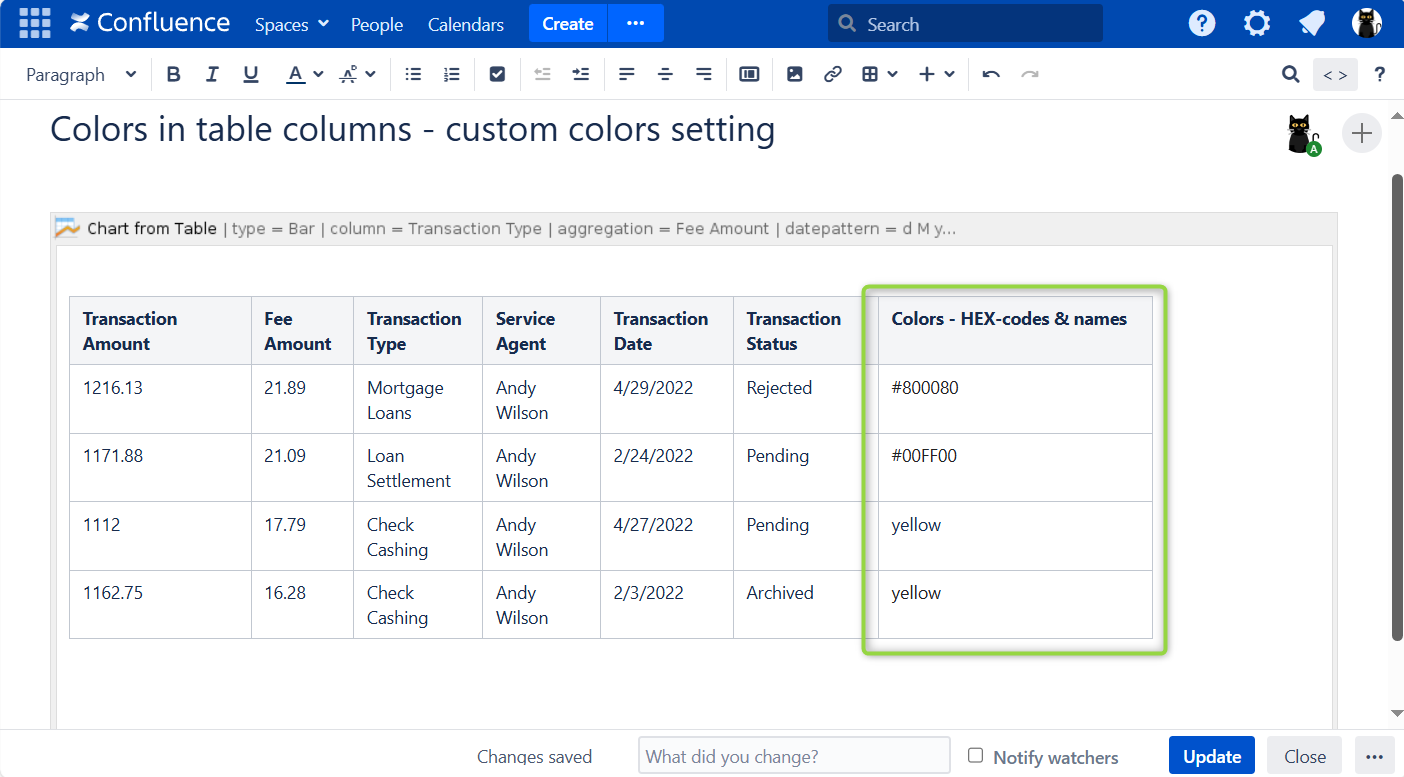
The Colors in the table columns setting enables you to add colors as either its simple name (e.g. green, yellow) or a HEX code (e.g. #808080-> gray) in a separate custom-made column to paint values of the Labels column(-s) specified in the data series field of the chart.
|
| Handy Carousel | ||
|---|---|---|
| ||
|


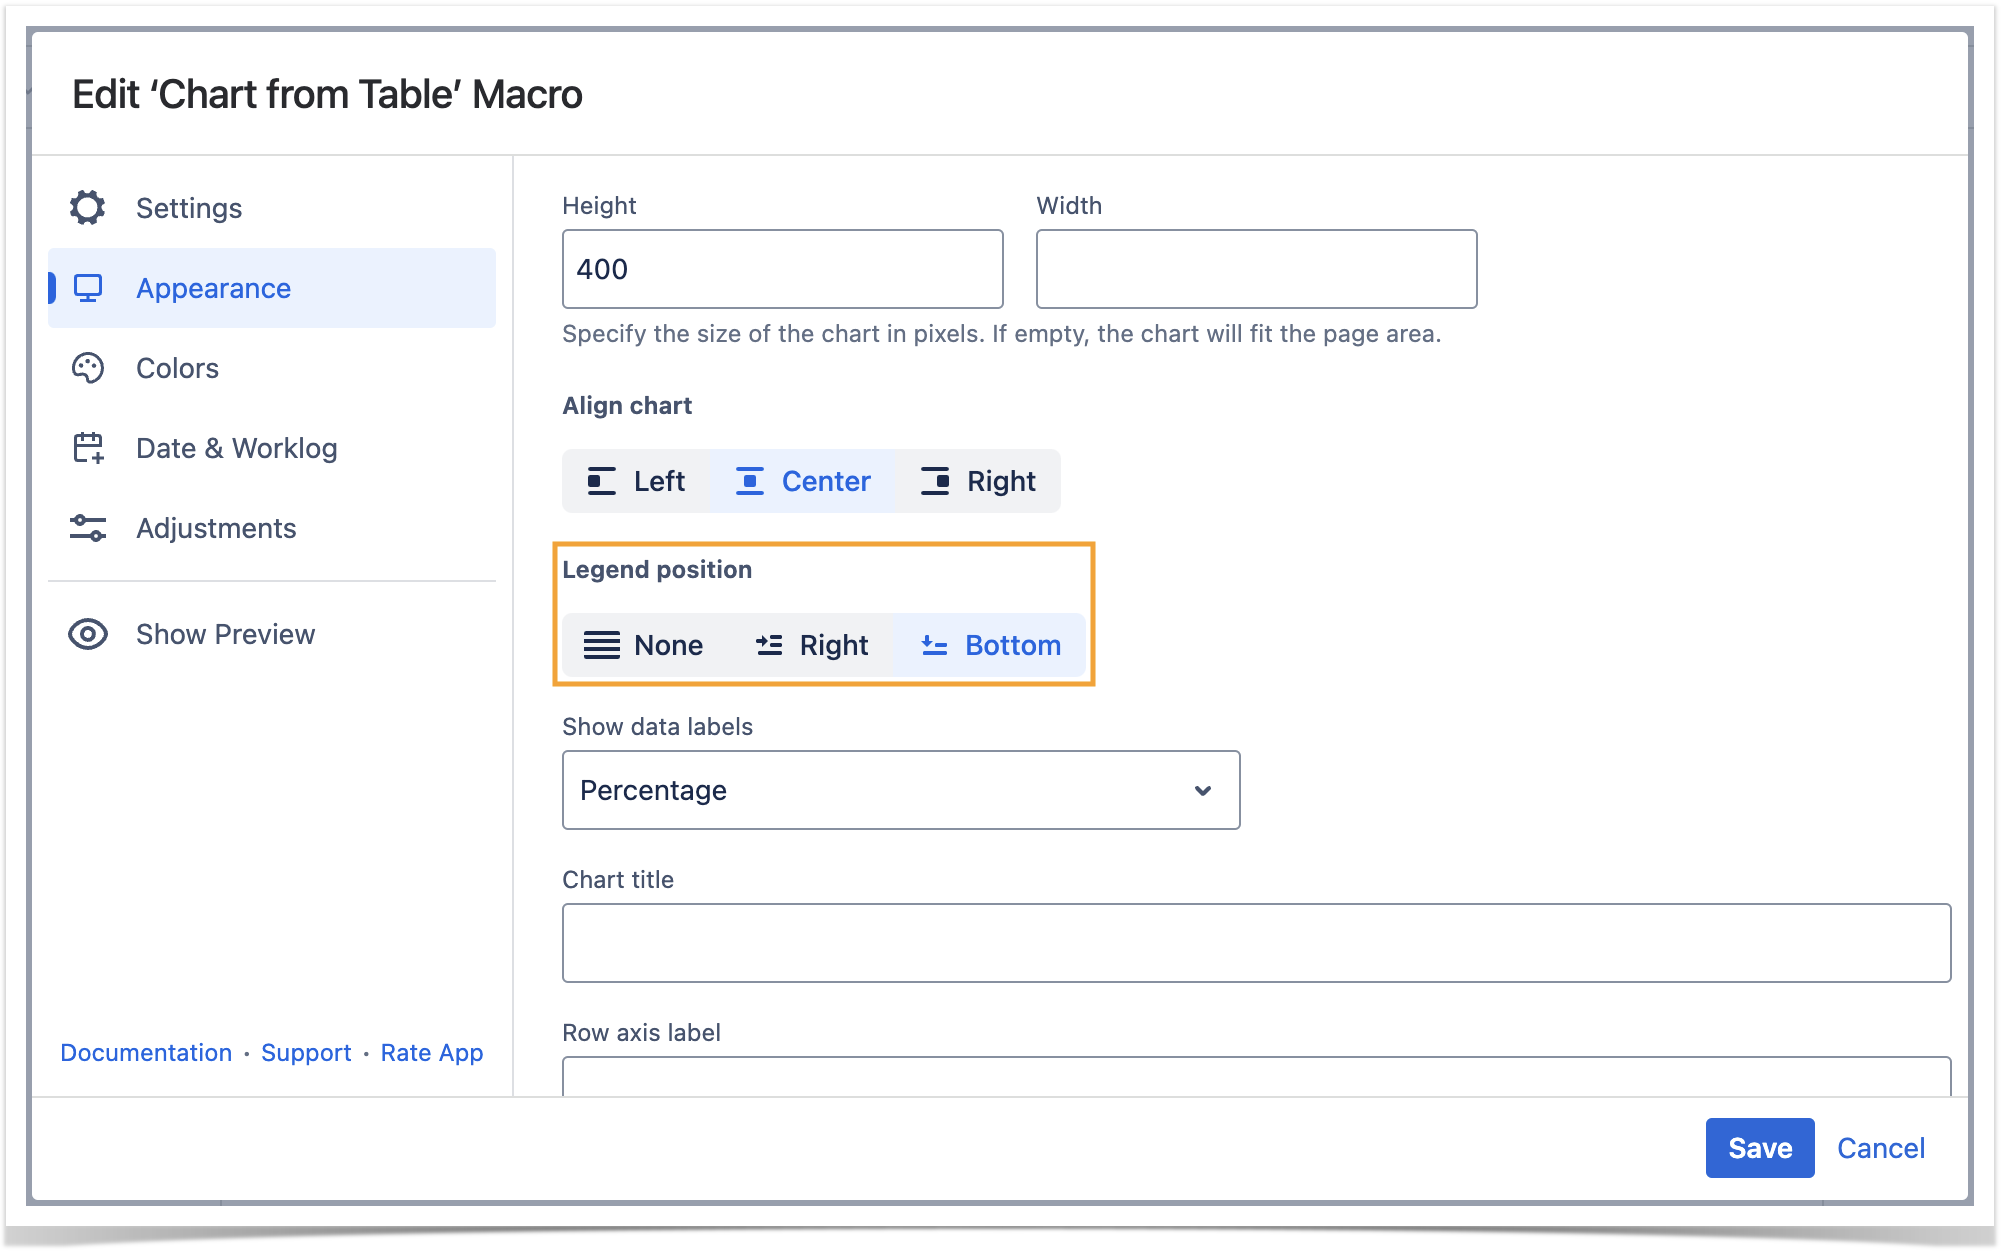
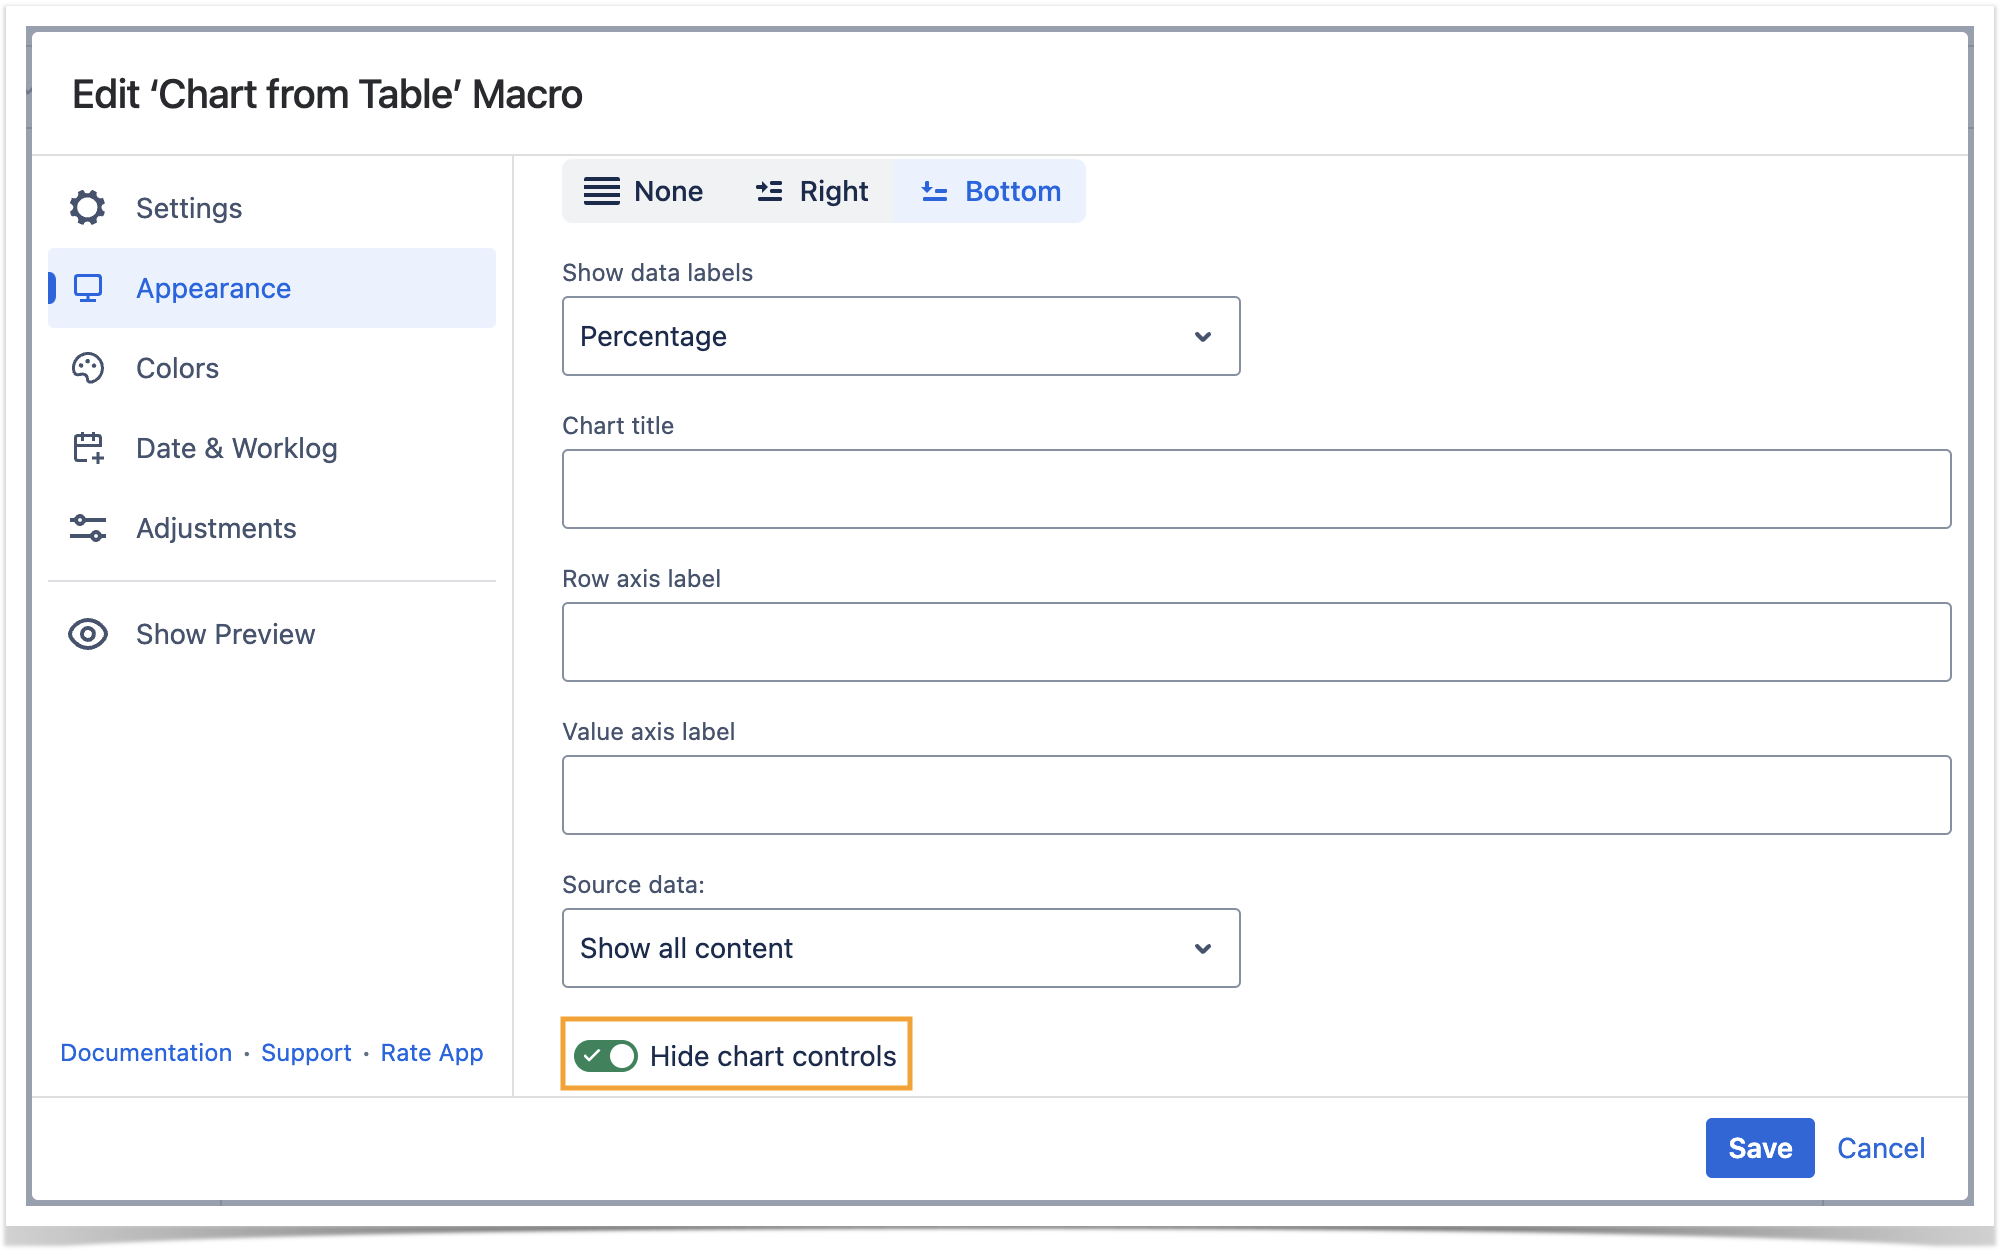
Set the legend position
- Switch the page to the edit mode.
- Select the macro and click Edit.
- Switch to the Appearance tab.
- Locate the Legend Position option.
- Select the appropriate legend position, as follows:
- None
- Right
- Bottom
- Save the macro and the page.
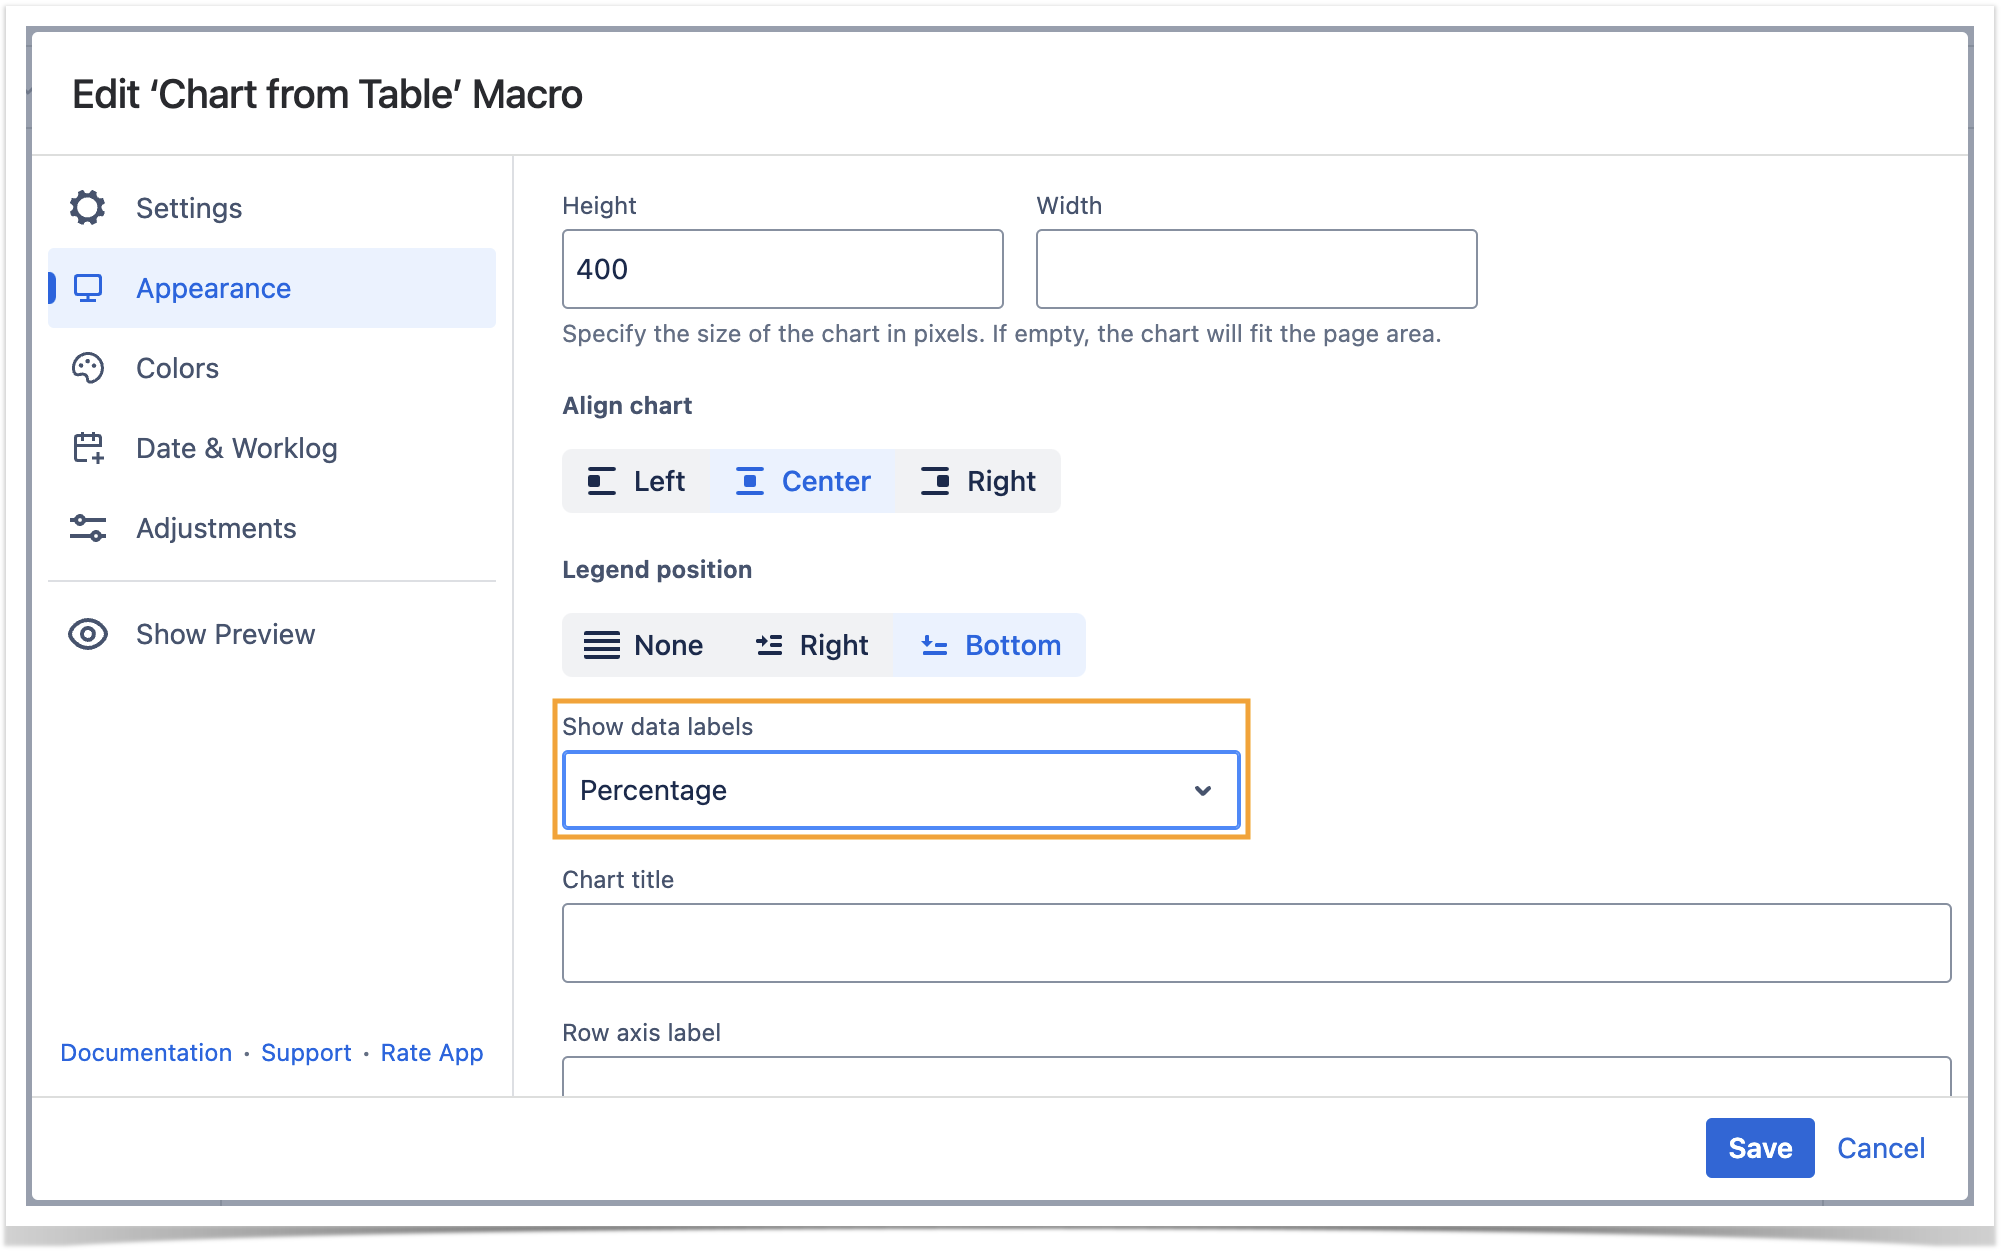
Show data labels
- Switch the page to the edit mode.
- Select the macro and click Edit.
- Switch to the Appearance tab.
- Locate the Show data labels option and select the appropriate option, as follows:
- None
- Value
- Percentage
- Value (Percentage)
- Percentage (Value)
- Save the macro and the page.
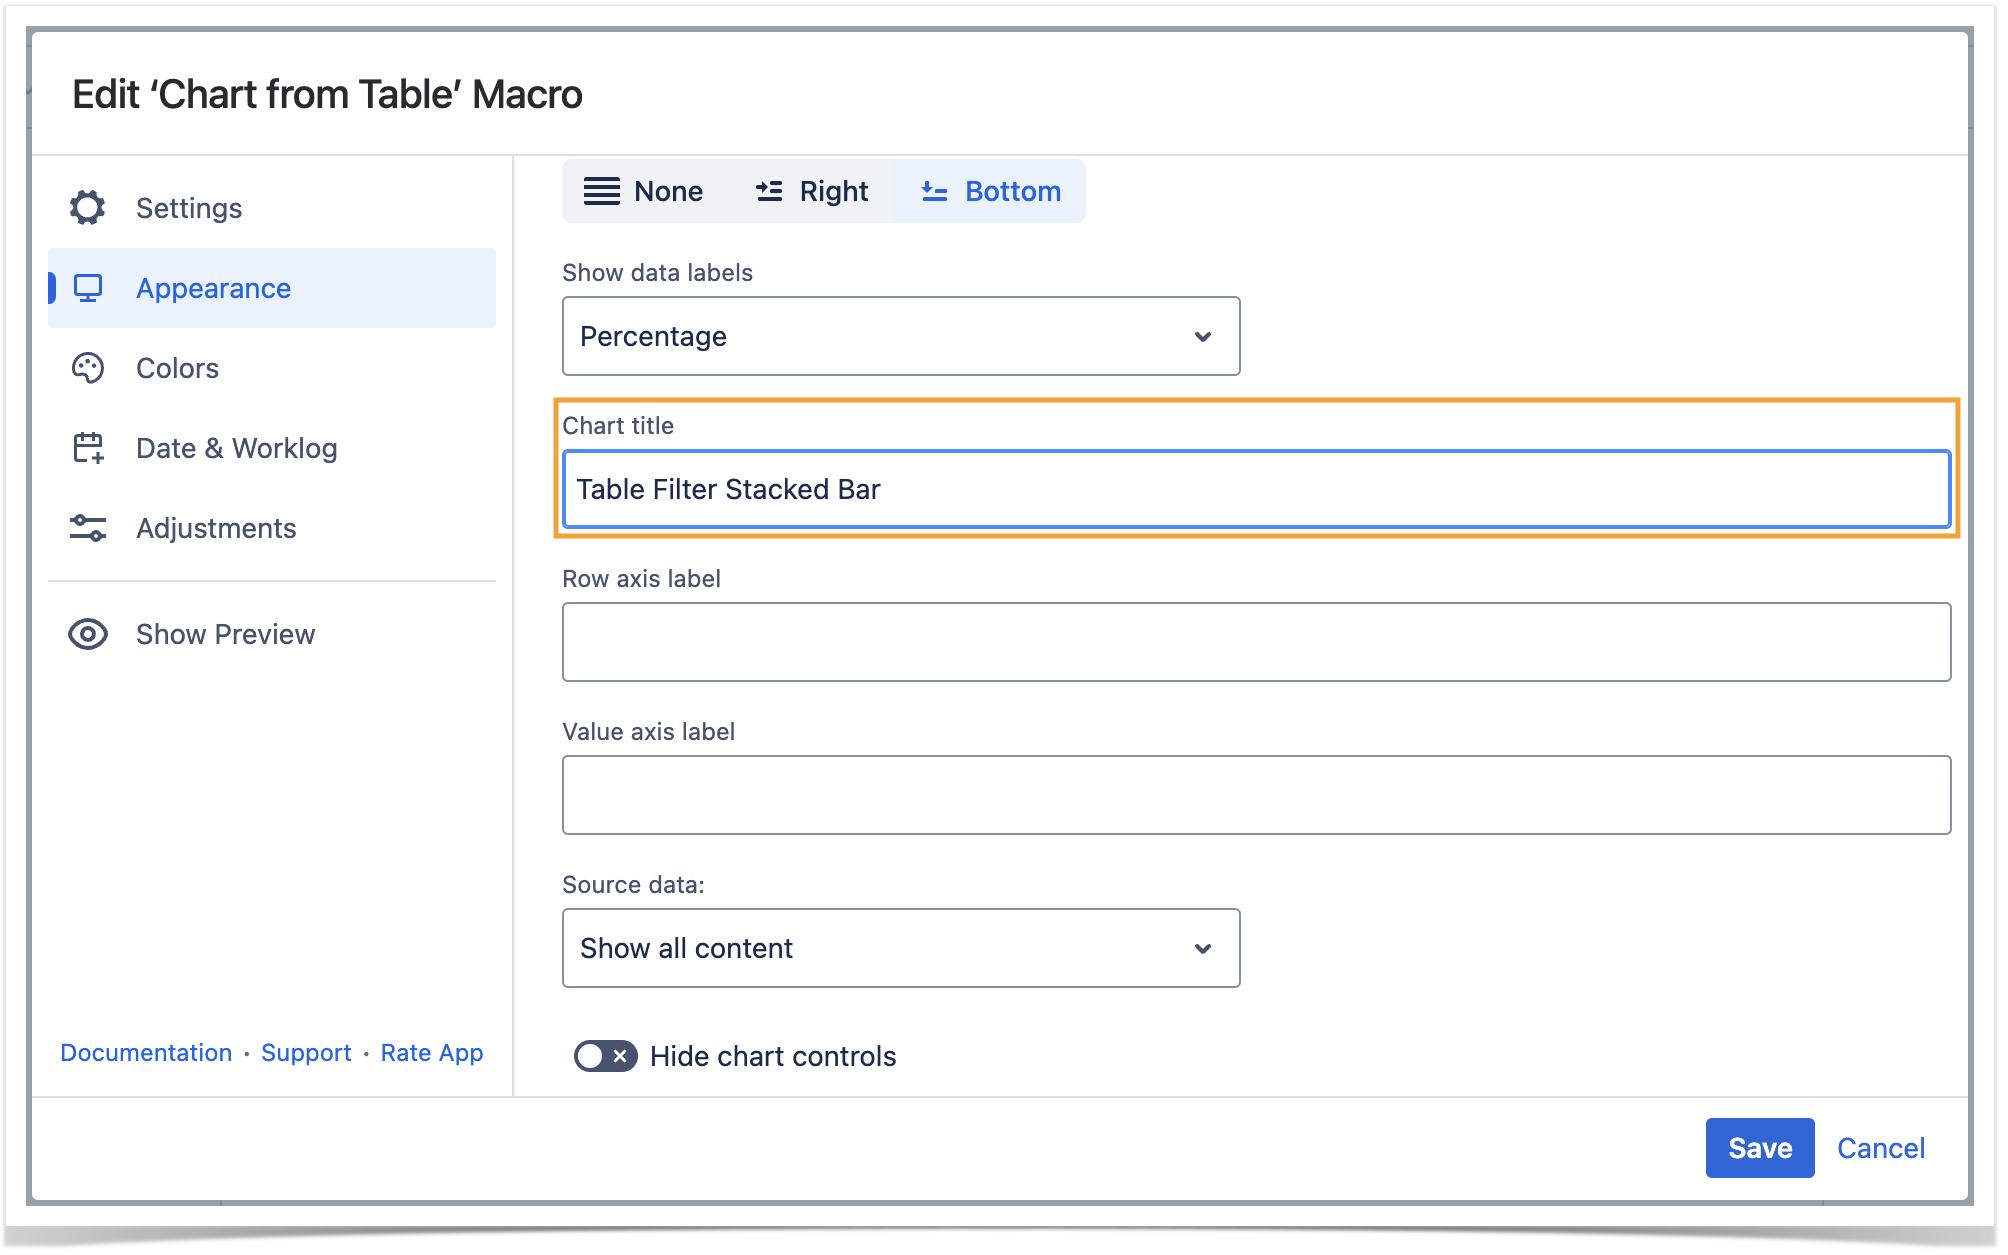
Set the chart title
Align chart- Switch the page to the edit mode.
- Select the macro and click Edit.
- Switch to the LookAppearance tab.
- Locate the Align chart option.
- Select the appropriate chart alignment, as follows:
- Left
- Center
- Right
- Chart title option and enter the title.
- Save the macro and the page.

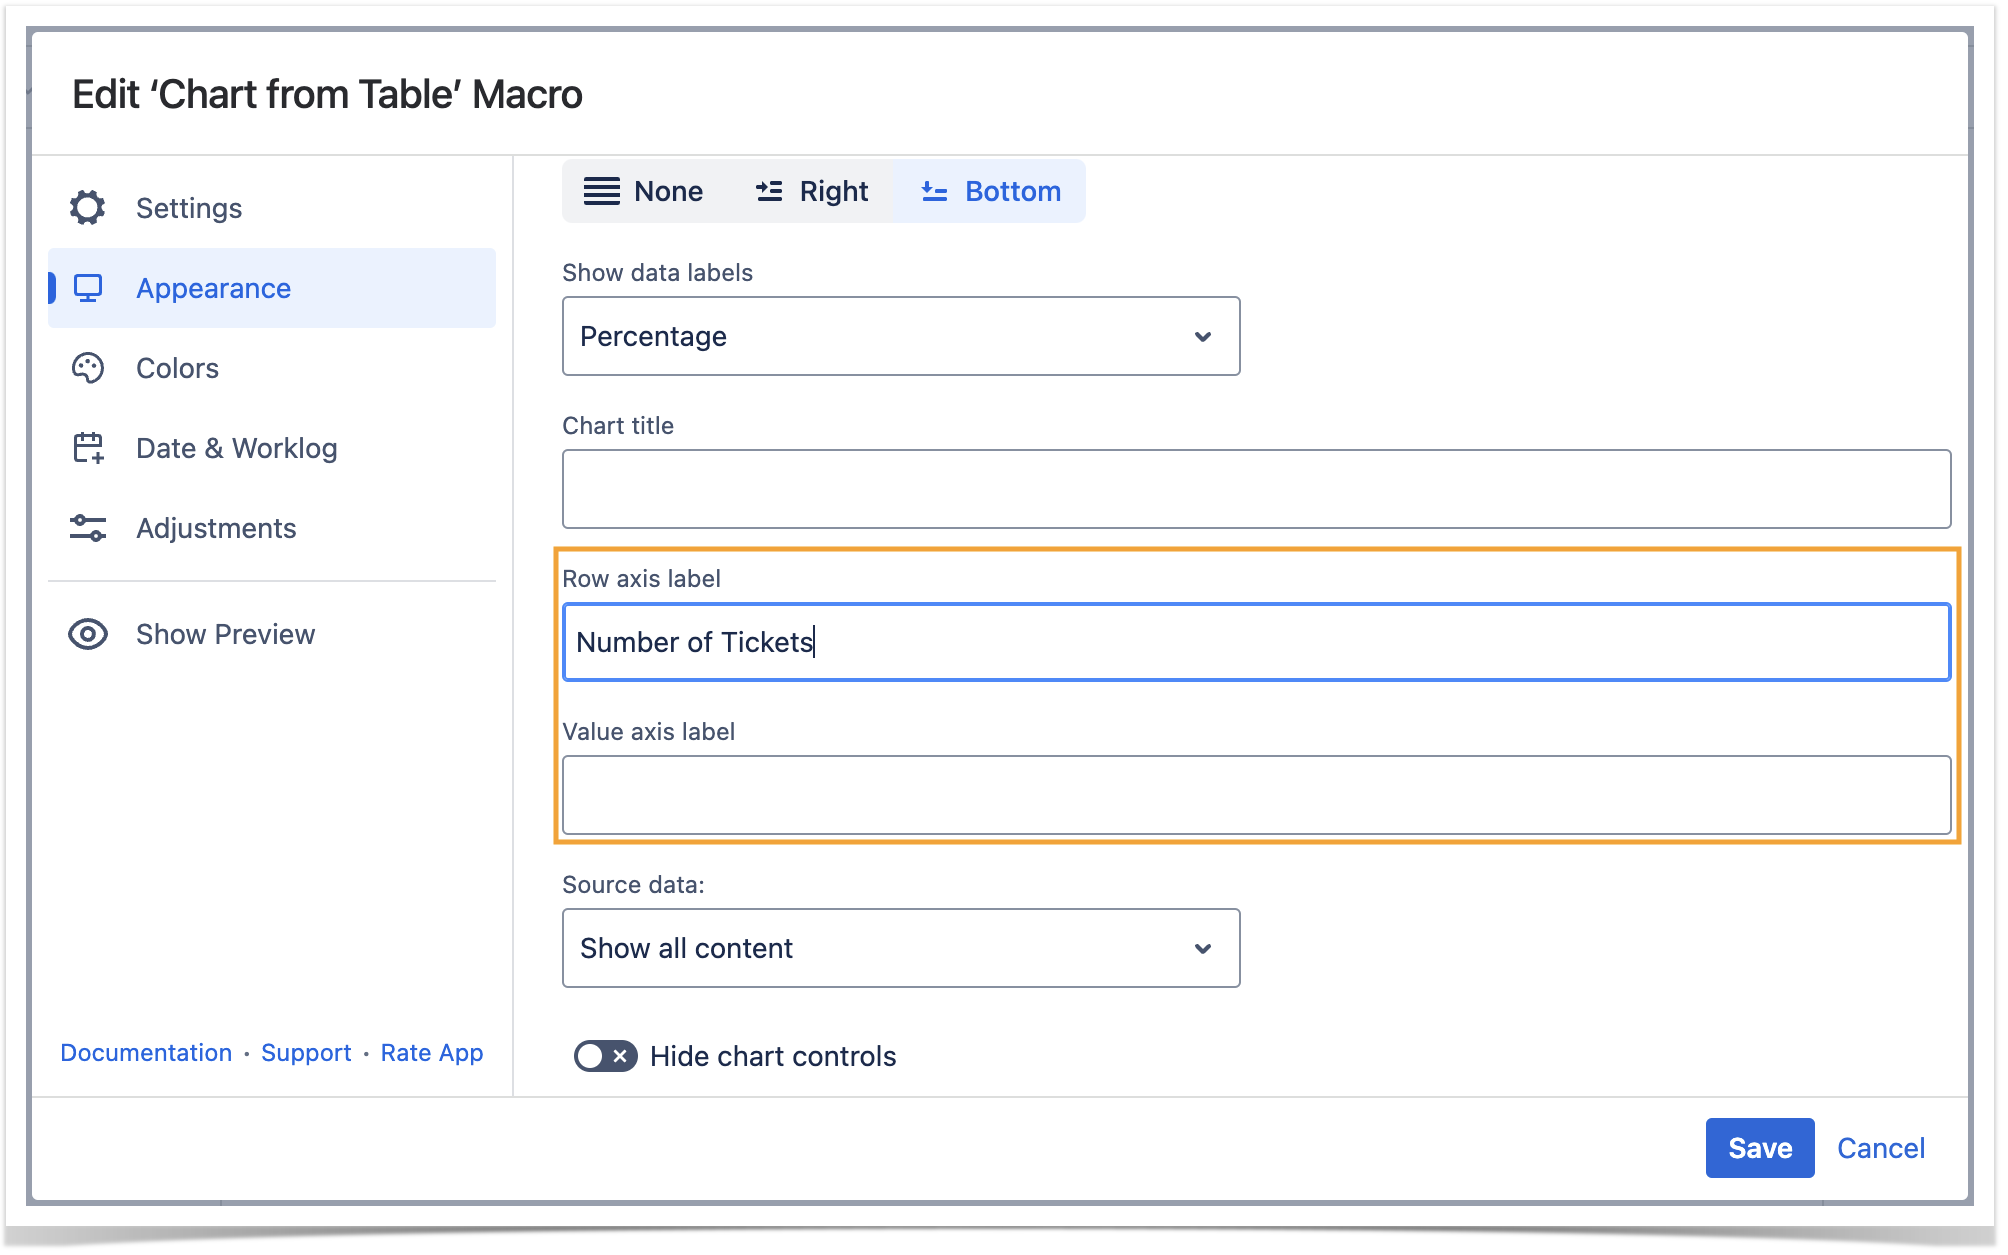
Set
the legend positionaxis labels
- Switch the page to the edit mode.
- Select the macro and click Edit.
- Switch to the LookAppearance tab.
- Locate the Legend Position option.
- Select the appropriate legend position, as follows:
- None
- Right
- Bottom
- theRow axis label andValue axis label options and enter the labels.
- Save the macro and the page.

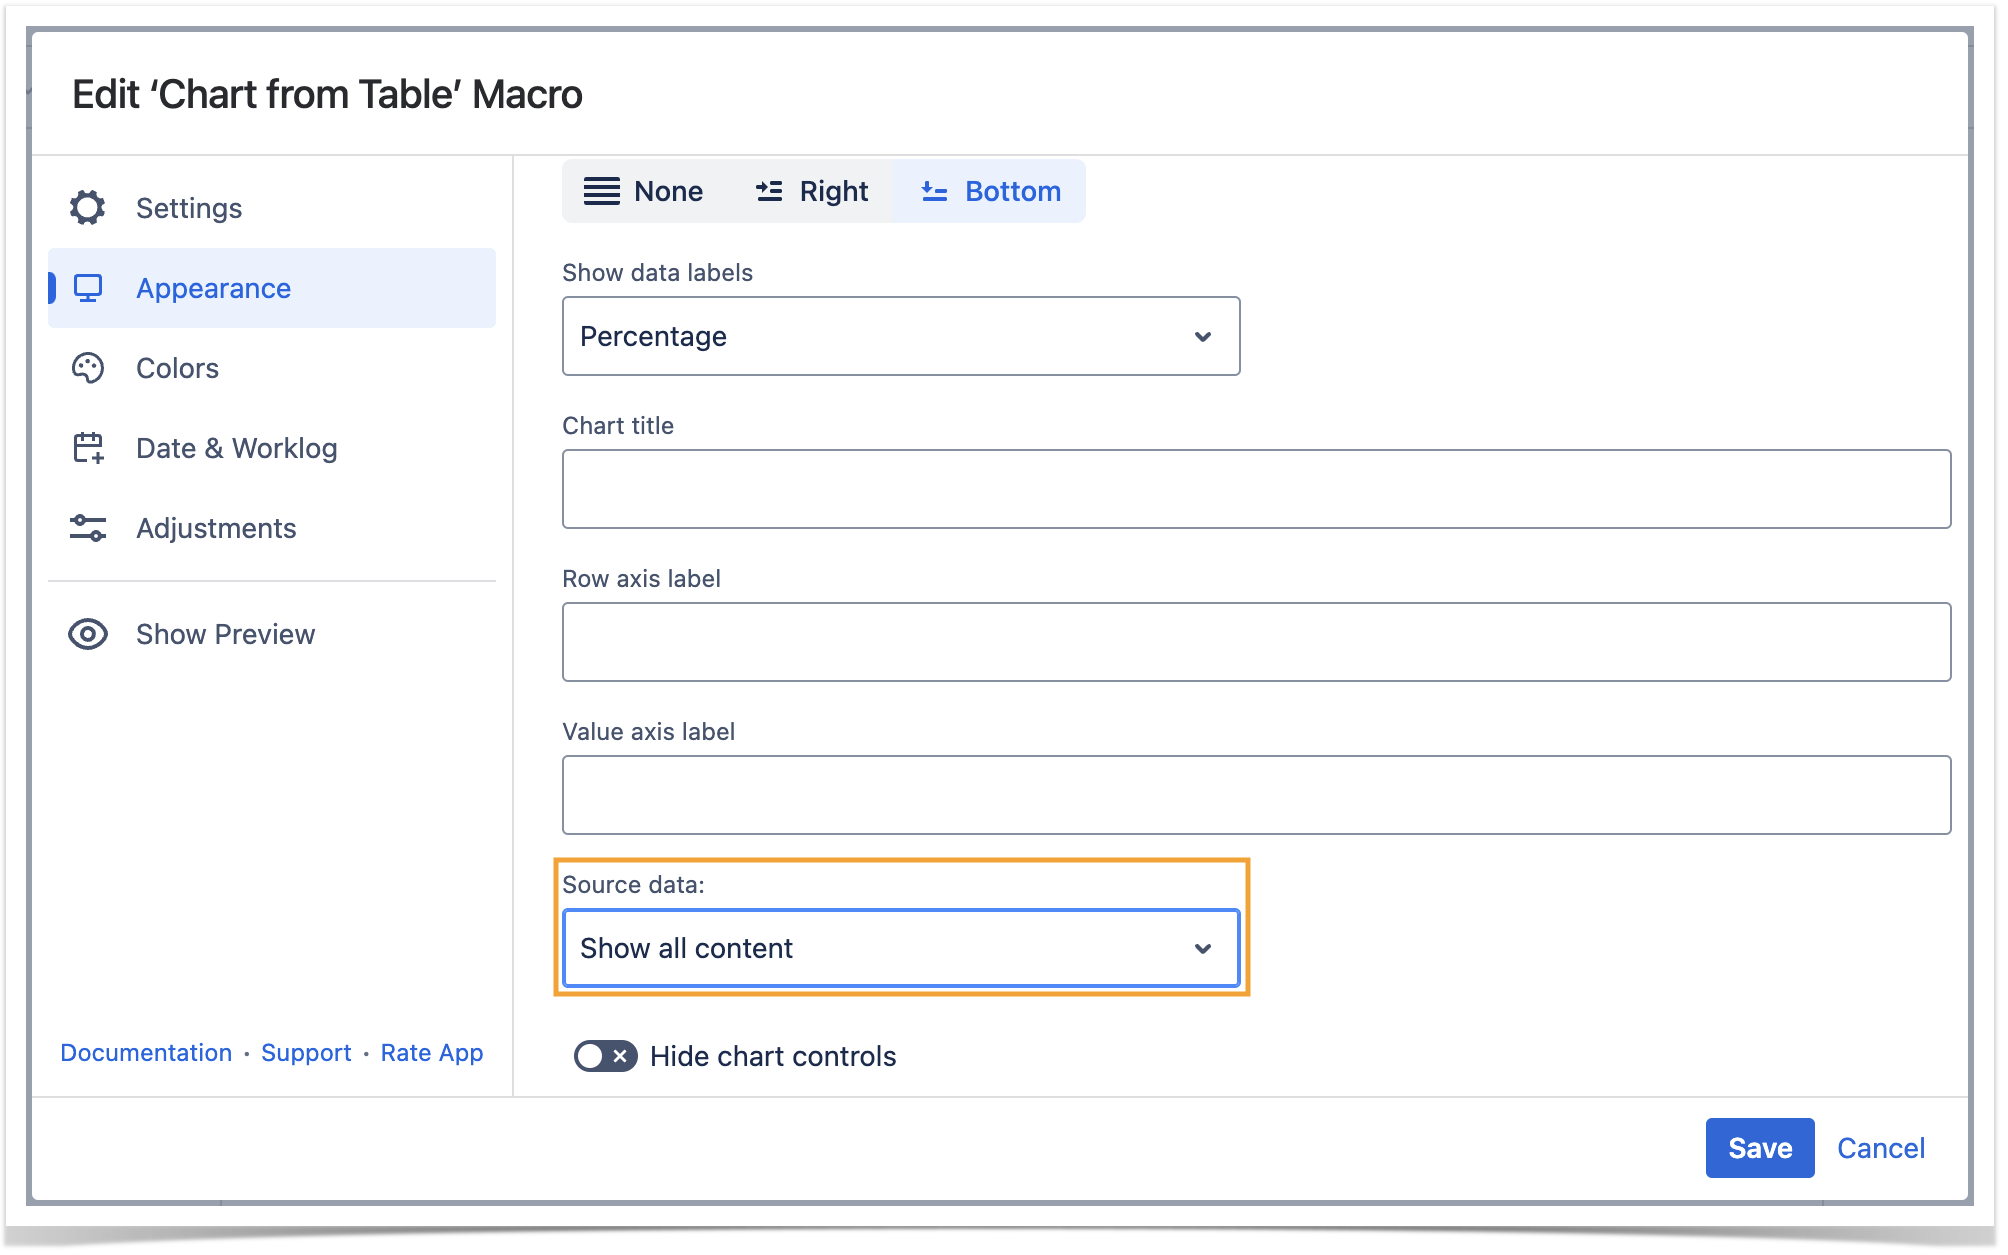
Show/Hide source data
- Switch the page to the edit mode.
- Select the macro and click Edit.
- Switch to the Appearance tab.
- Locate the Source data option and select the appropriate option, as follows:
- Show all content
- Hide tables
- Hide all content
- Save the macro and the page.
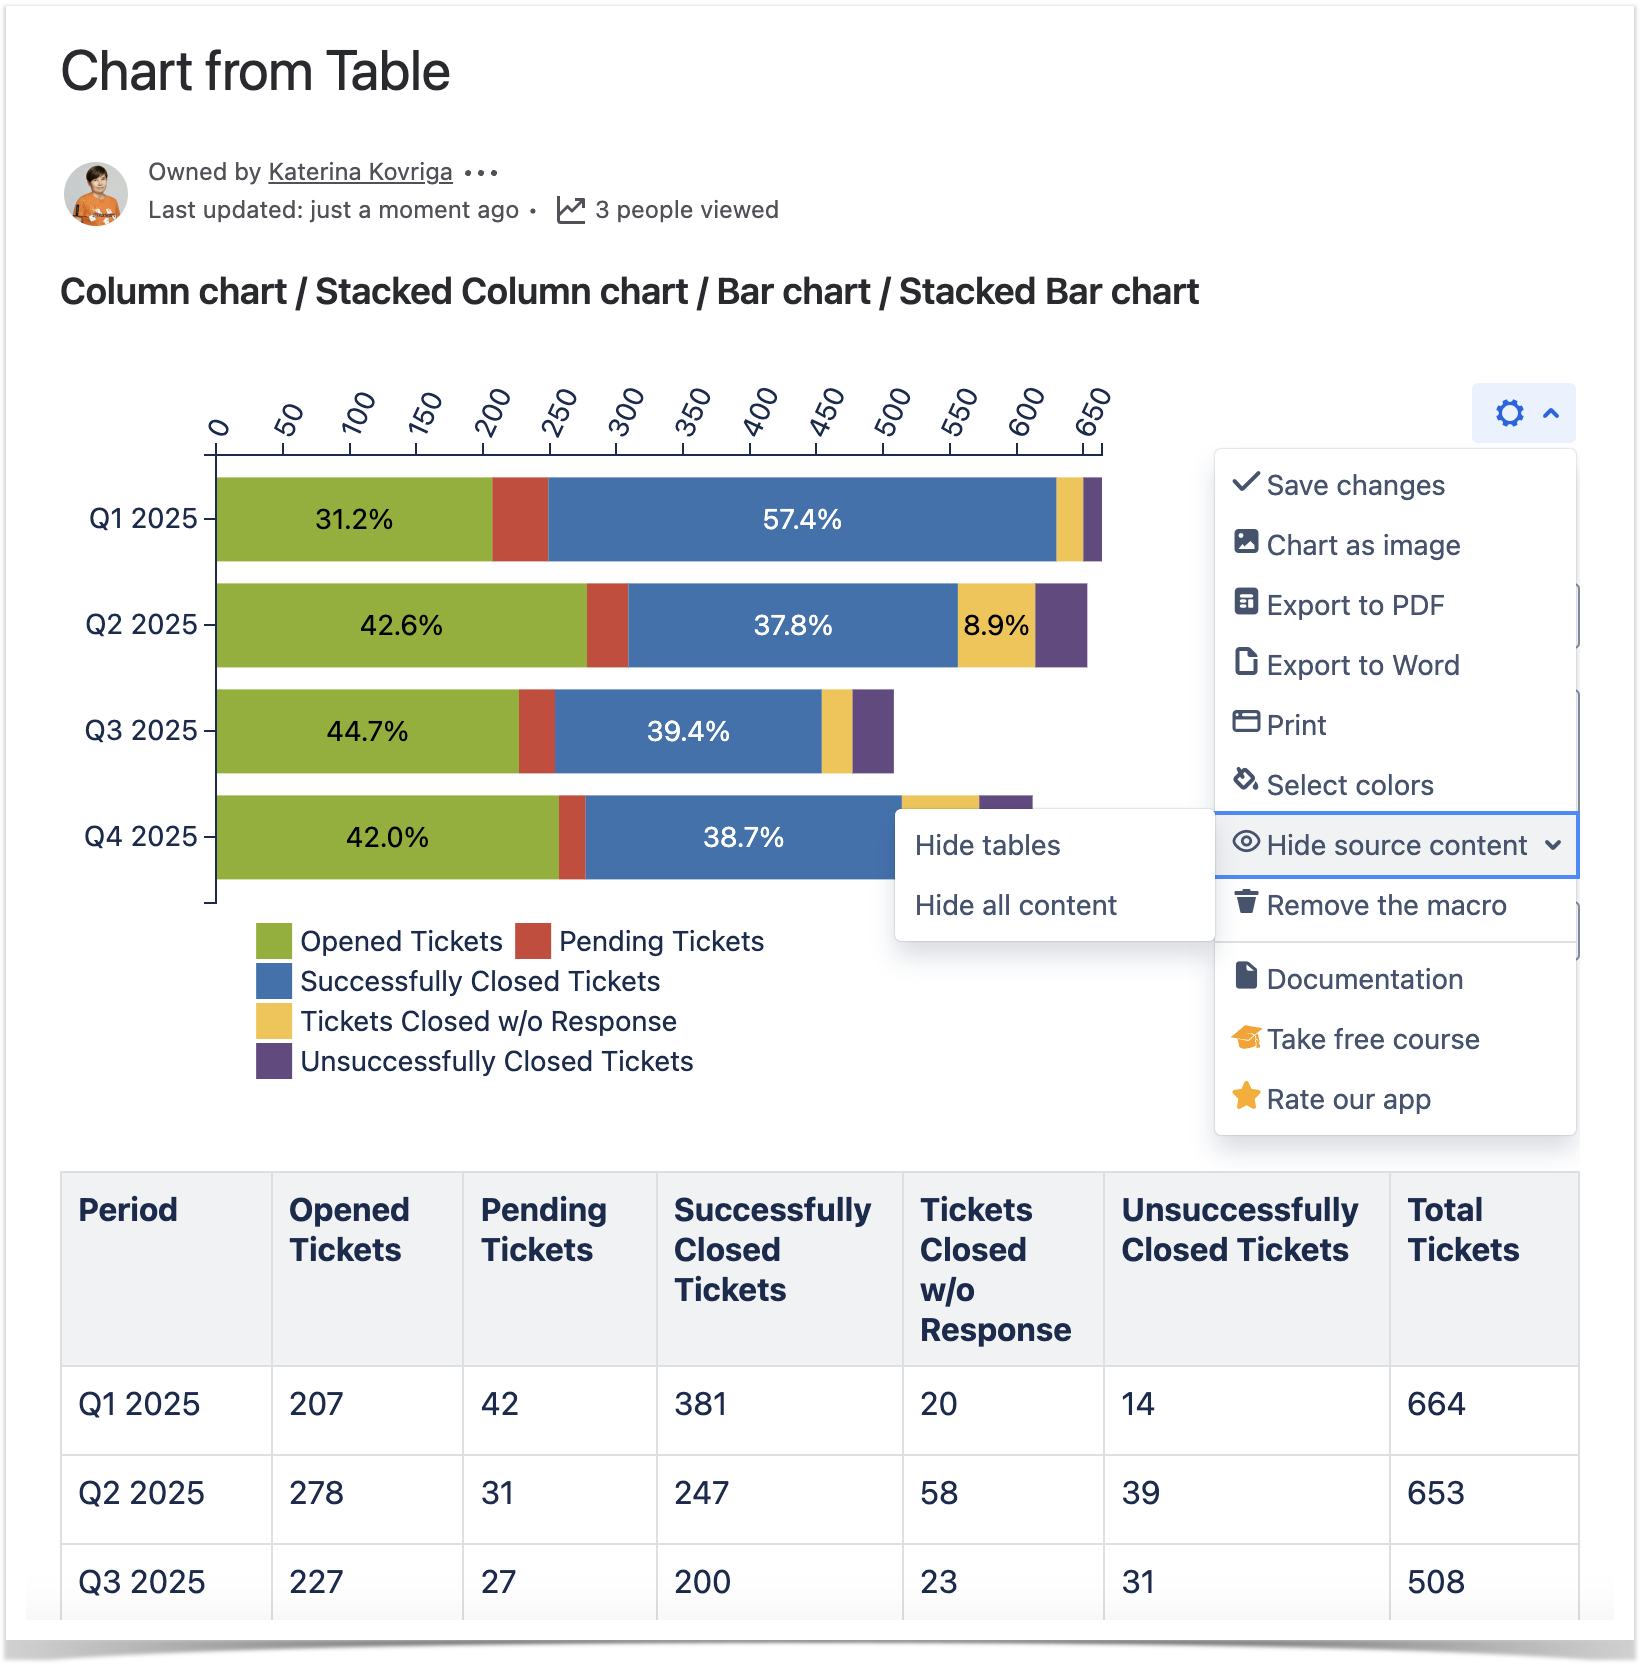
| Info |
|---|
To show/hide source data in the page view mode:
|
| Handy Carousel | ||
|---|---|---|
| ||
|


Hide chart controls
- Switch the page to the edit mode.
- Select the macro and click Edit.
- Switch to the LookAppearance tab.
- Locate and enable the Hide chart controls option.
- Save the macro and the page.

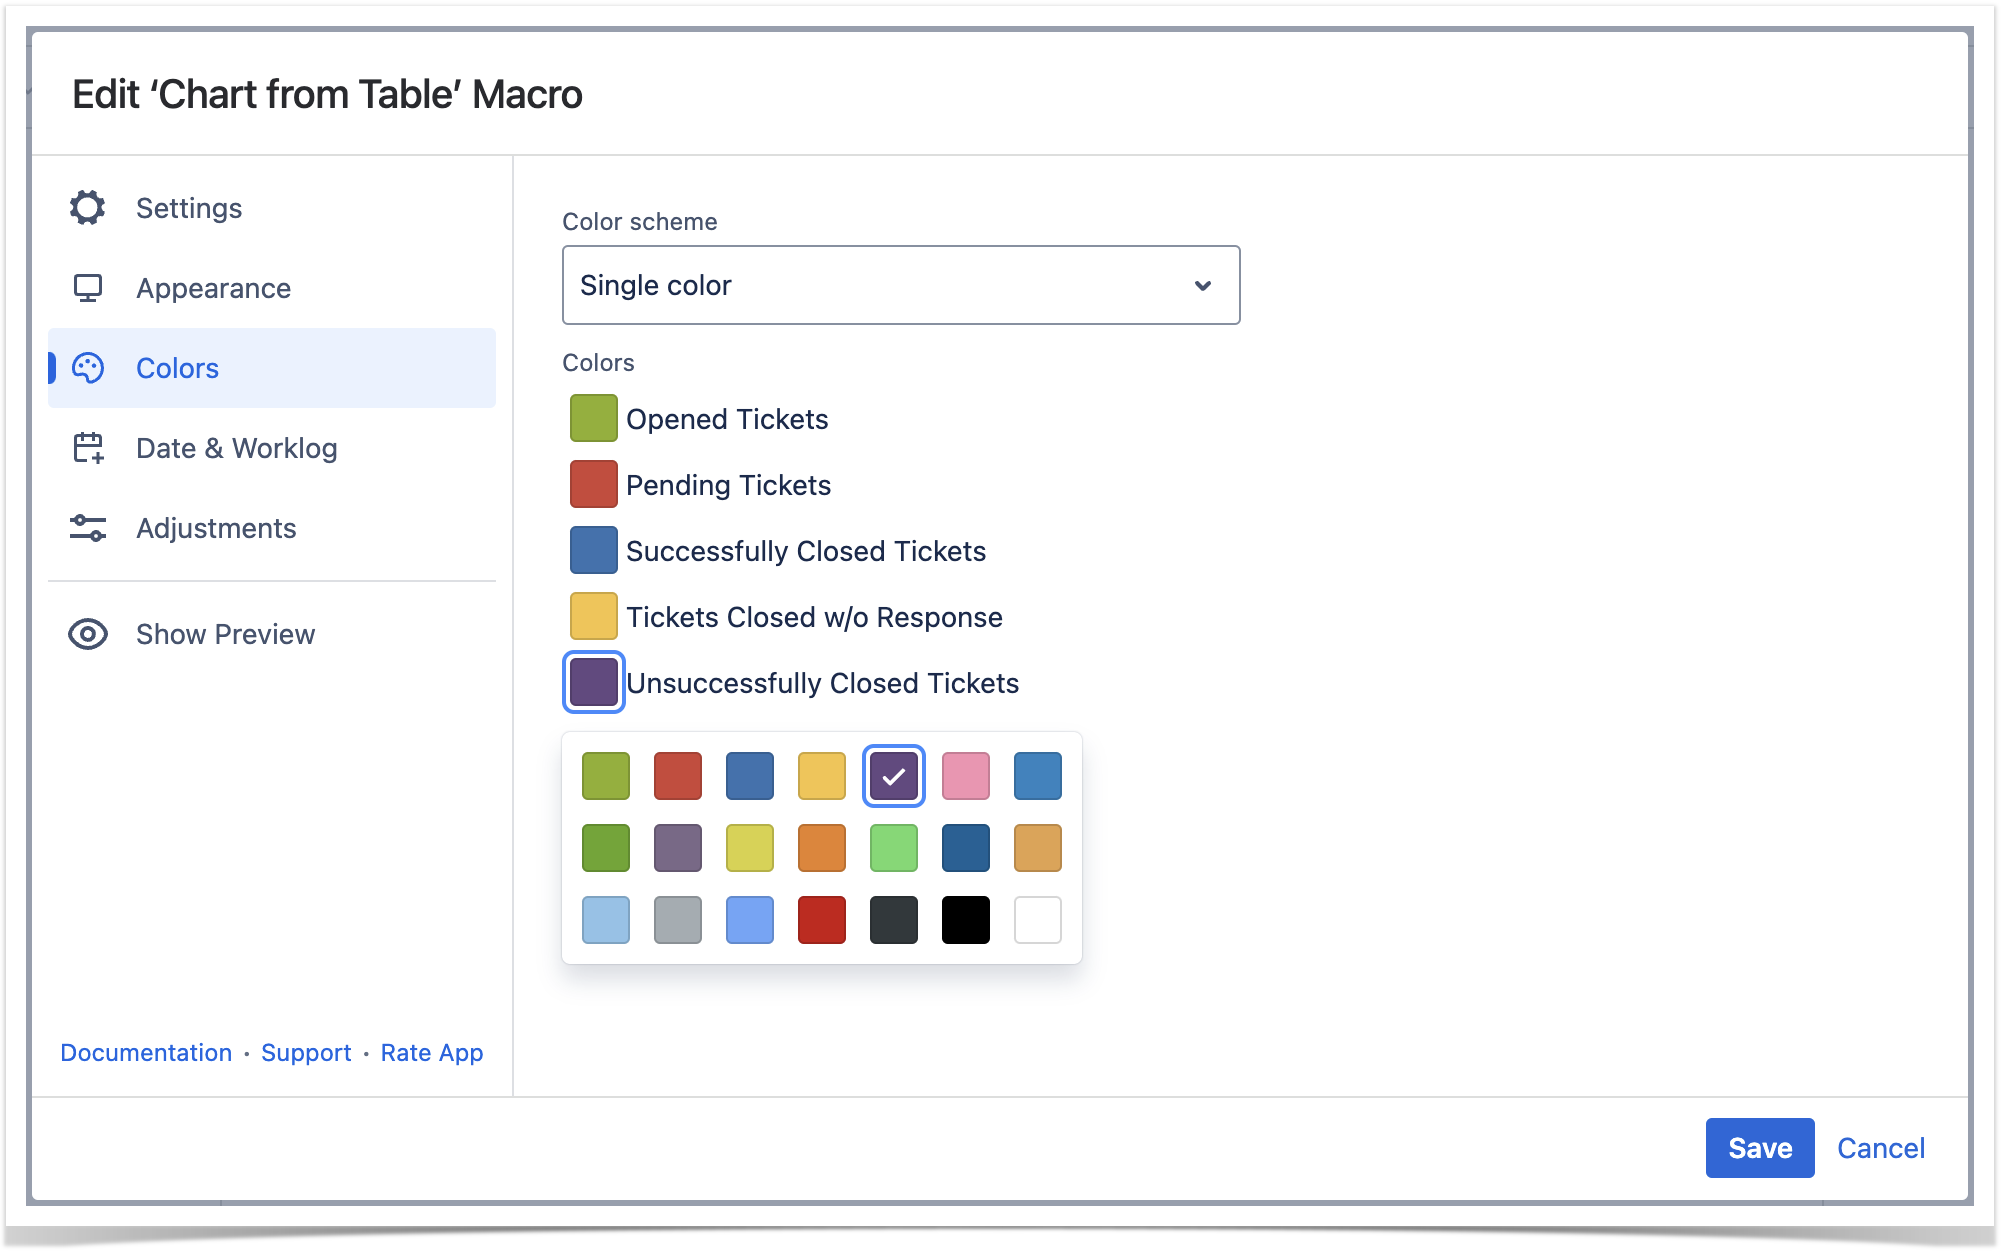
Colors Tab
Set
the chart titlecolors
- Switch the page to the edit mode.
- Select the macro and click Edit.
- Switch to the Look tab.Colors tab.
- Select the appropriate colors for each label.
- To set individual column colors, locate the Color scheme option.
Select the Multicolor or Colors in the table columns option
Locate the Chart title option and enter the title.
- Save the macro and the page.

Set axis labels
- Switch the page to the edit mode.
- Select the macro and click Edit.
- Switch to the Look tab.
- Locate the Row axis label and Value axis label options and enter the labels.
- Save the macro and the page.

Show data labels
- Switch the page to the edit mode.
- Select the macro and click Edit.
- Switch to the Look tab.
- Locate the Show data labels option and select the appropriate option, as follows:
- None
- Value
- Percentage
- Value (Percentage)
- Percentage (Value)
- Save the macro and the page.

| Info |
|---|
To set the colors in the page view mode:
|
| Handy Tip | ||
|---|---|---|
| ||
The Multicolor setting enables you to select the appropriate colors for each value of the Label column specified in the data series field of the chart. |
| Handy Tip | ||
|---|---|---|
| ||
The Colors in the table columns setting enables you to add colors as either its simple name (e.g. green, yellow) or a HEX code (e.g. #808080-> gray) in a separate custom-made column to paint values of the Labels column(-s) specified in the data series field of the chart.
|
| Handy Carousel | ||
|---|---|---|
| ||
|
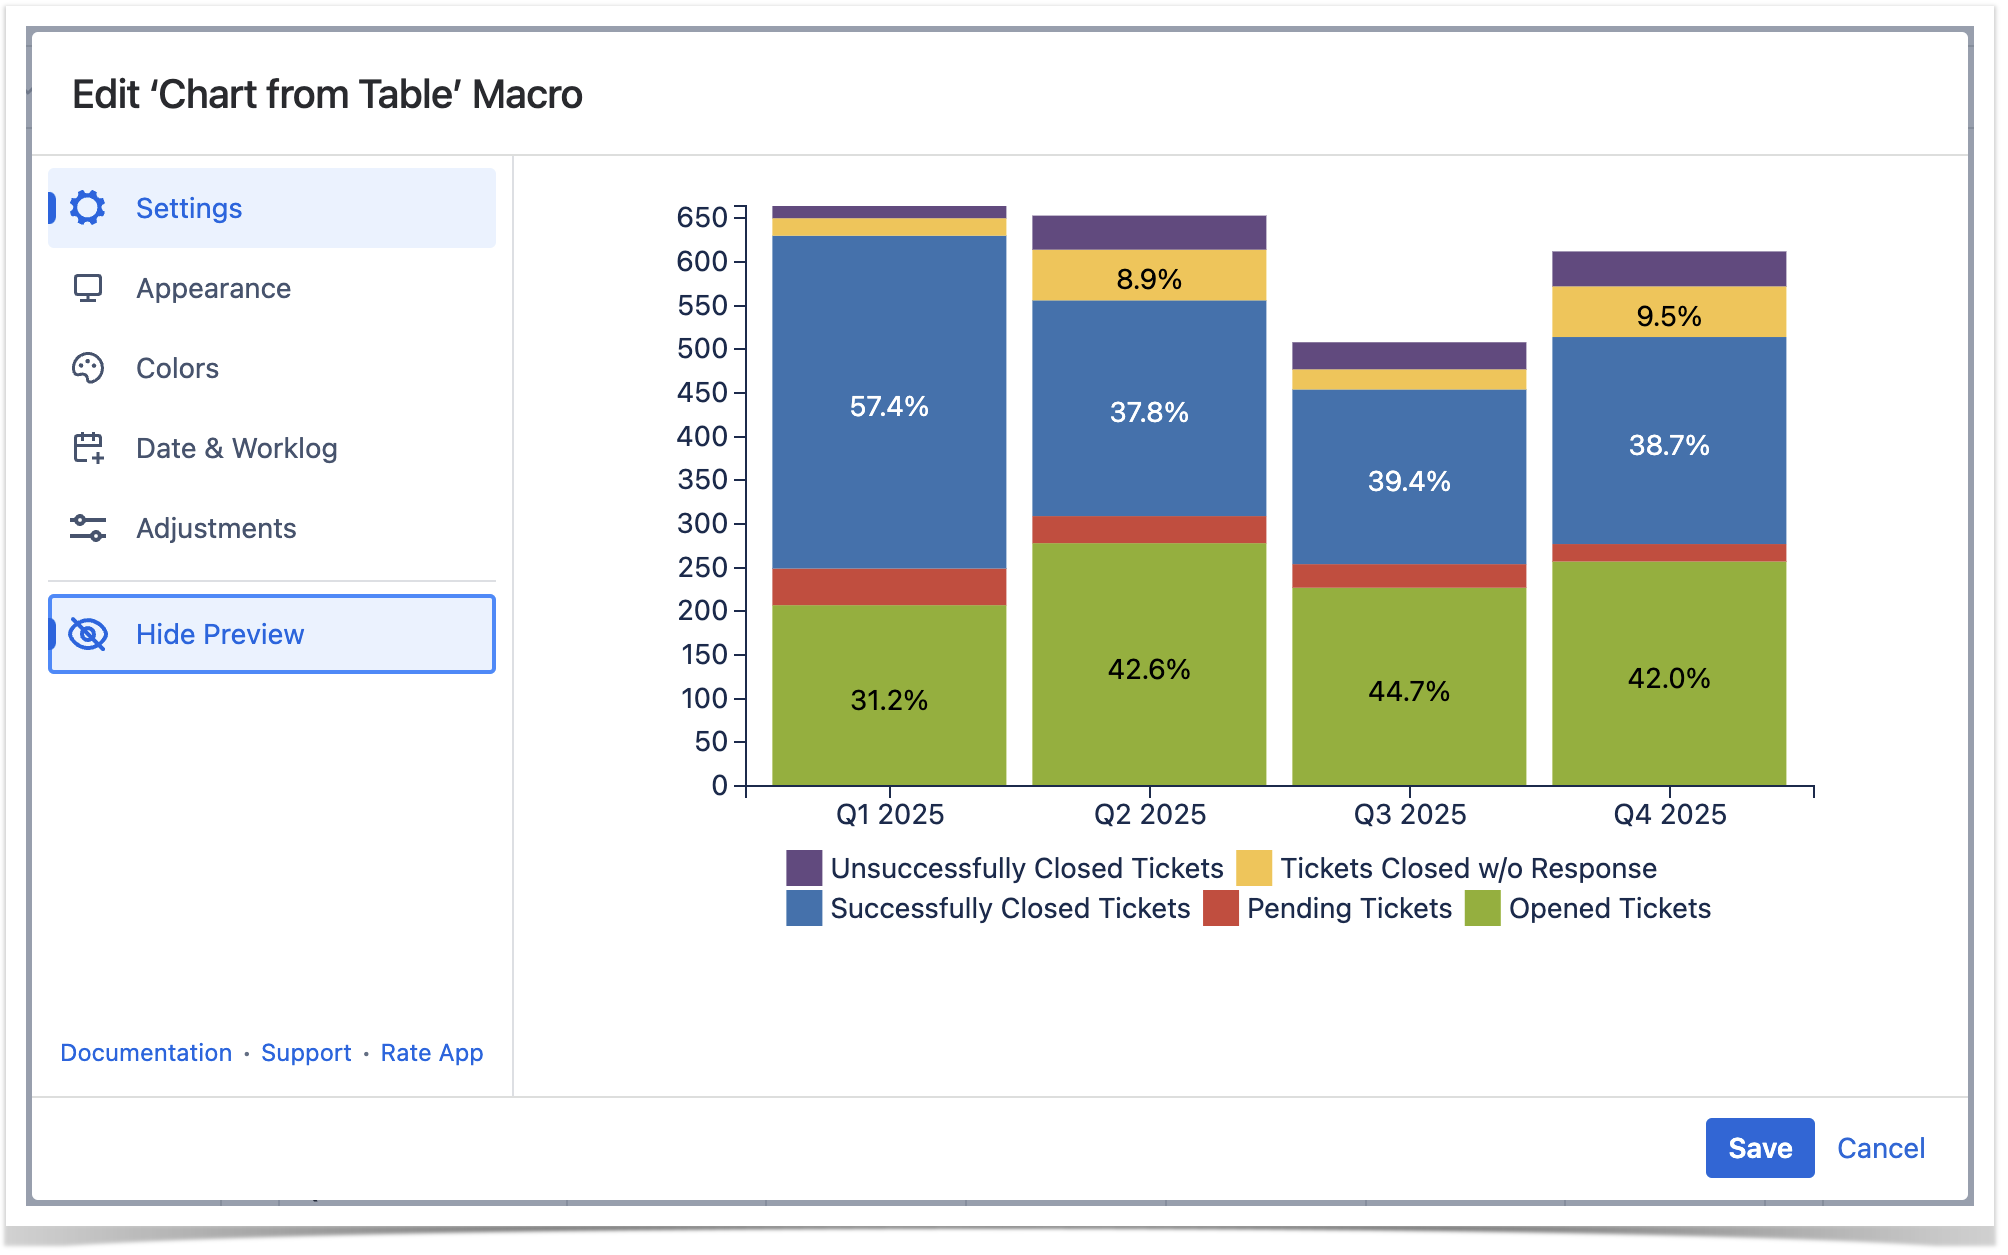
Preview Option
While working in the edit mode, use the Show/hide preview option to adjust the required settings before saving the macro and publishing the page.
| Handy Carousel | ||
|---|---|---|
| ||
|
Filter the Source Table
- Select one or more chart columns/sectors/bars.
- Only the related rows of the source table are displayed.
- Deselect all the columns/sectors/bars to display the whole source table.