Overview
| Section | |||||||||||||||||||||||||||||||||||||||||||||||||||||||||||||
|---|---|---|---|---|---|---|---|---|---|---|---|---|---|---|---|---|---|---|---|---|---|---|---|---|---|---|---|---|---|---|---|---|---|---|---|---|---|---|---|---|---|---|---|---|---|---|---|---|---|---|---|---|---|---|---|---|---|---|---|---|---|
|
Settings Tab
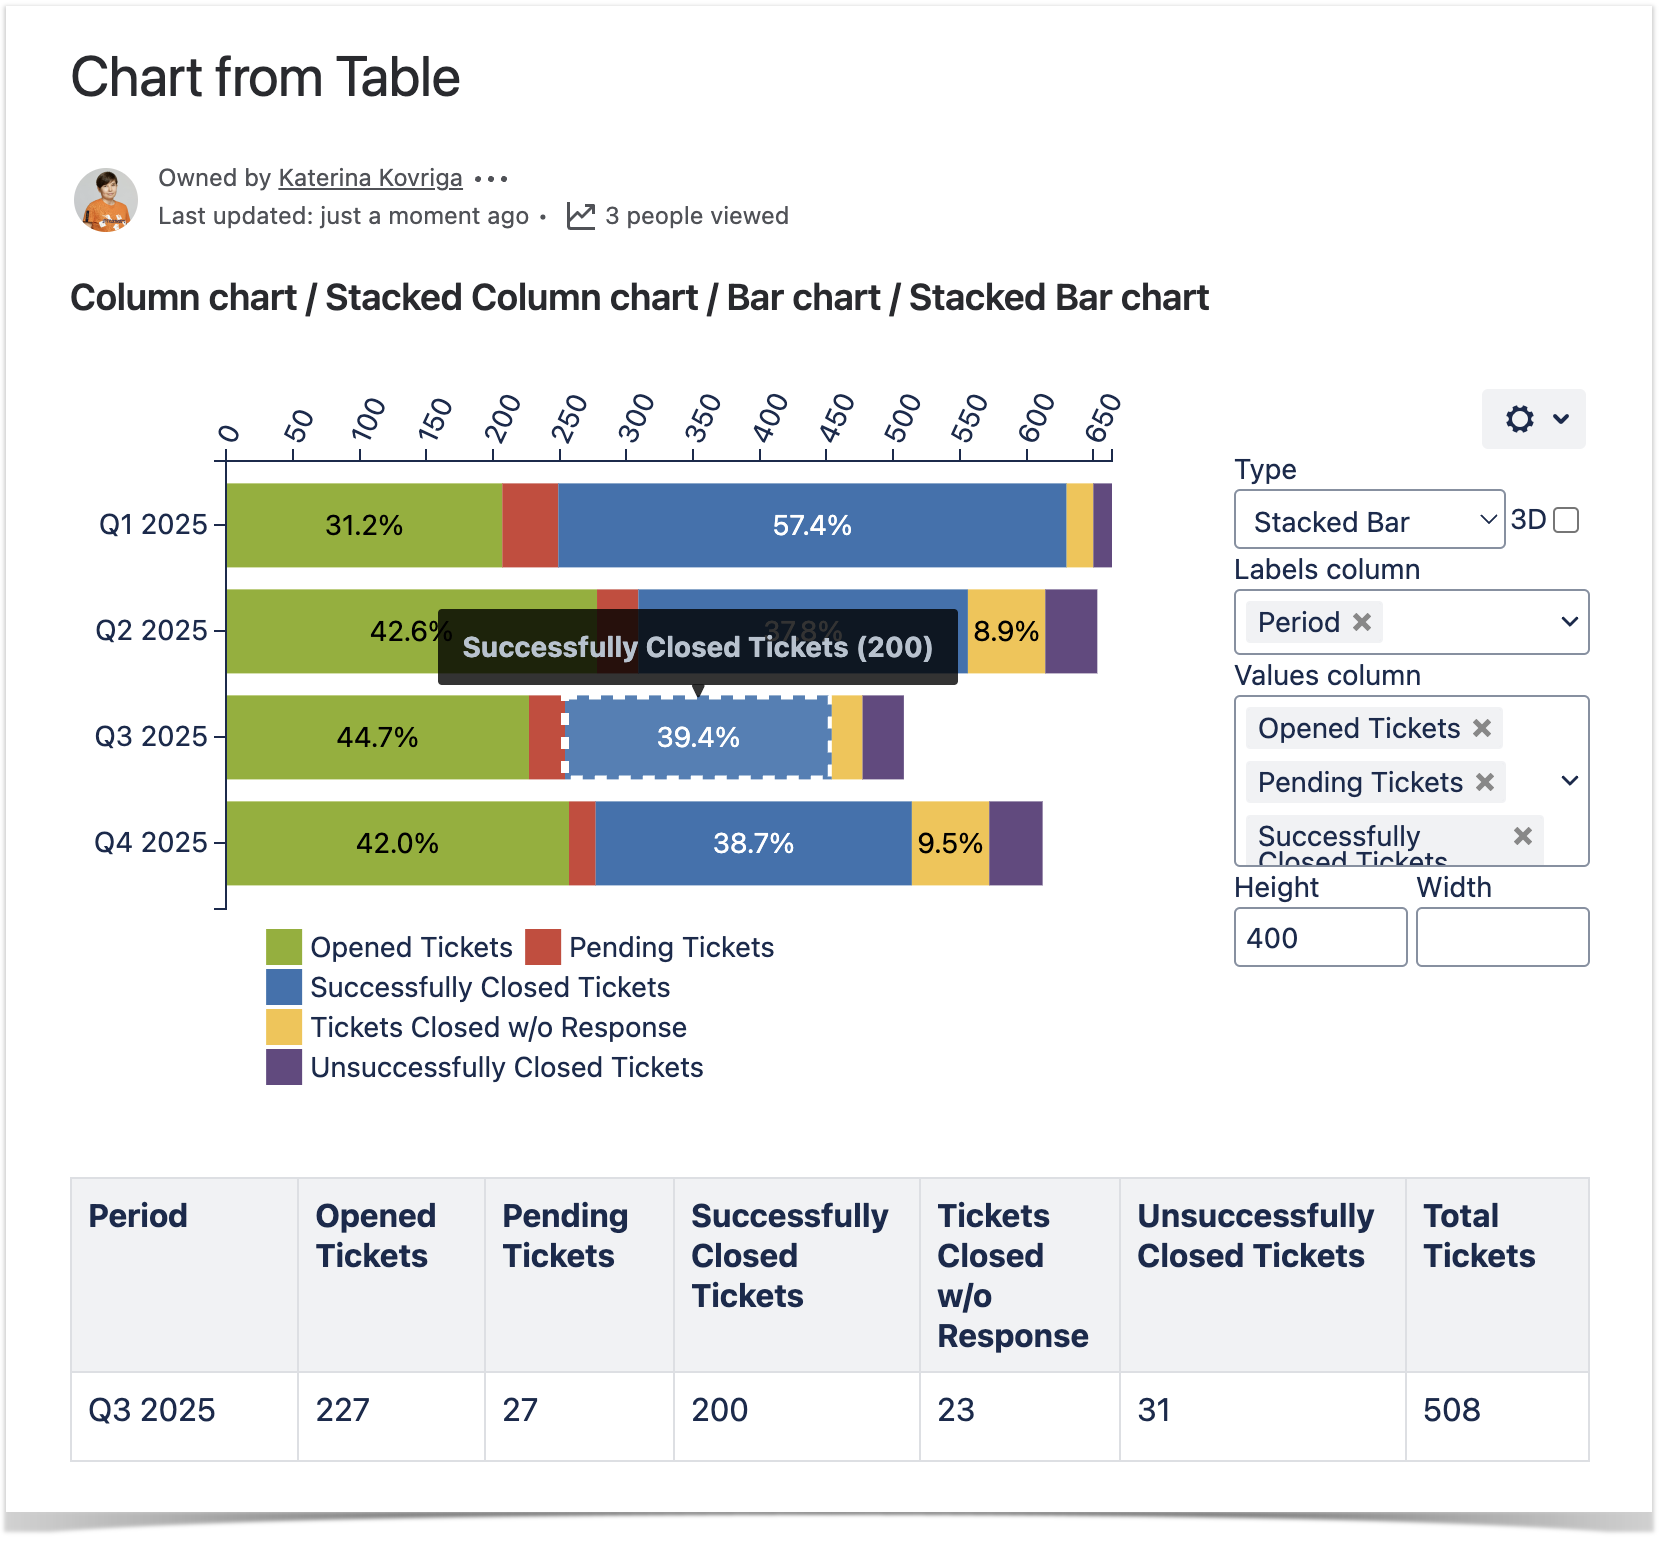
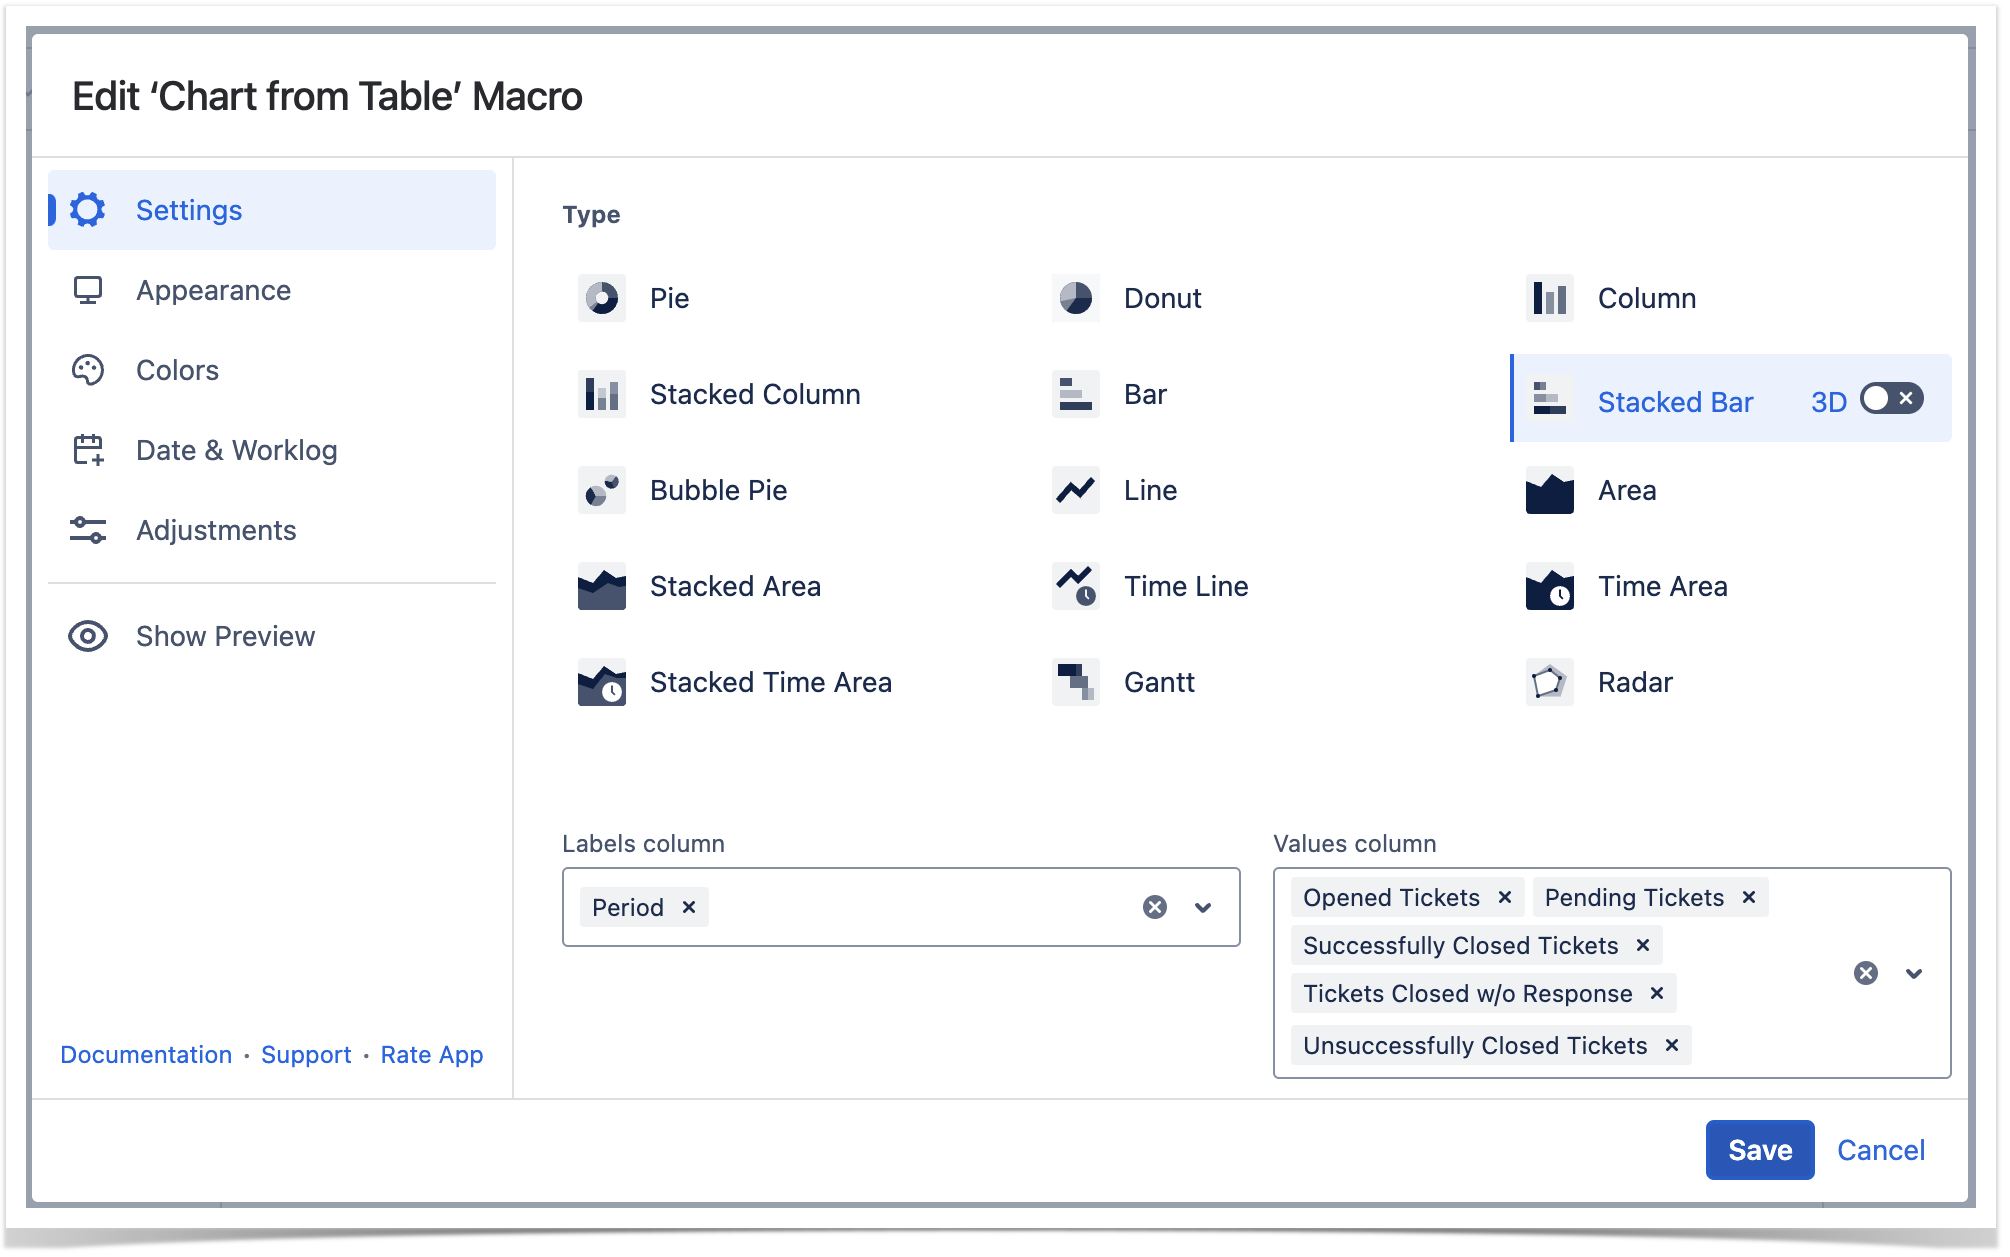
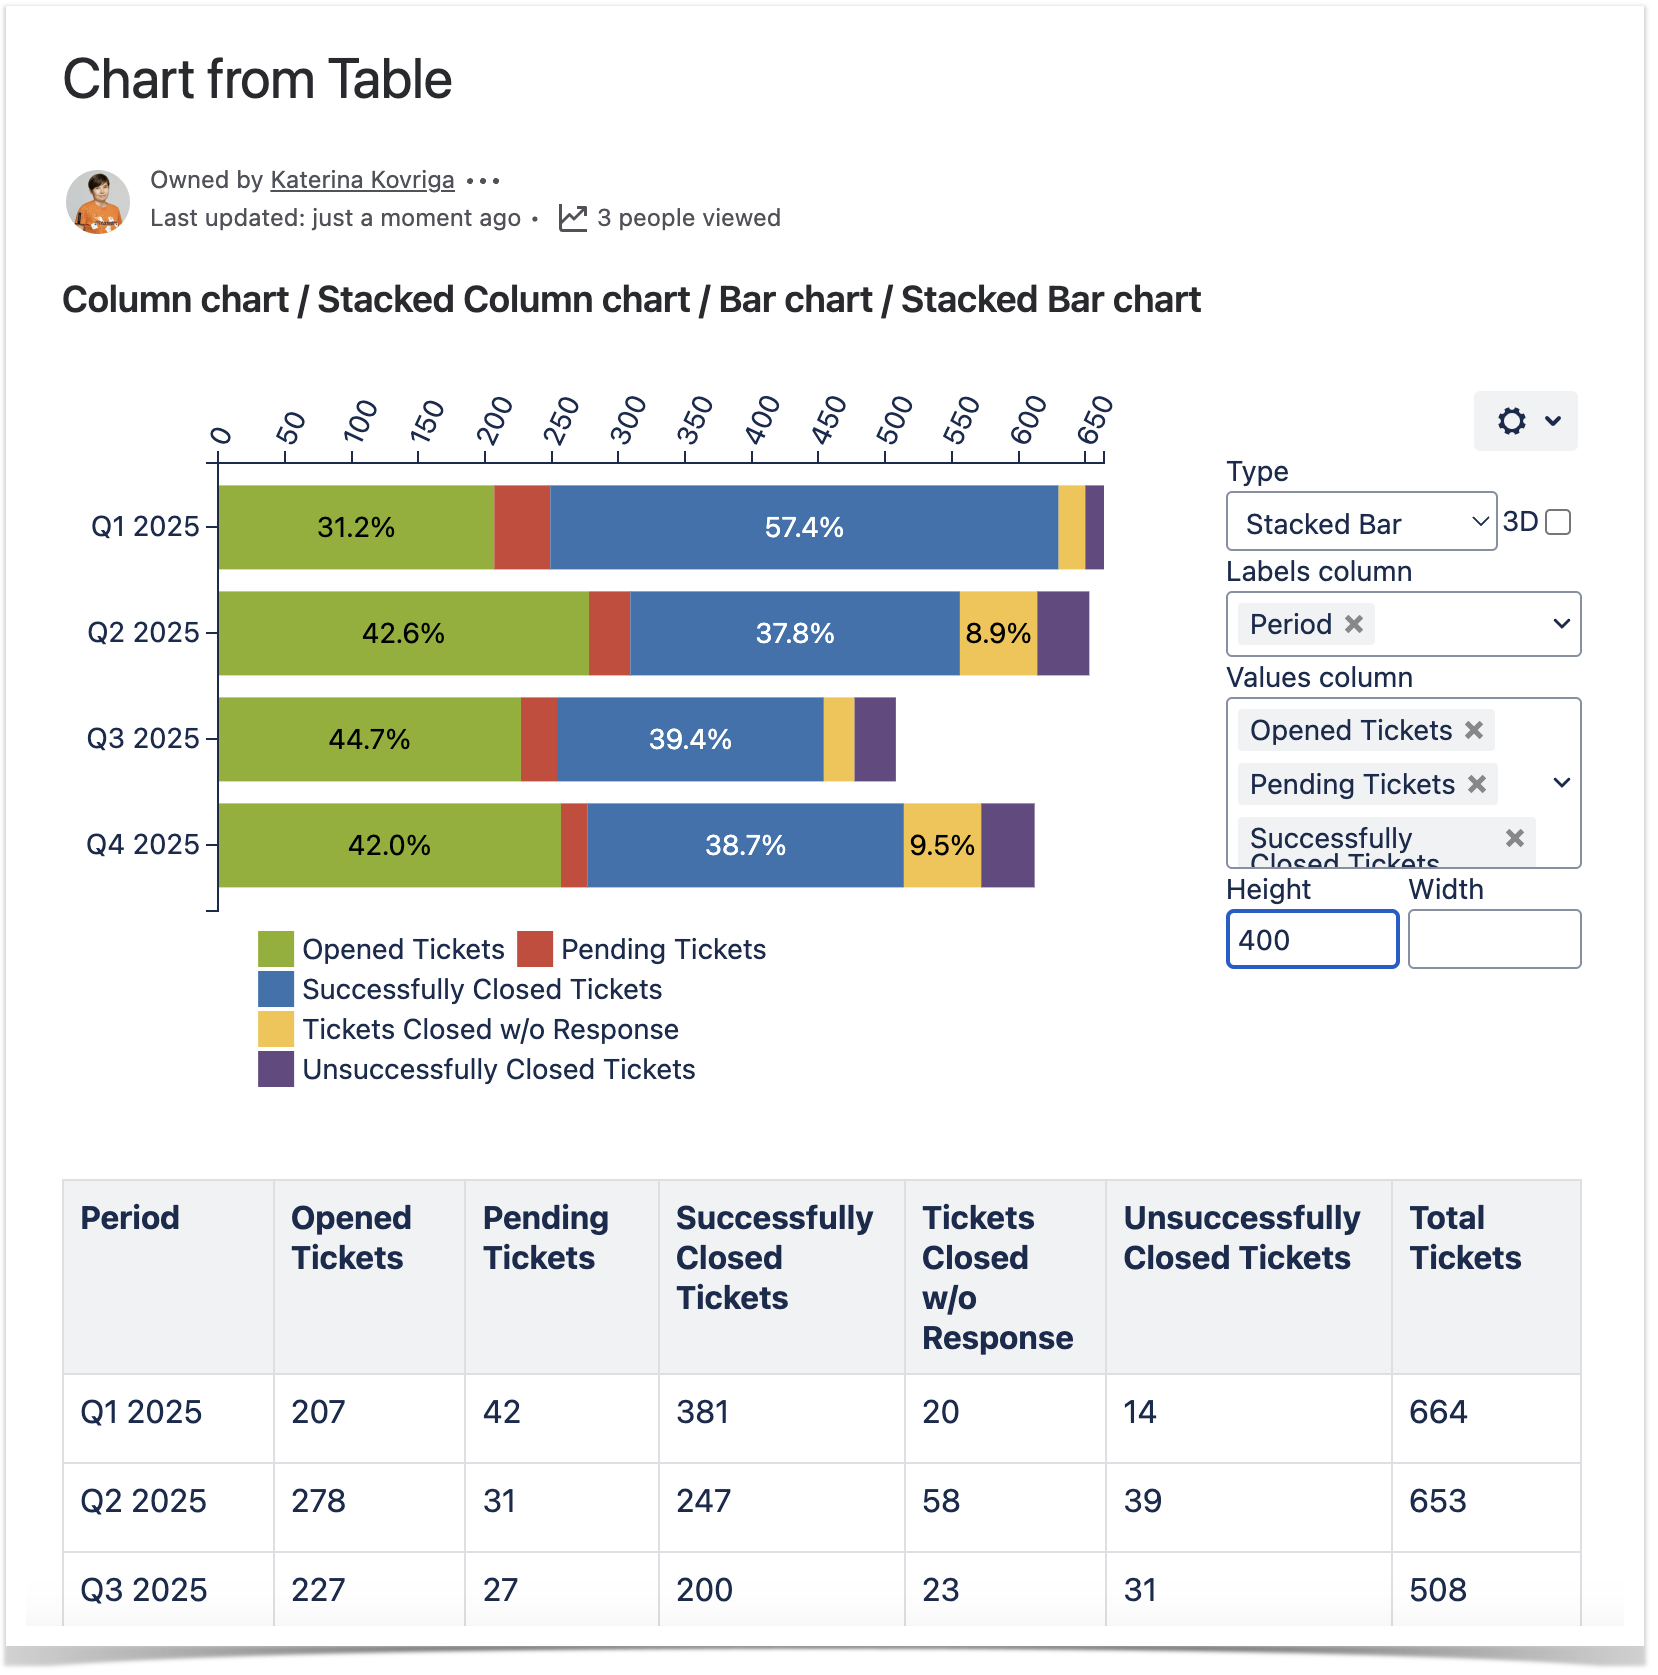
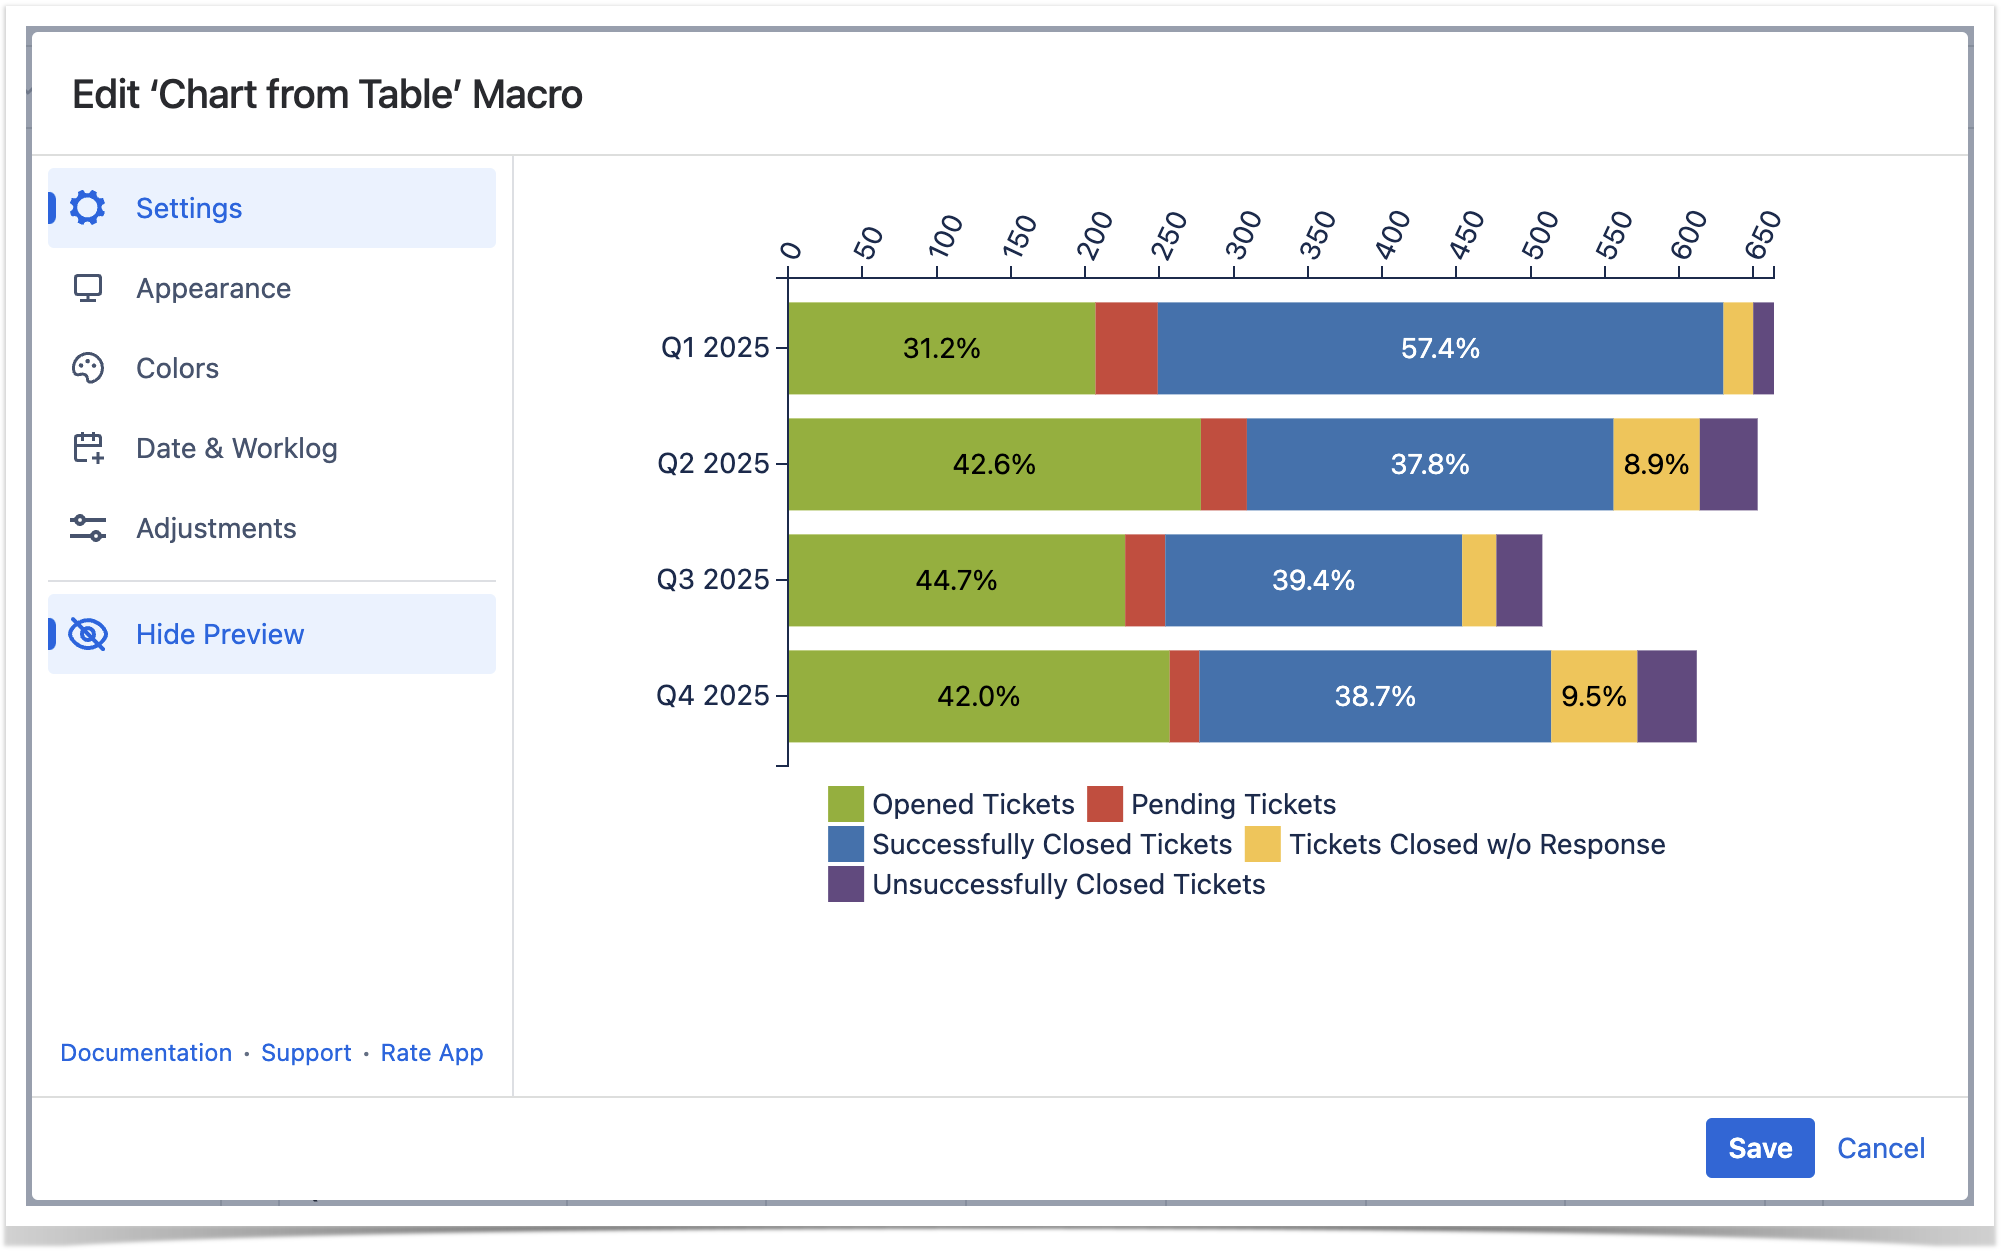
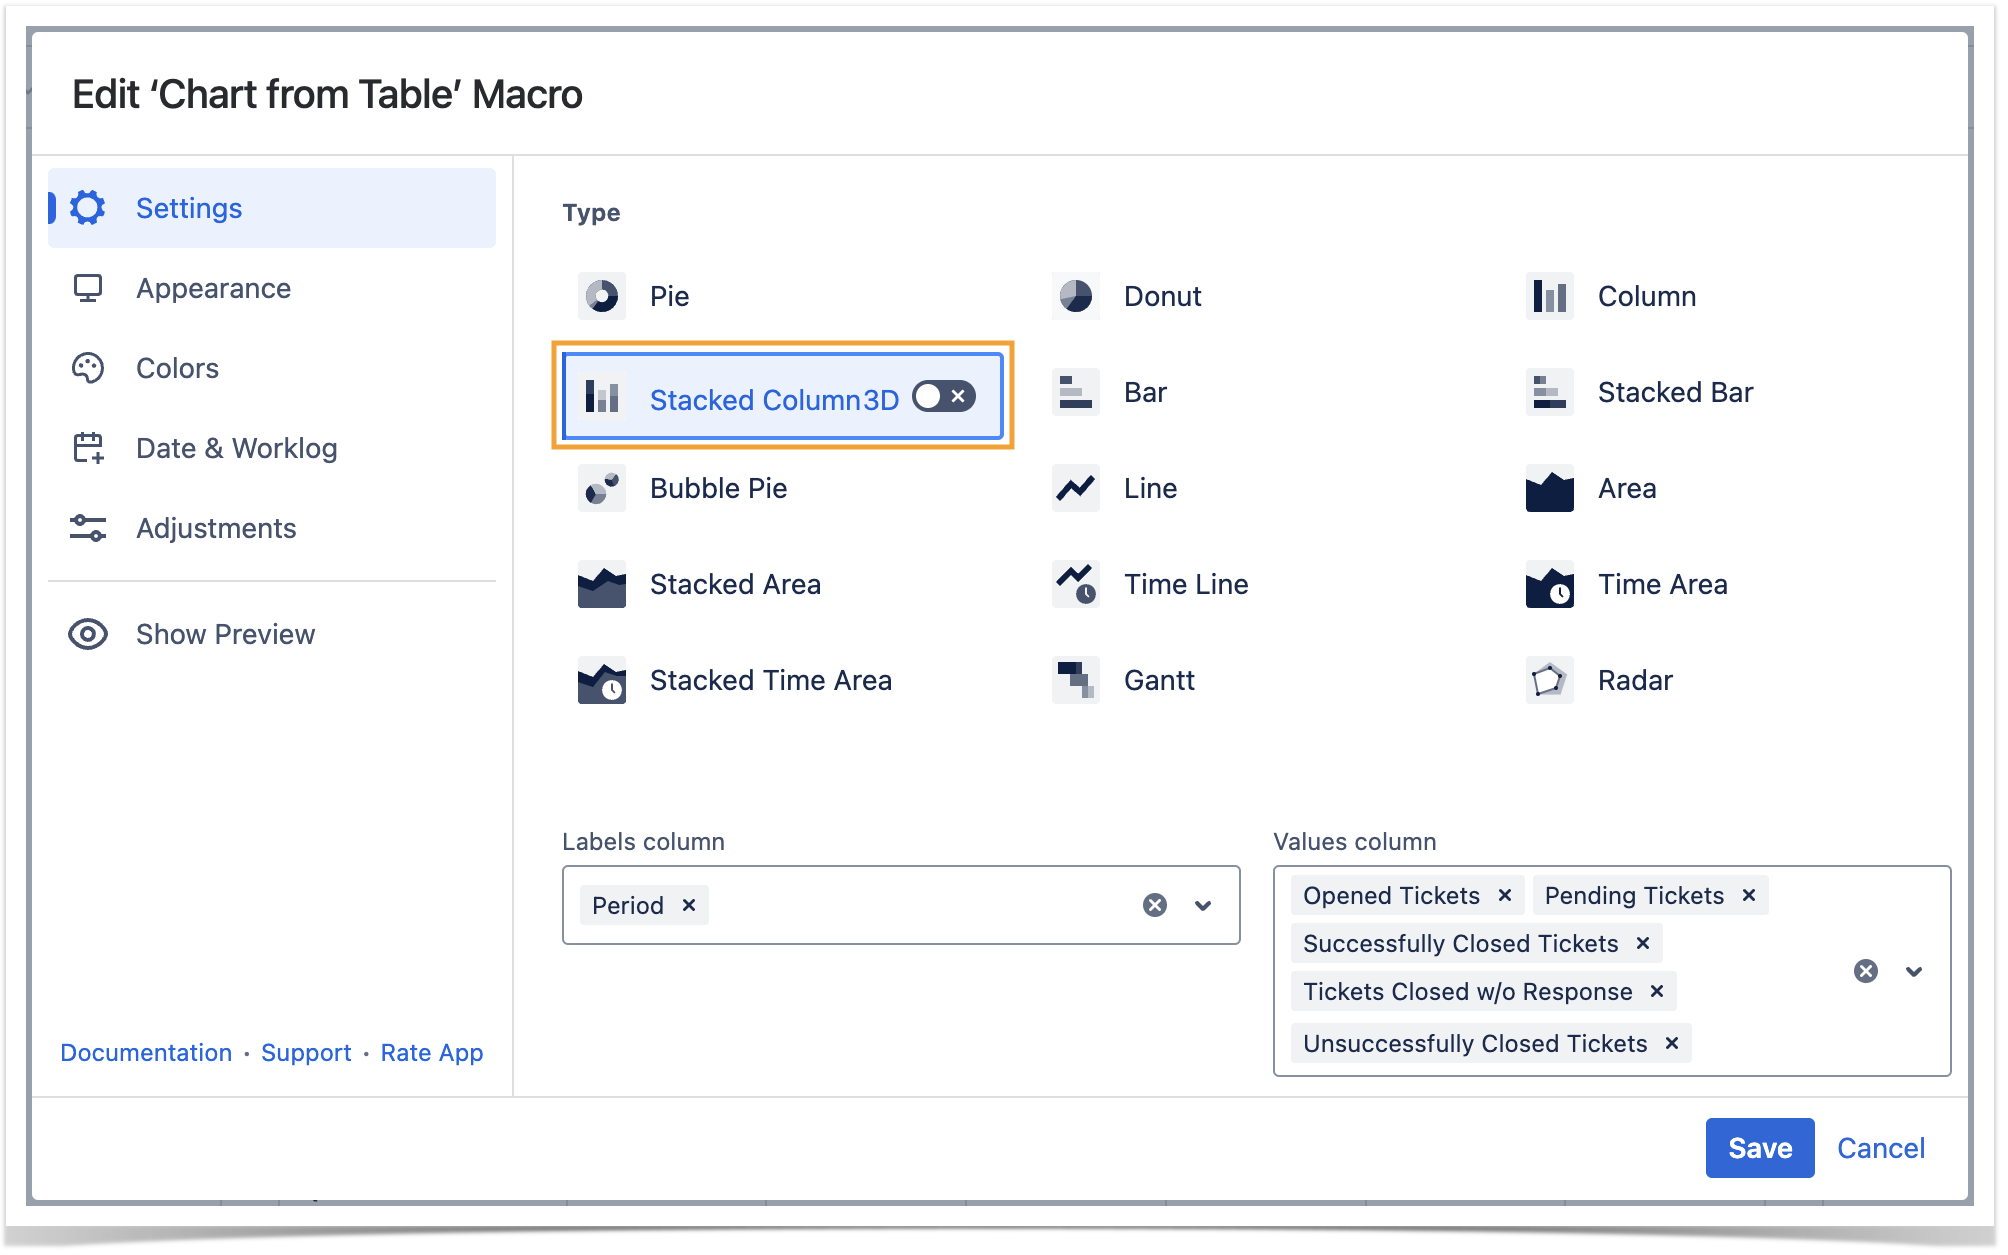
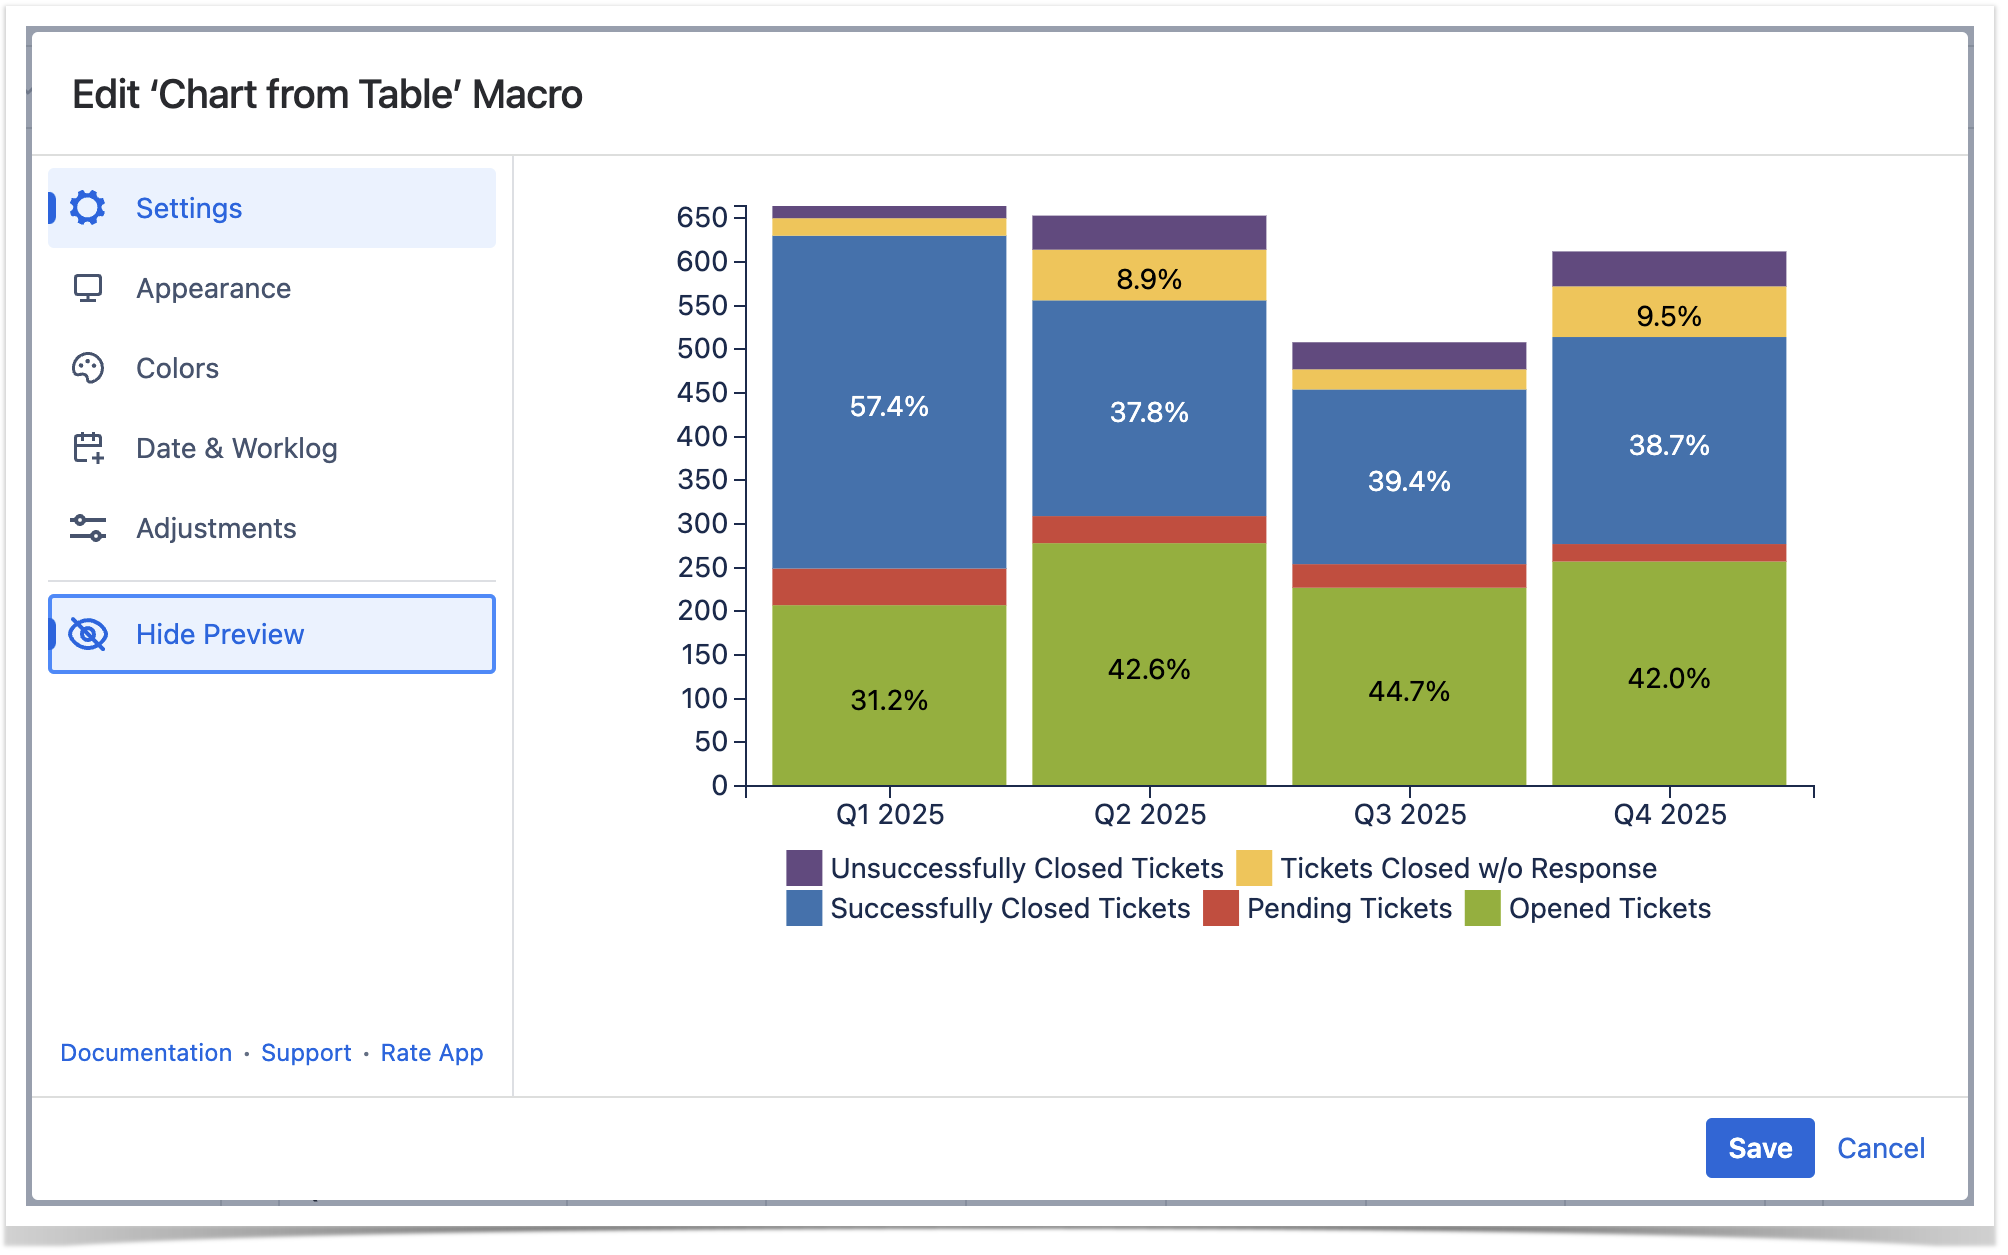
Select the chart type
To select the chart type in the page view mode:
- Insert the Chart from Table macro.
- Hover over the chart controls on the right of the table.
- Locate the Type option and select the chart type. The chart will be automatically regenerated.
- To save the modifications in the macro body, click the cogwheel icon and select Save changes.
To select the chart type in the macro browser:
- Switch the page to the edit mode.
- Insert the Chart from Table macro and paste the table within the macro body.
- Select the macro and click Edit.
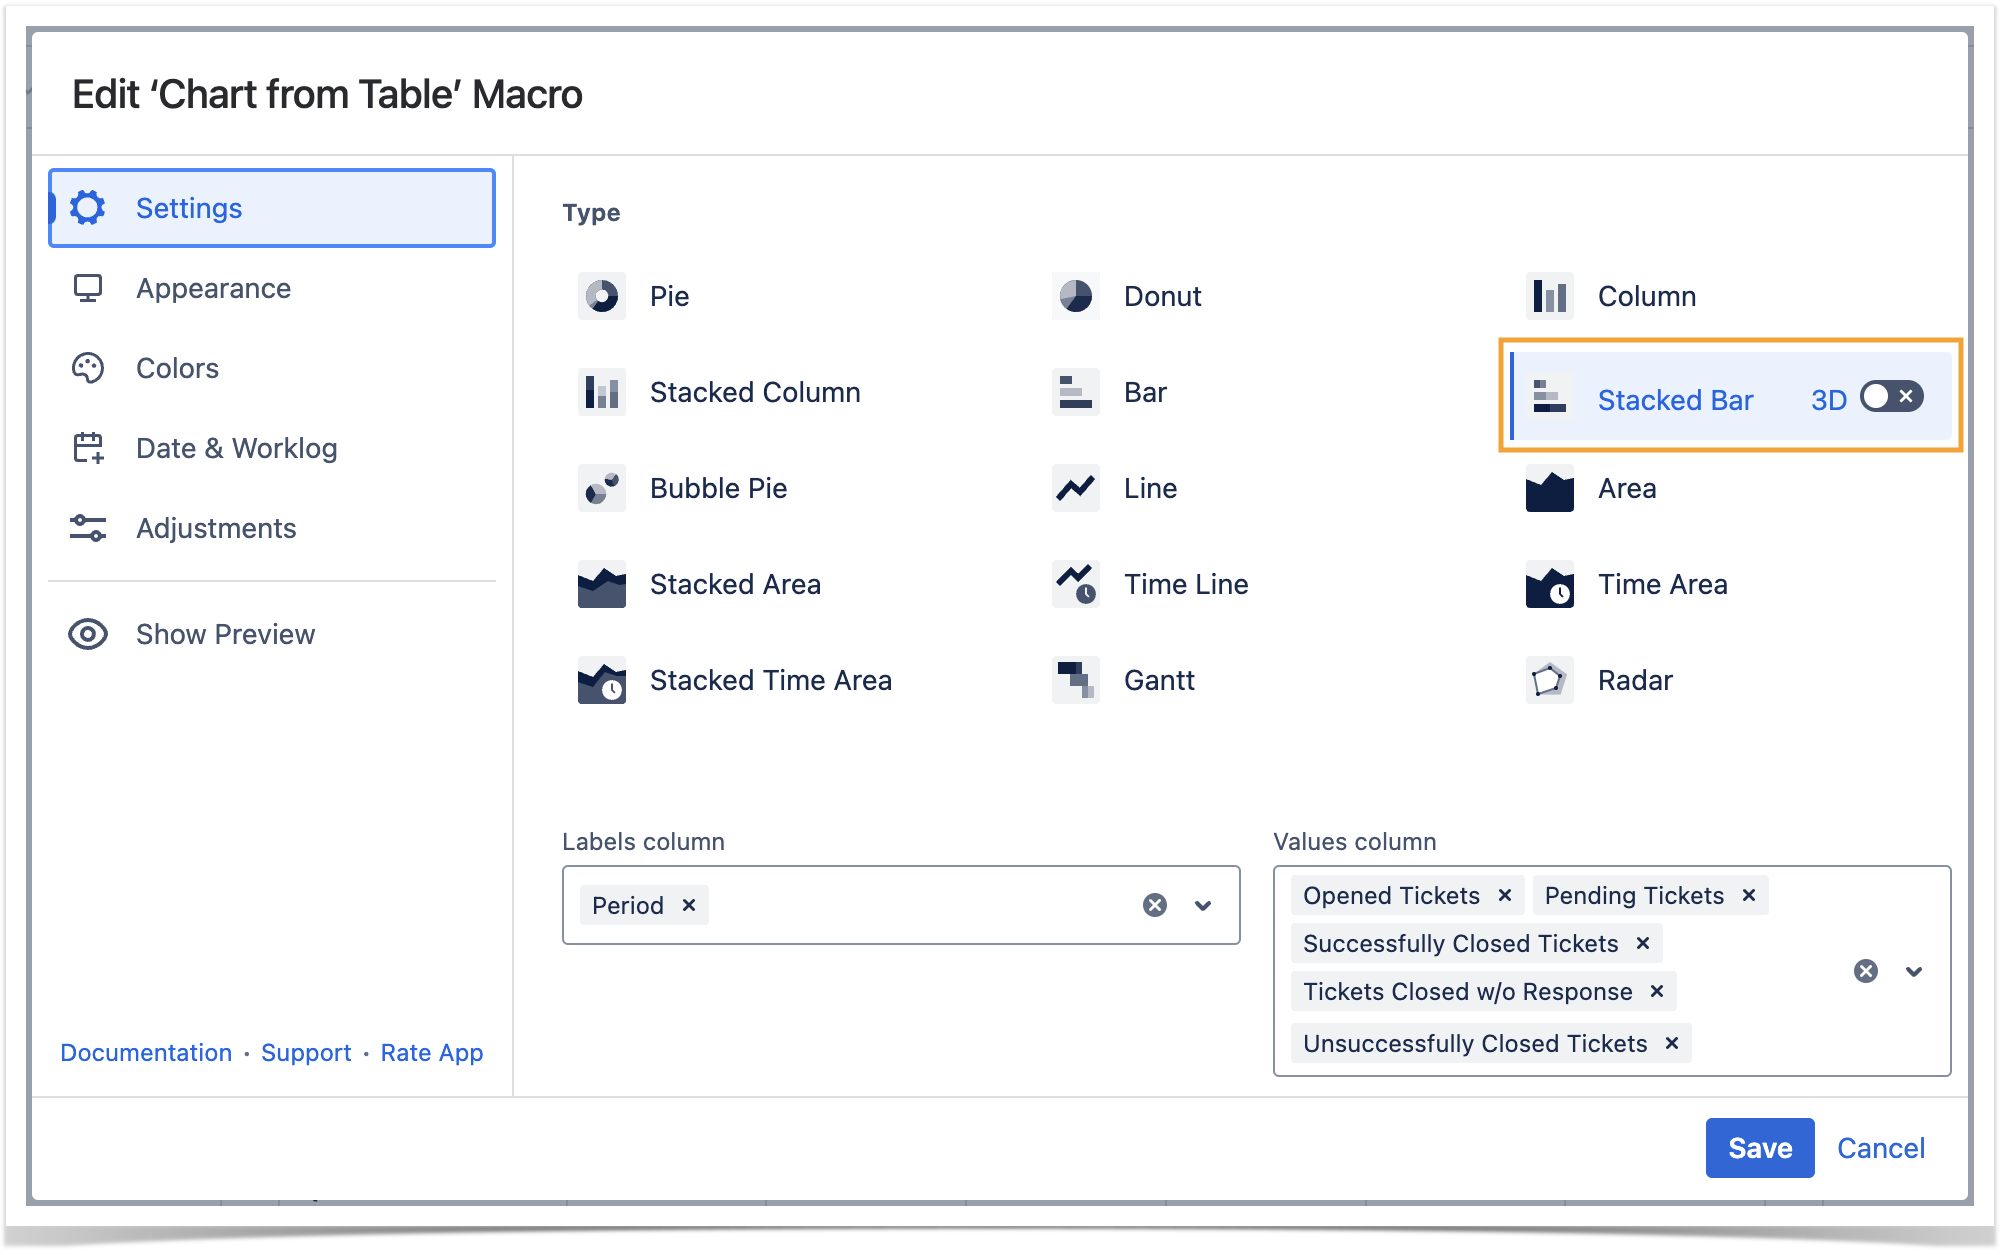
- Locate the Type option in the Settings tab and select the chart type.
- Save the macro and the page.
| Handy Carousel | ||
|---|---|---|
| ||
|
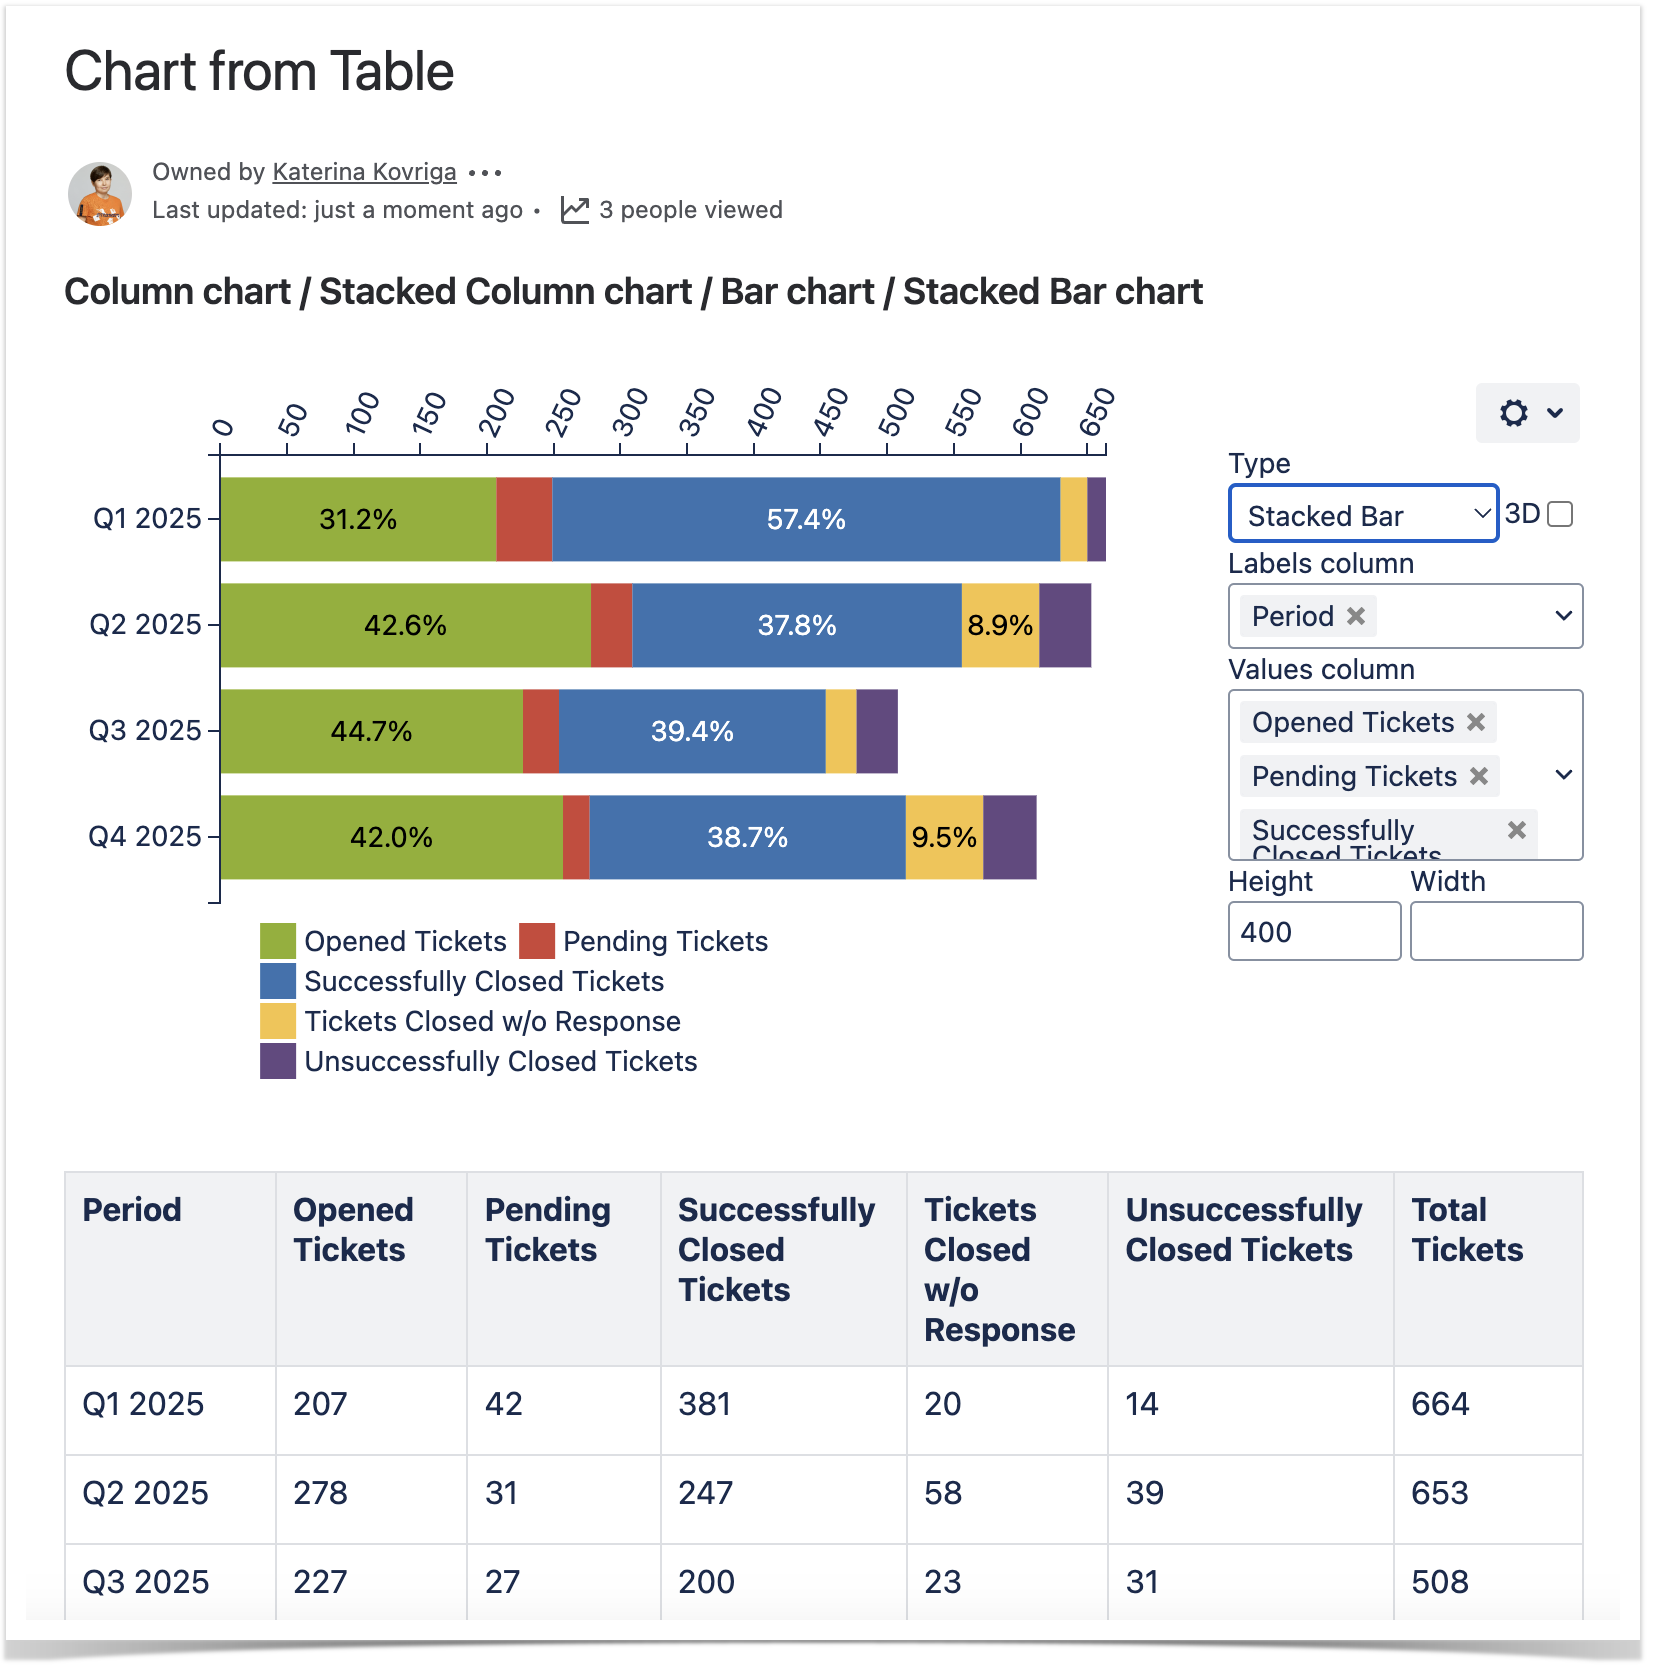
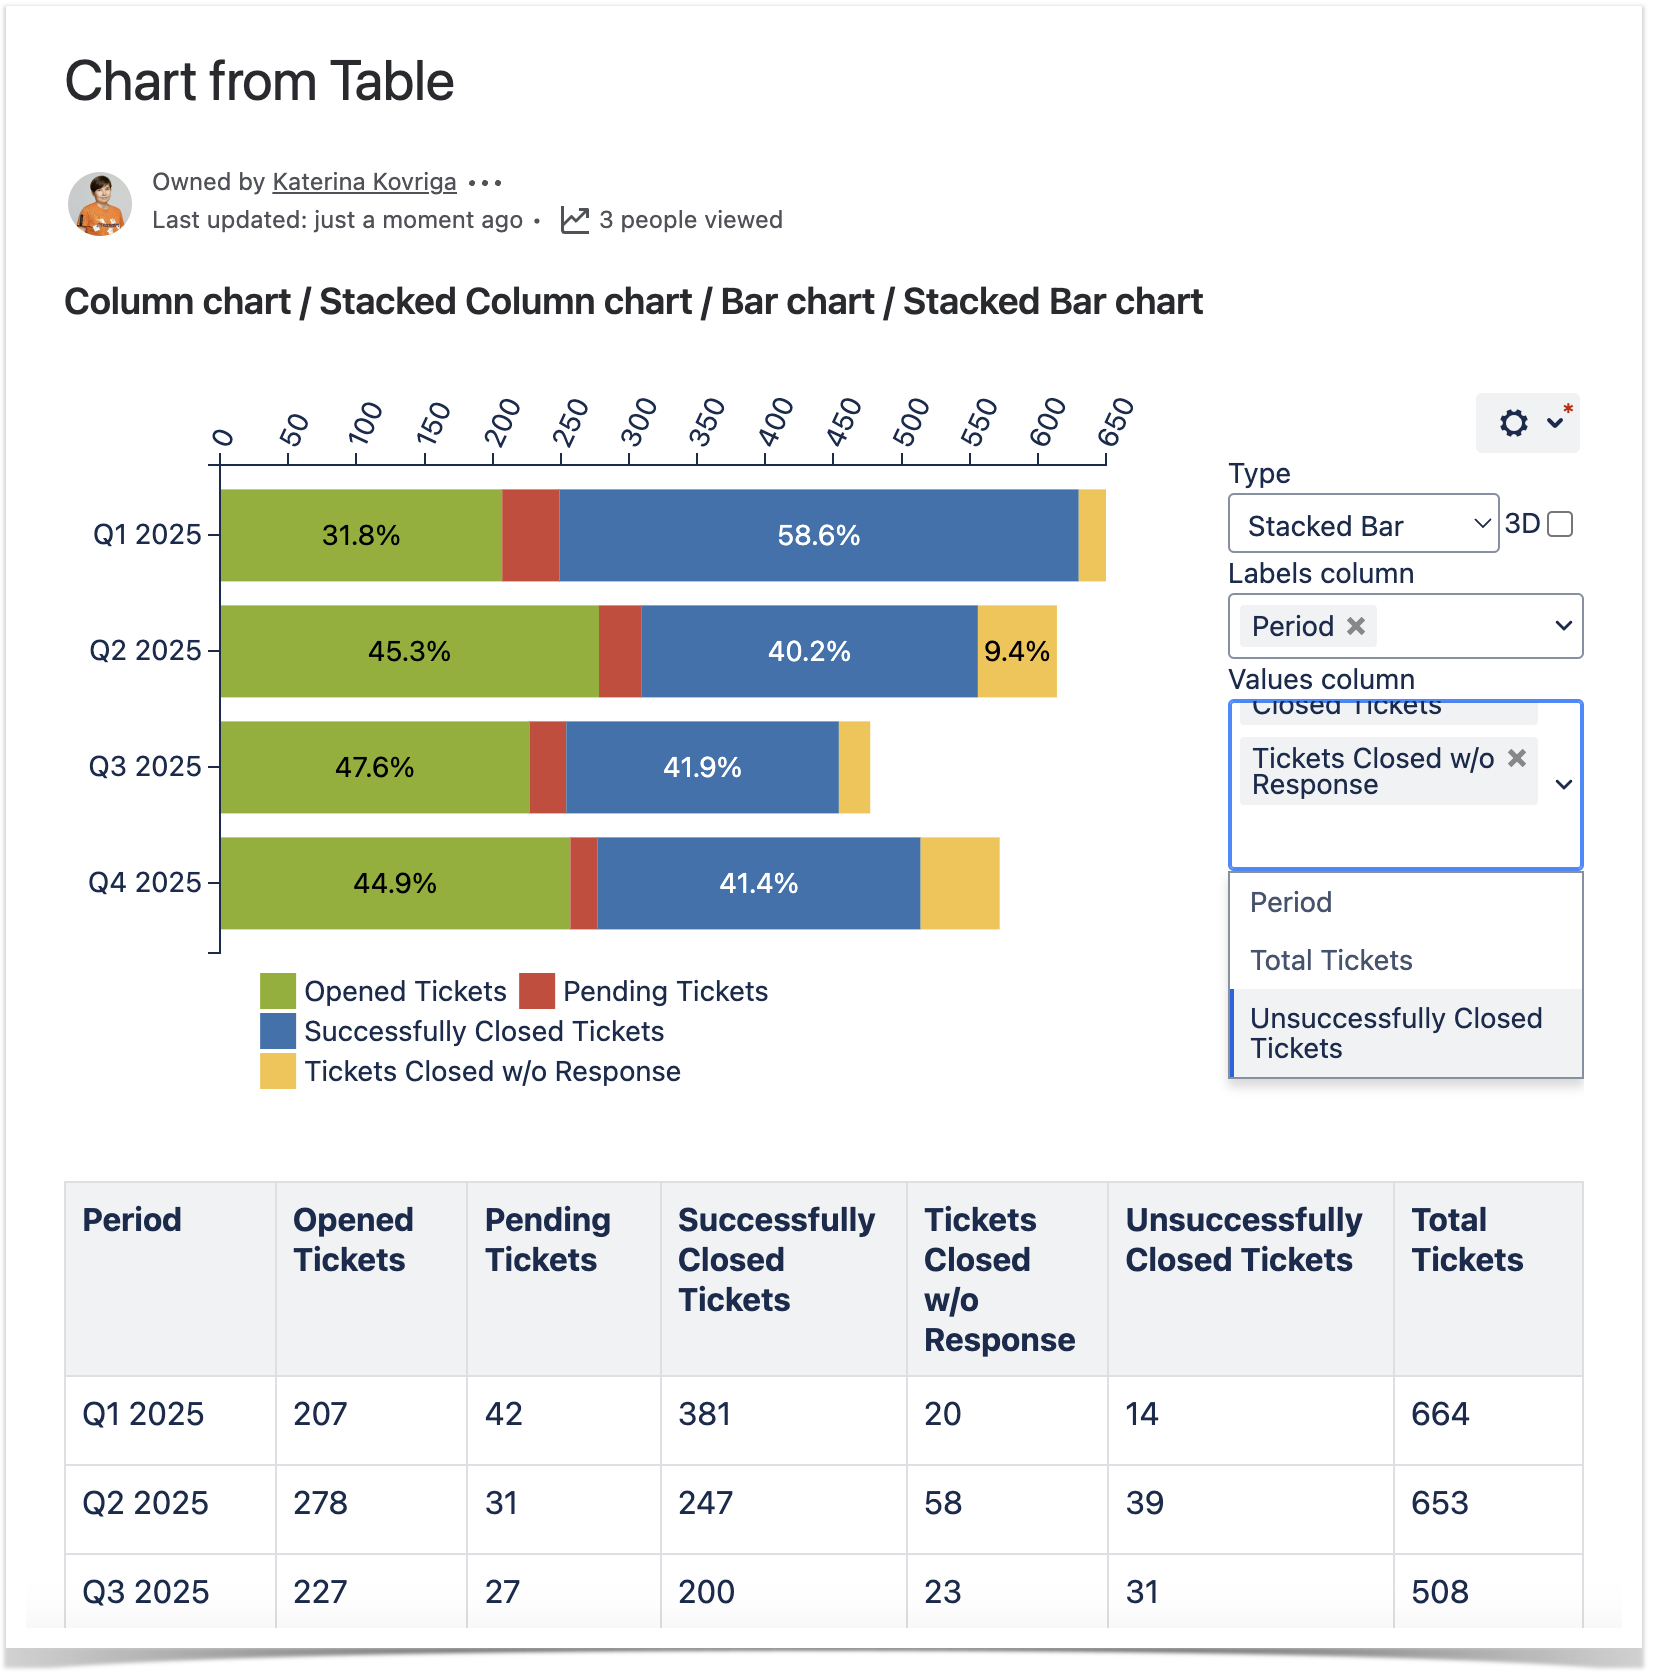
Select data series
Labels column - the column containing labels for data values.
Values column - the column or columns containing numerical values for chart generation.
To select data series in the page view mode:
- Insert the Chart from Table macro.
- Hover over the chart controls on the right of the table.
- Locate theLabels column andValues column options and select the table columns containing data for chart generation. The chart will be automatically regenerated.
- To save the modifications in the macro body, click the cogwheel icon and select Save changes.
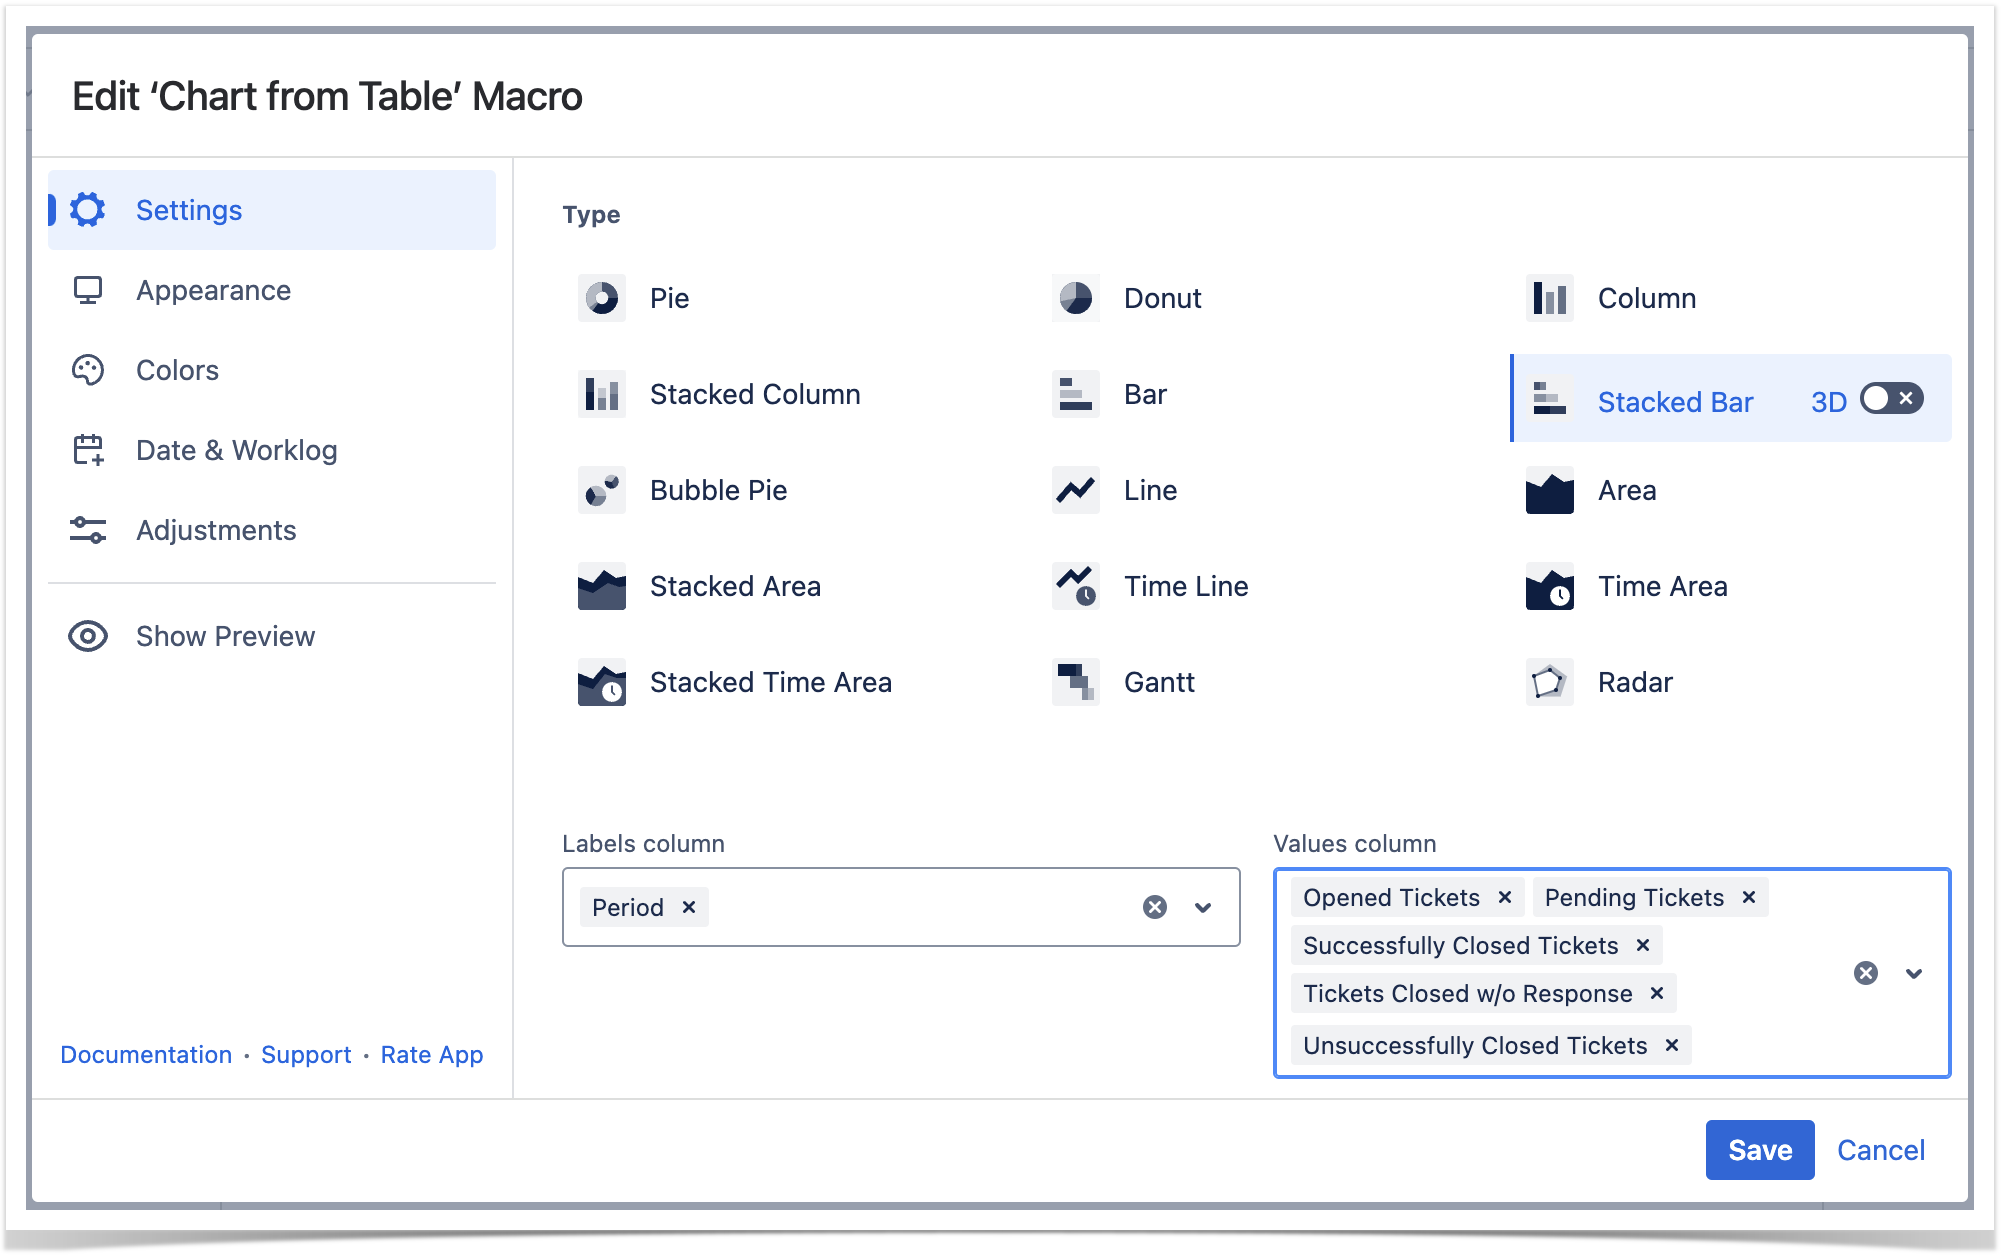
To select data series in the macro browser:
- Switch the page to the edit mode.
- Insert the Chart from Table macro and paste the table within the macro body.
- Select the macro and click Edit.
- Locatethe Labels column and Values column options in the Settings tab and select the table columns containing data for chart generation.
- Save the macro and the page.
| Handy Carousel | ||
|---|---|---|
| ||
|
Adjustments Tab
Set the decimal separator
- Switch the page to the edit mode.
- Select the macro and click Edit.
- Switch to the Adjustments tab.
- Locate the Decimal separator option.
- Specify the correct decimal separator for numeric values in the source table (point or comma).
- Save the macro and the page.
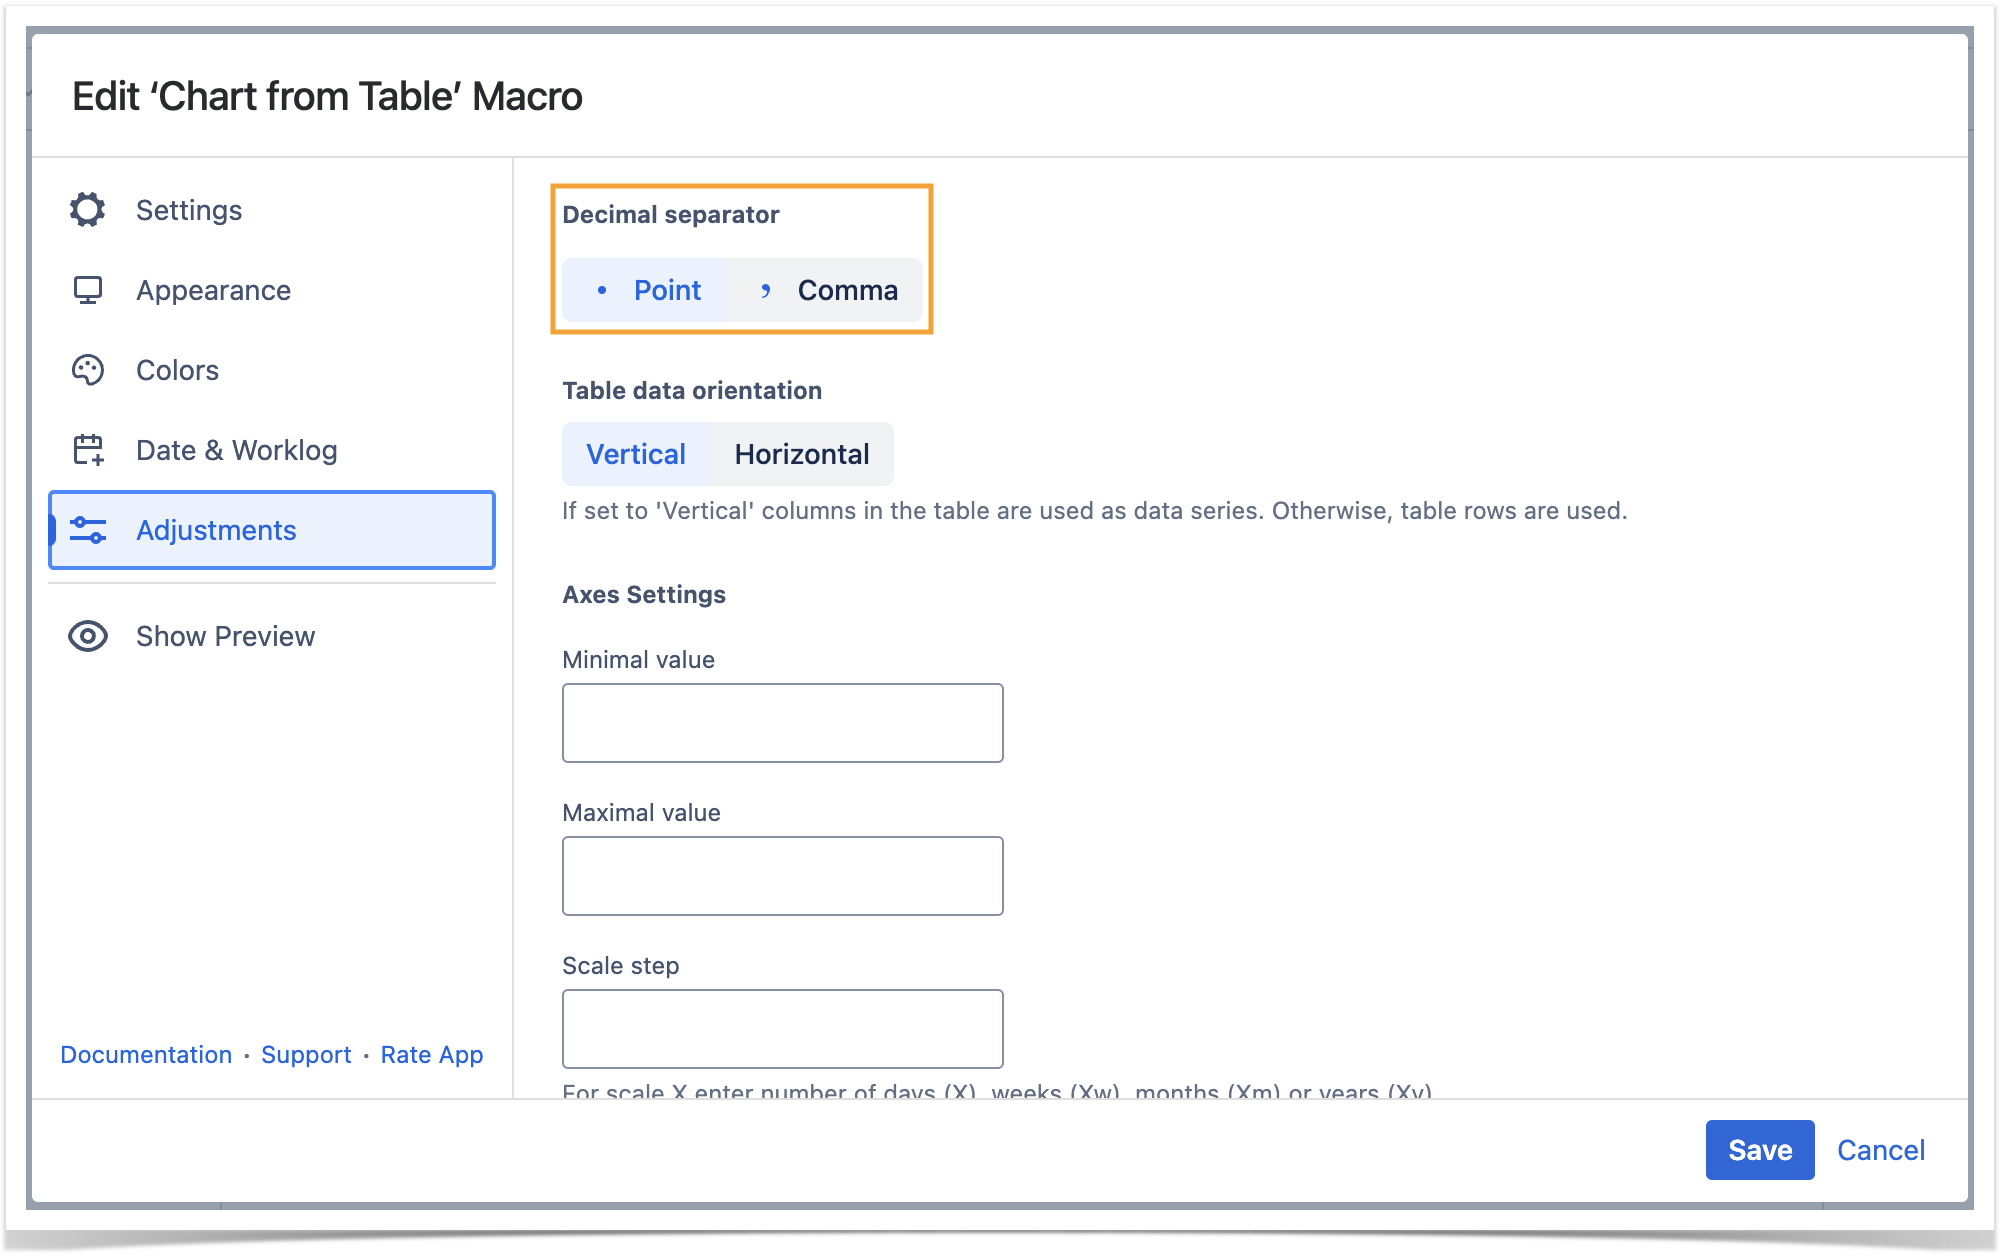
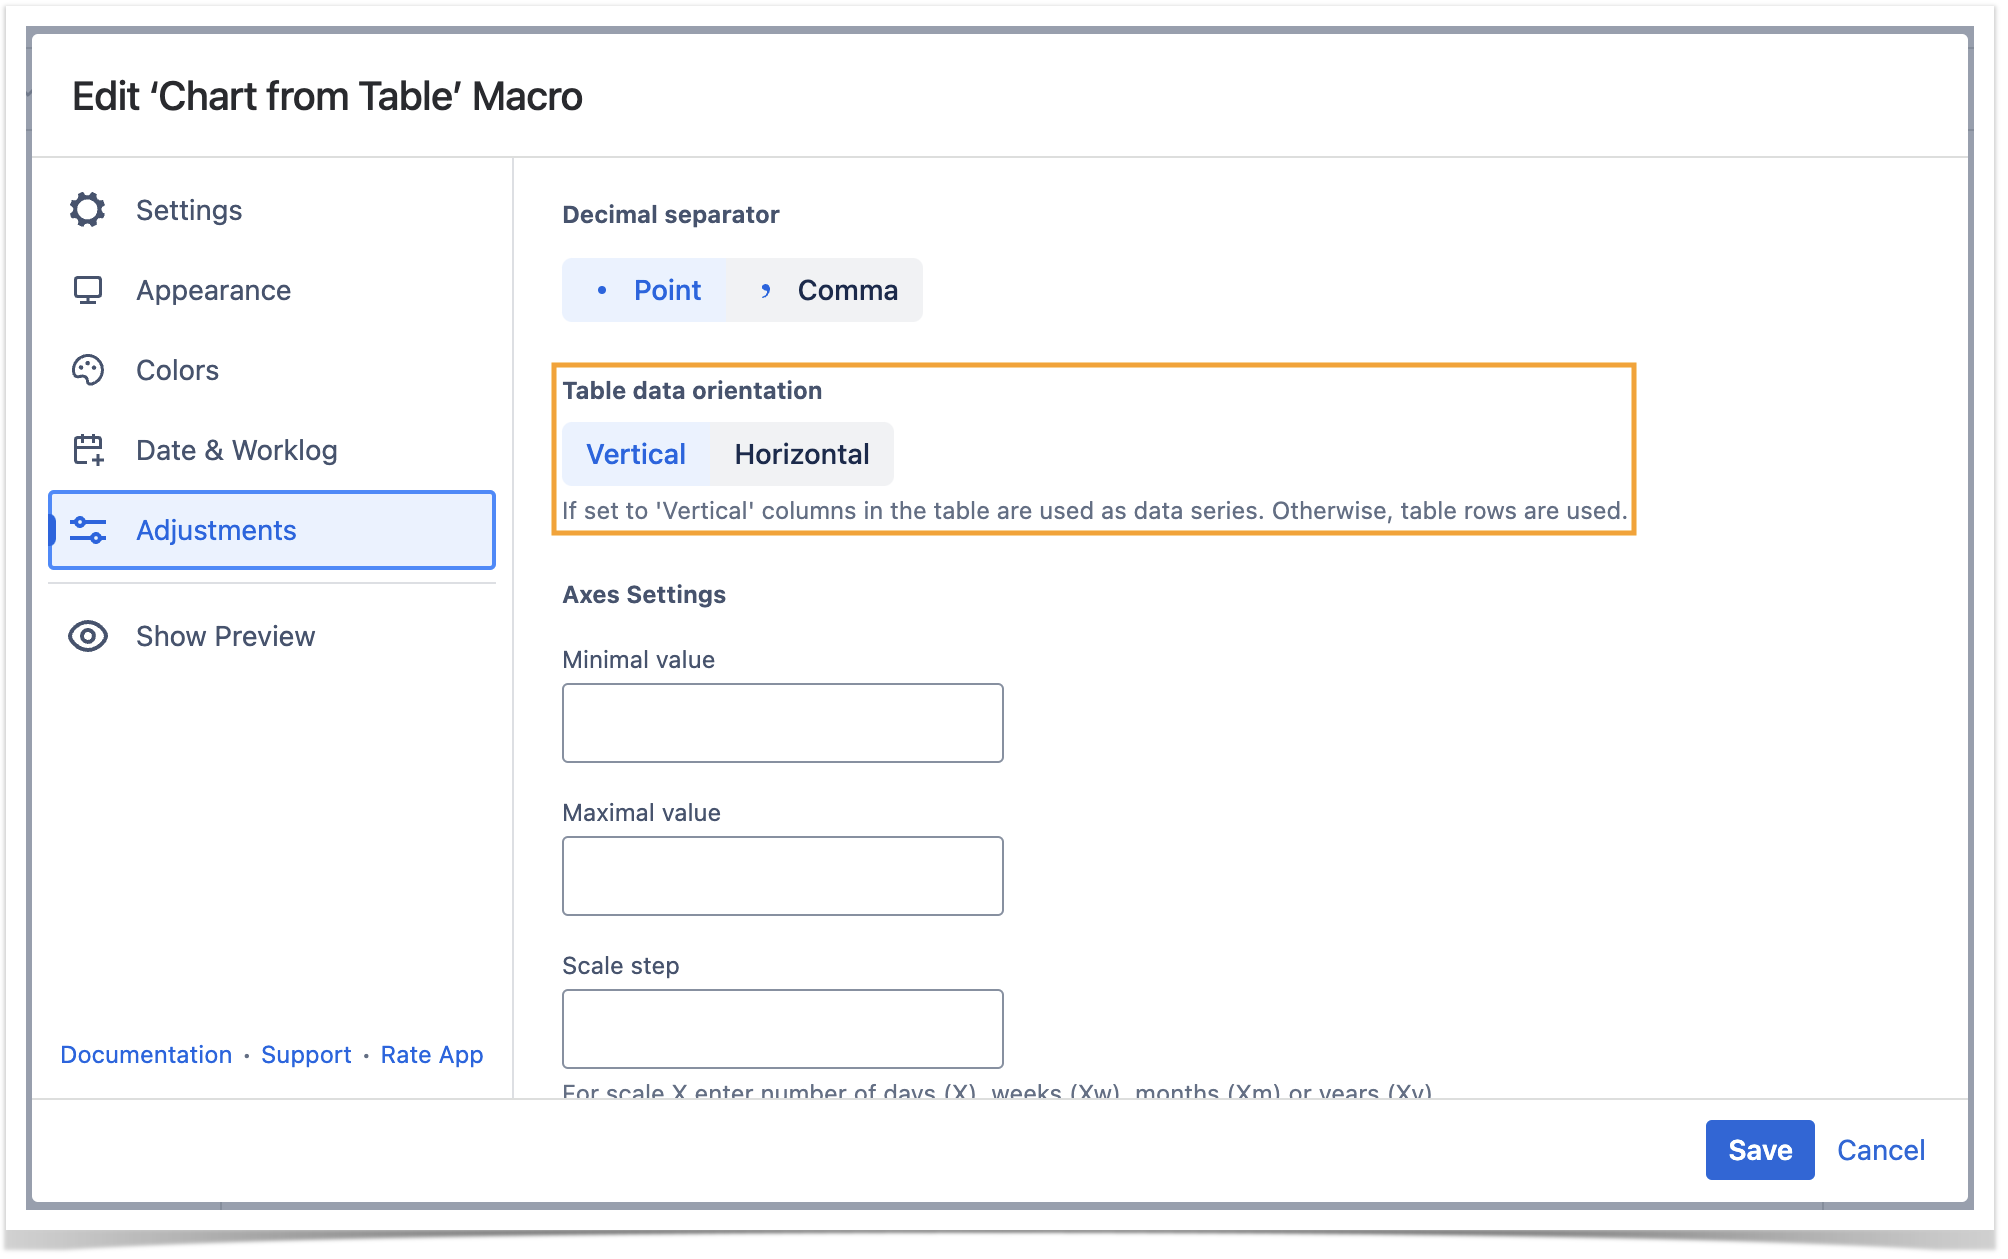
Set the table data orientation
- Switch the page to the edit mode.
- Select the macro and click Edit.
- Switch to the Adjustments tab.
- Locate the Table data orientation option.
- Select the Vertical or Horizontal option.
- Save the macro and the page.
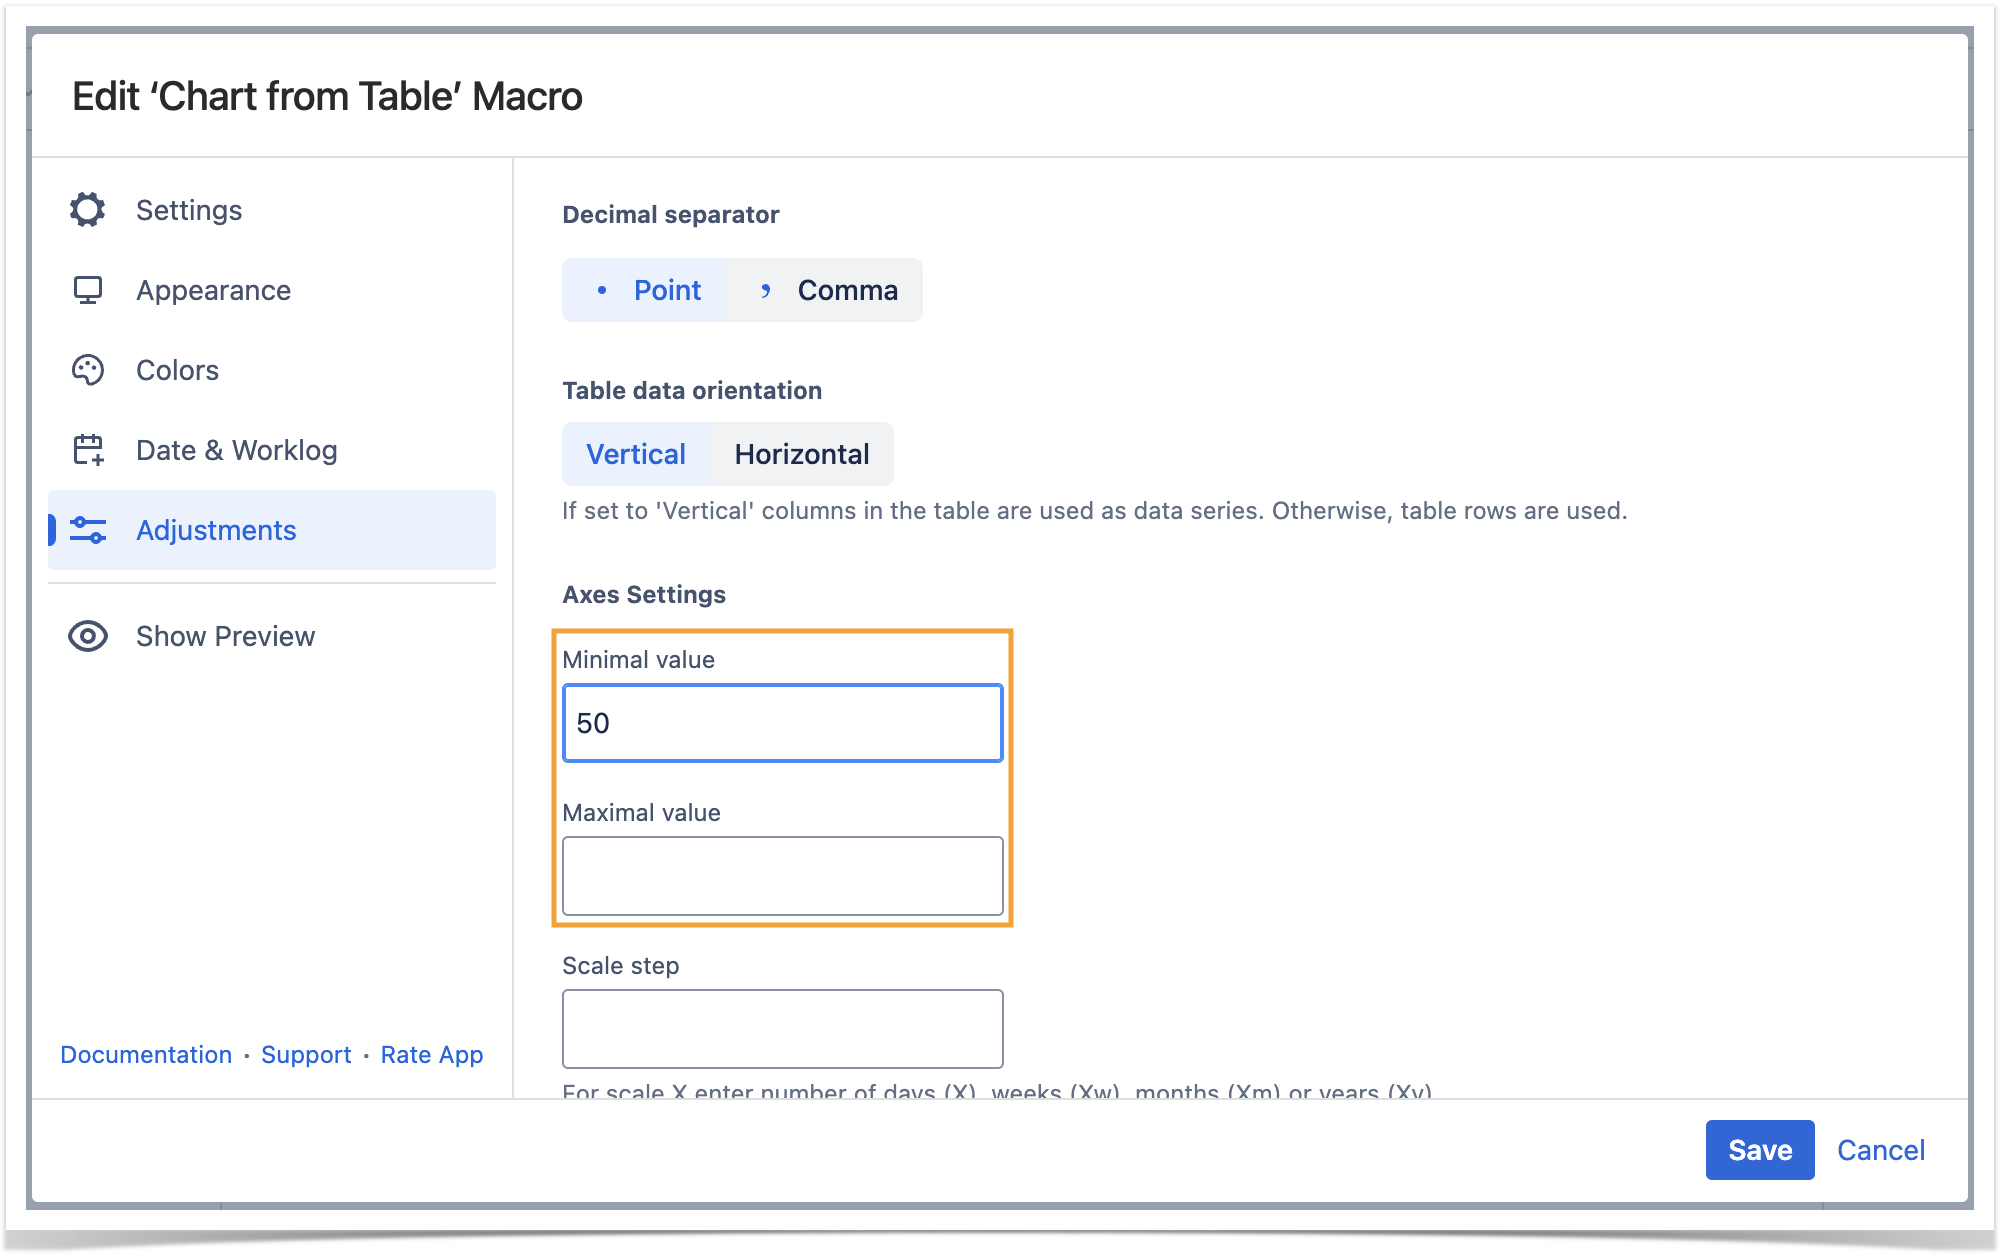
Set the minimal and maximal values
Minimal value - the minimal value for showing only data values greater than the specified minimal value.
Maximal value - You can specify the maximal value for showing only data values not greater than the specified maximal value.
- Switch the page to the edit mode.
- Select the macro and click Edit.
- Switch to the Adjustments tab.
- Locate the Minimal and Maximal value options and set the values.
- Save the macro and the page.
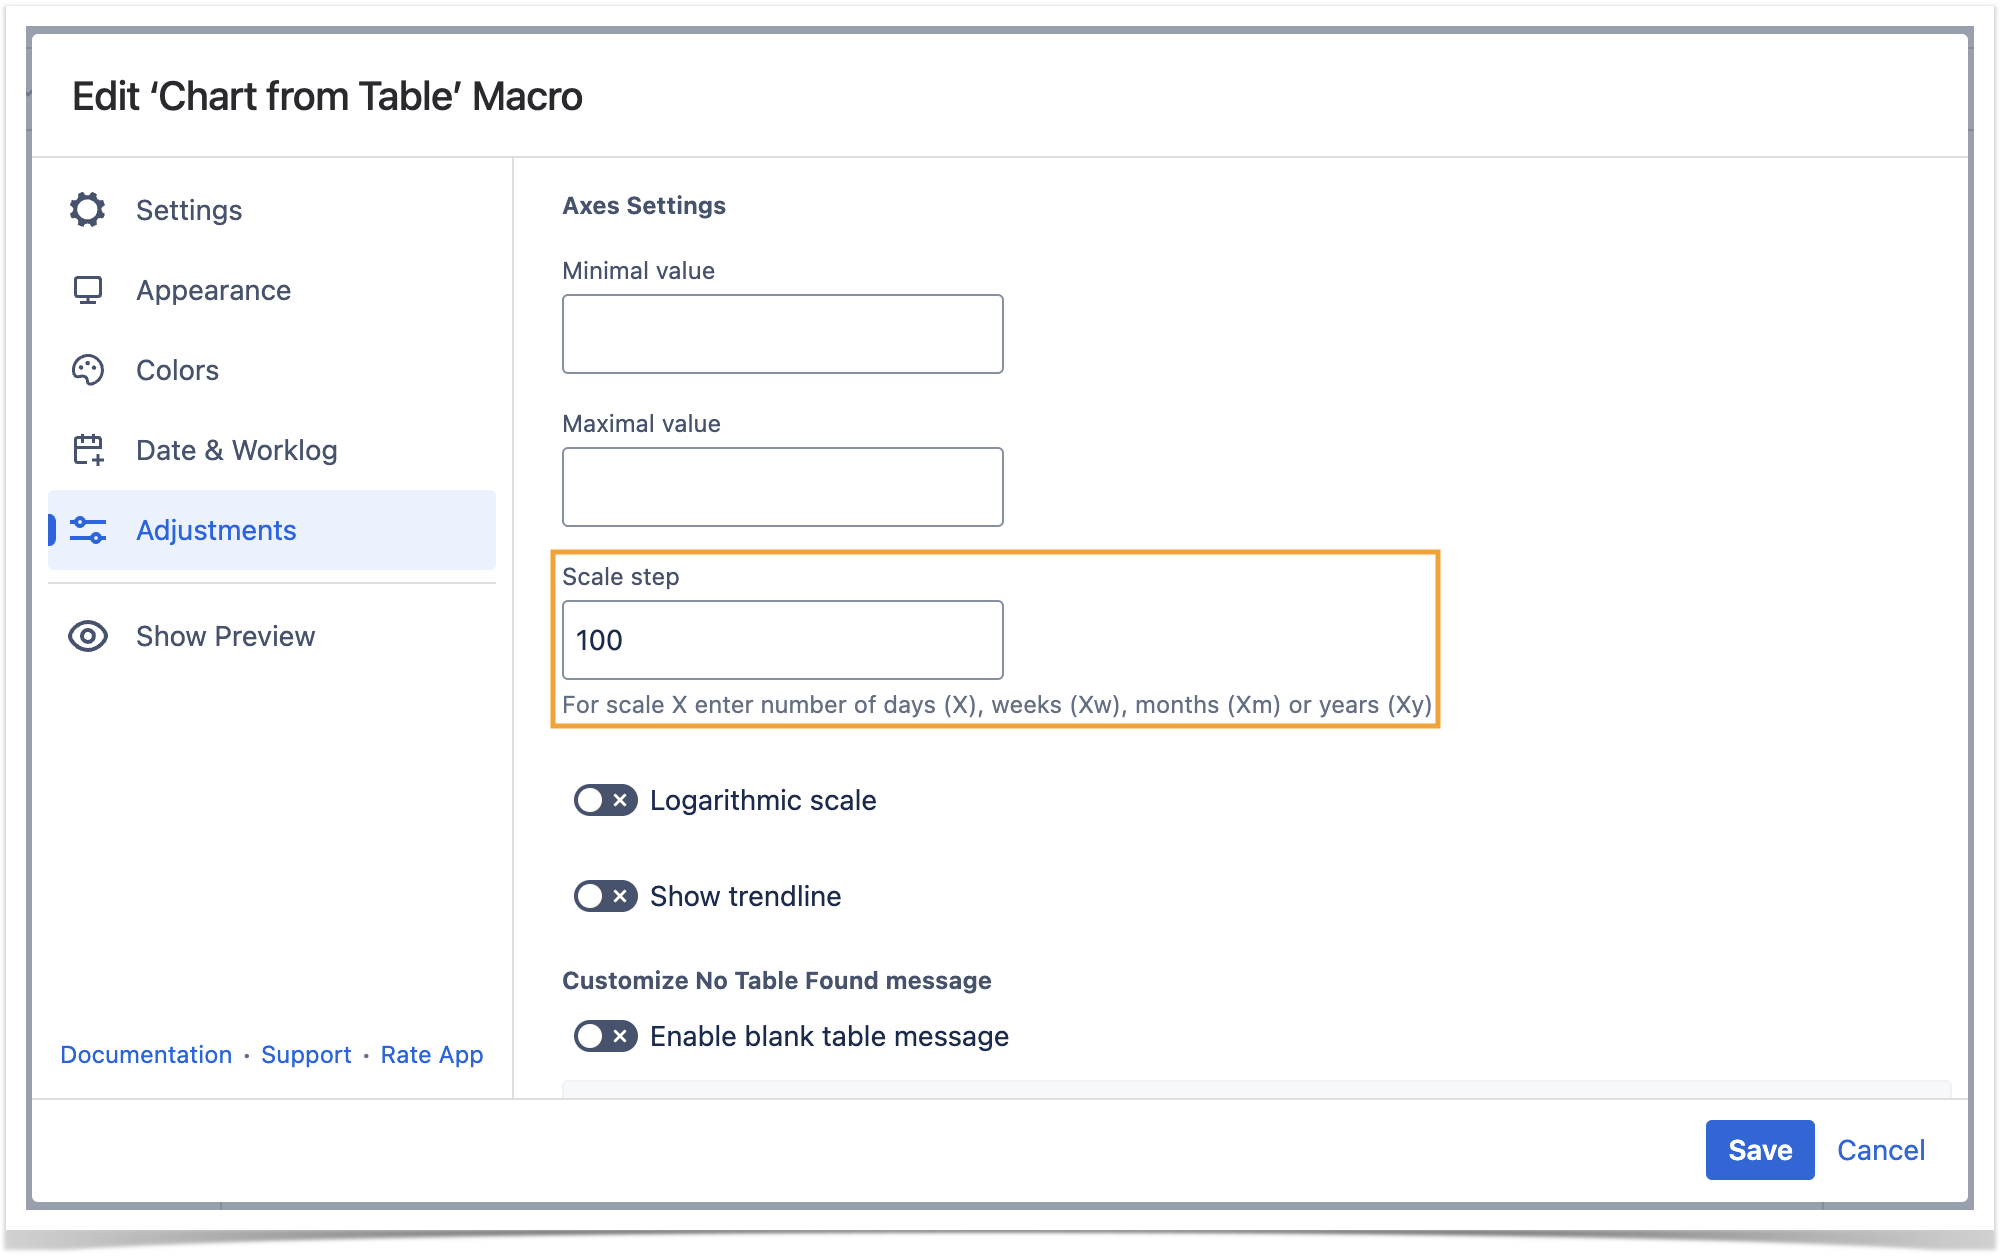
Set the scale step
Scale Step - the required scale step for showing the numeric values in the chart.
- Switch the page to the edit mode.
- Select the macro and click Edit.
- Switch to the Adjustments tab.
- Locate the appropriate option depending on the chart type and set the scale step.
- Save the macro and the page.
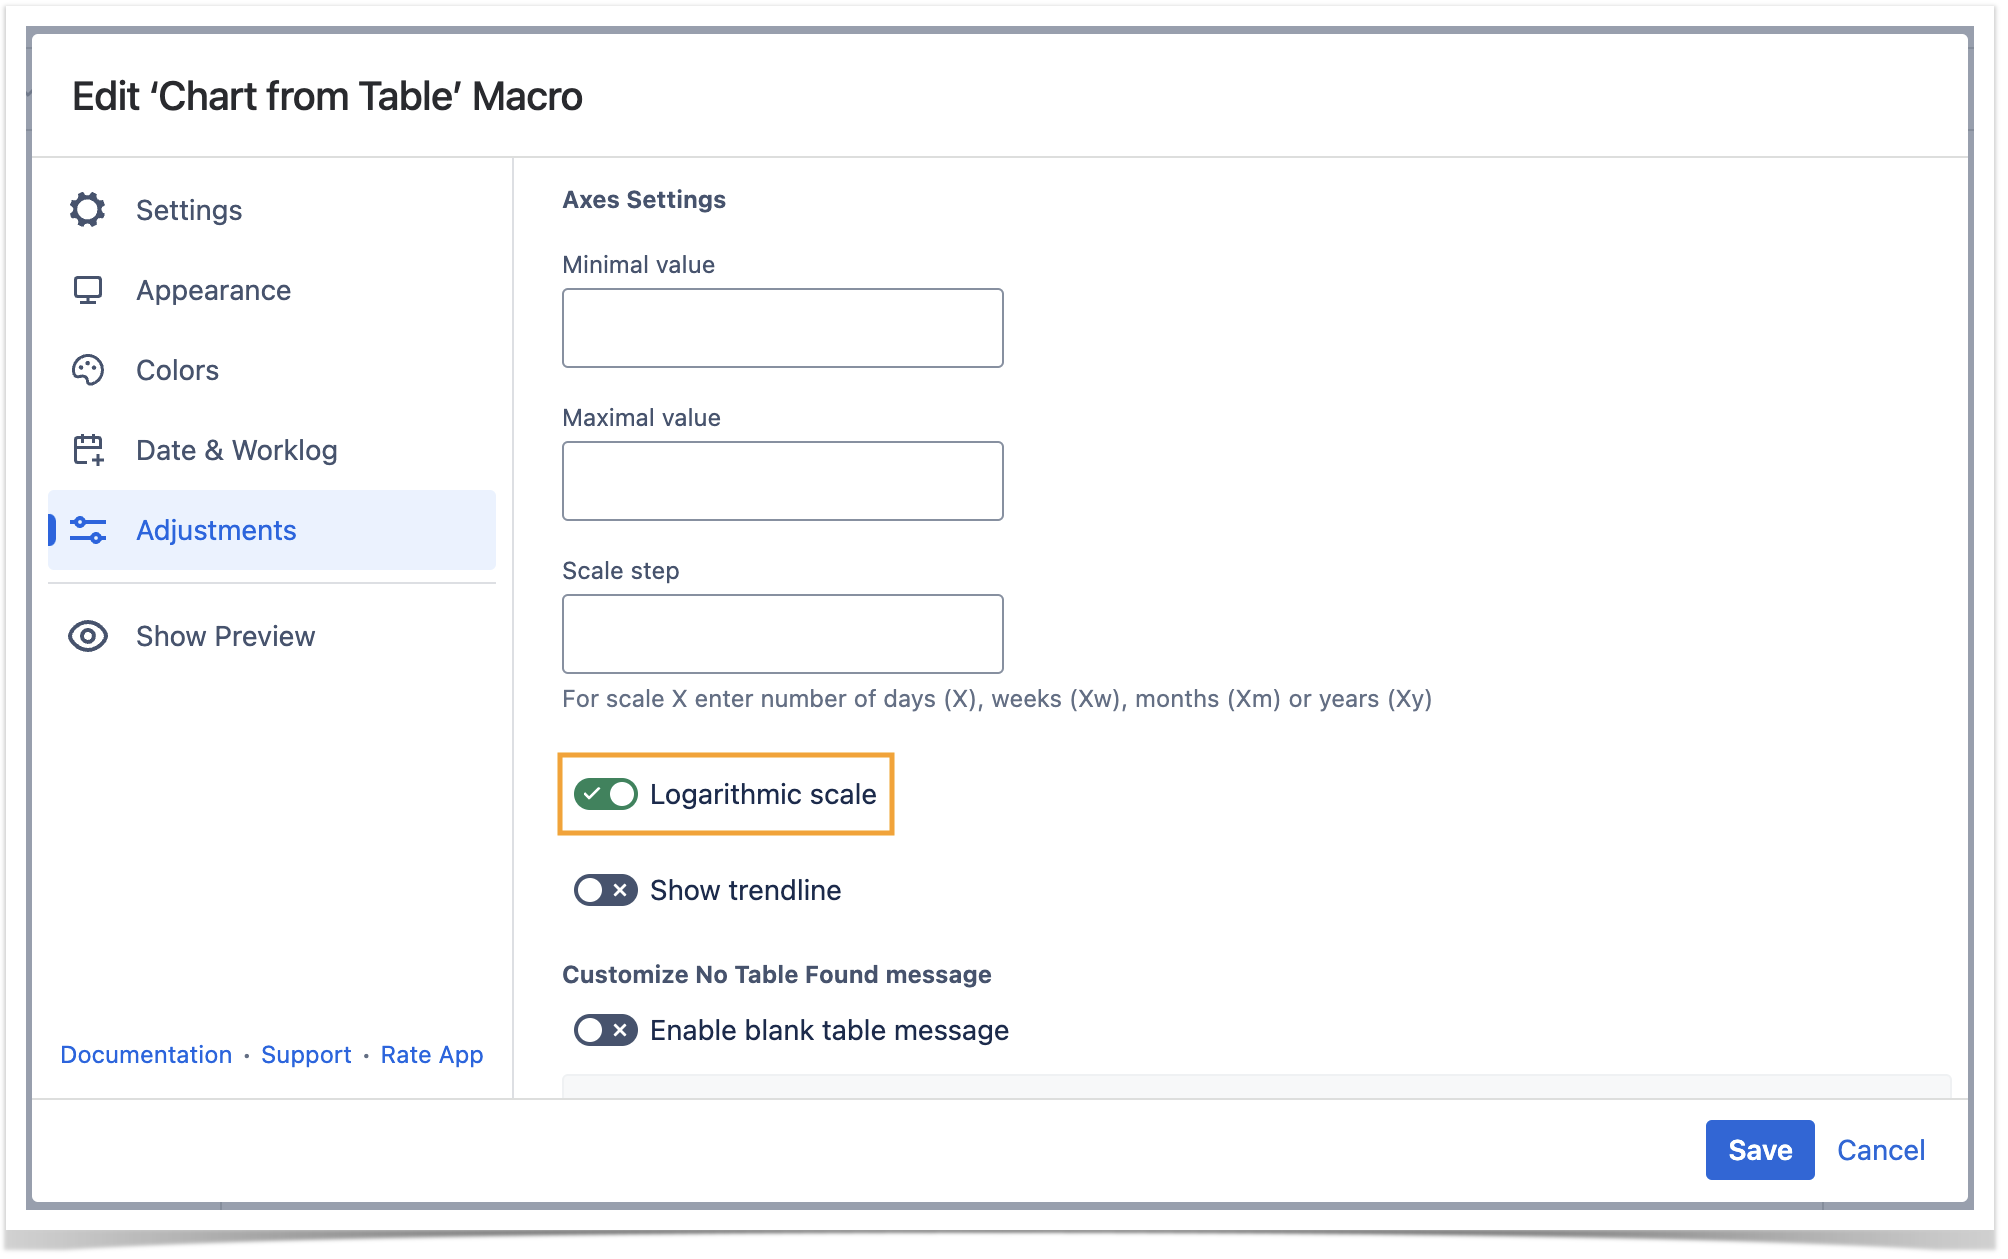
Set the logarithmic scale
Logarithmic Scale - the option for very small or very large numeric values that cannot be properly aligned on the standard arithmetic scale.
- Switch the page to the edit mode.
- Select the macro and click Edit.
- Switch to the Adjustments tab.
- Locate the Logarithmic Scale option and enable the option.
- Save the macro and the page.
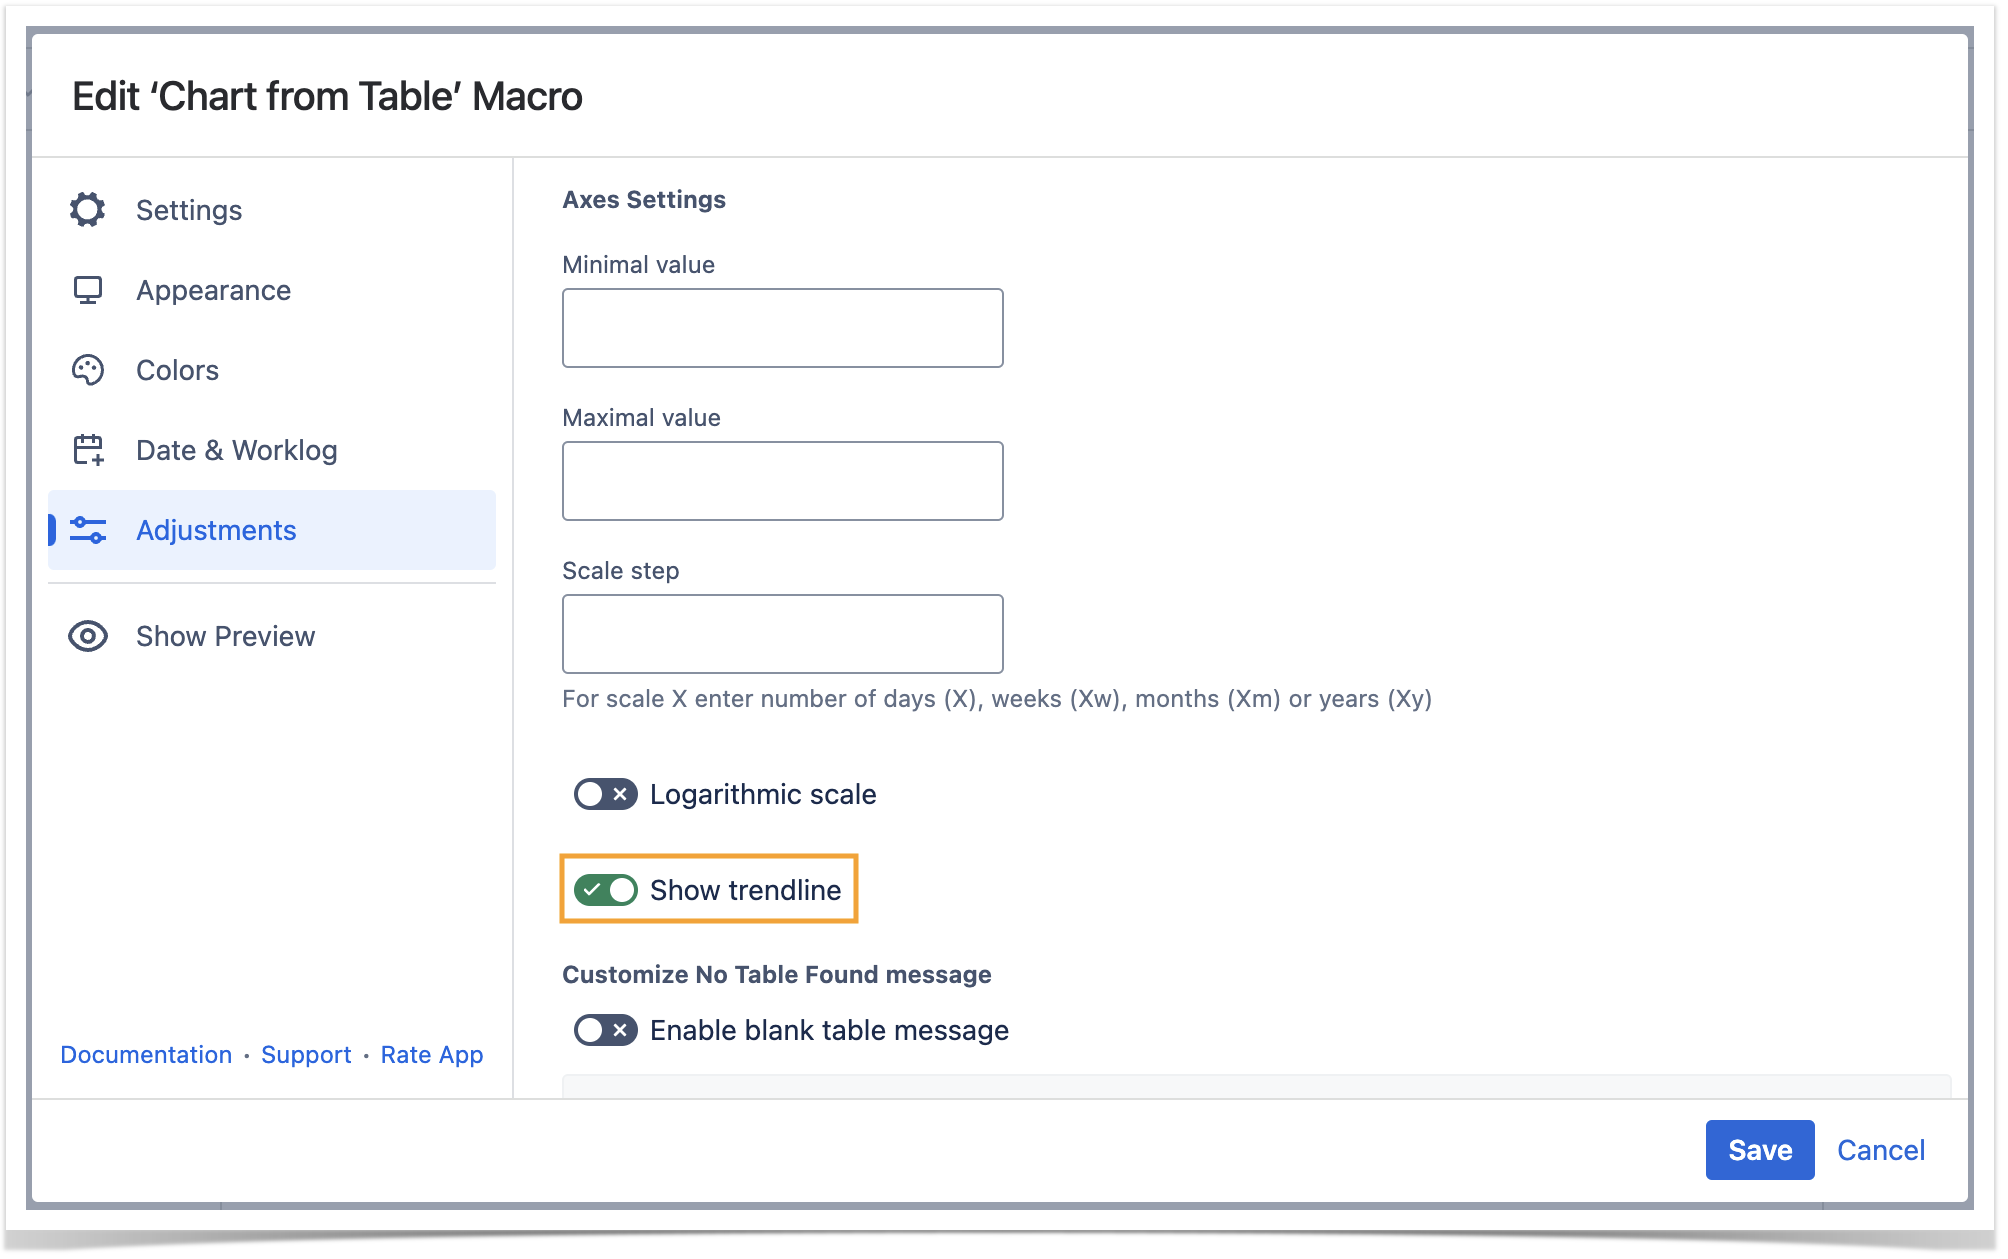
Show trendline
- Switch the page to the edit mode.
- Select the macro and click Edit.
- Switch to the Adjustments tab.
- Locate and enable the Show trendline option.
- Save the macro and the page.
Date & Worklog Tab
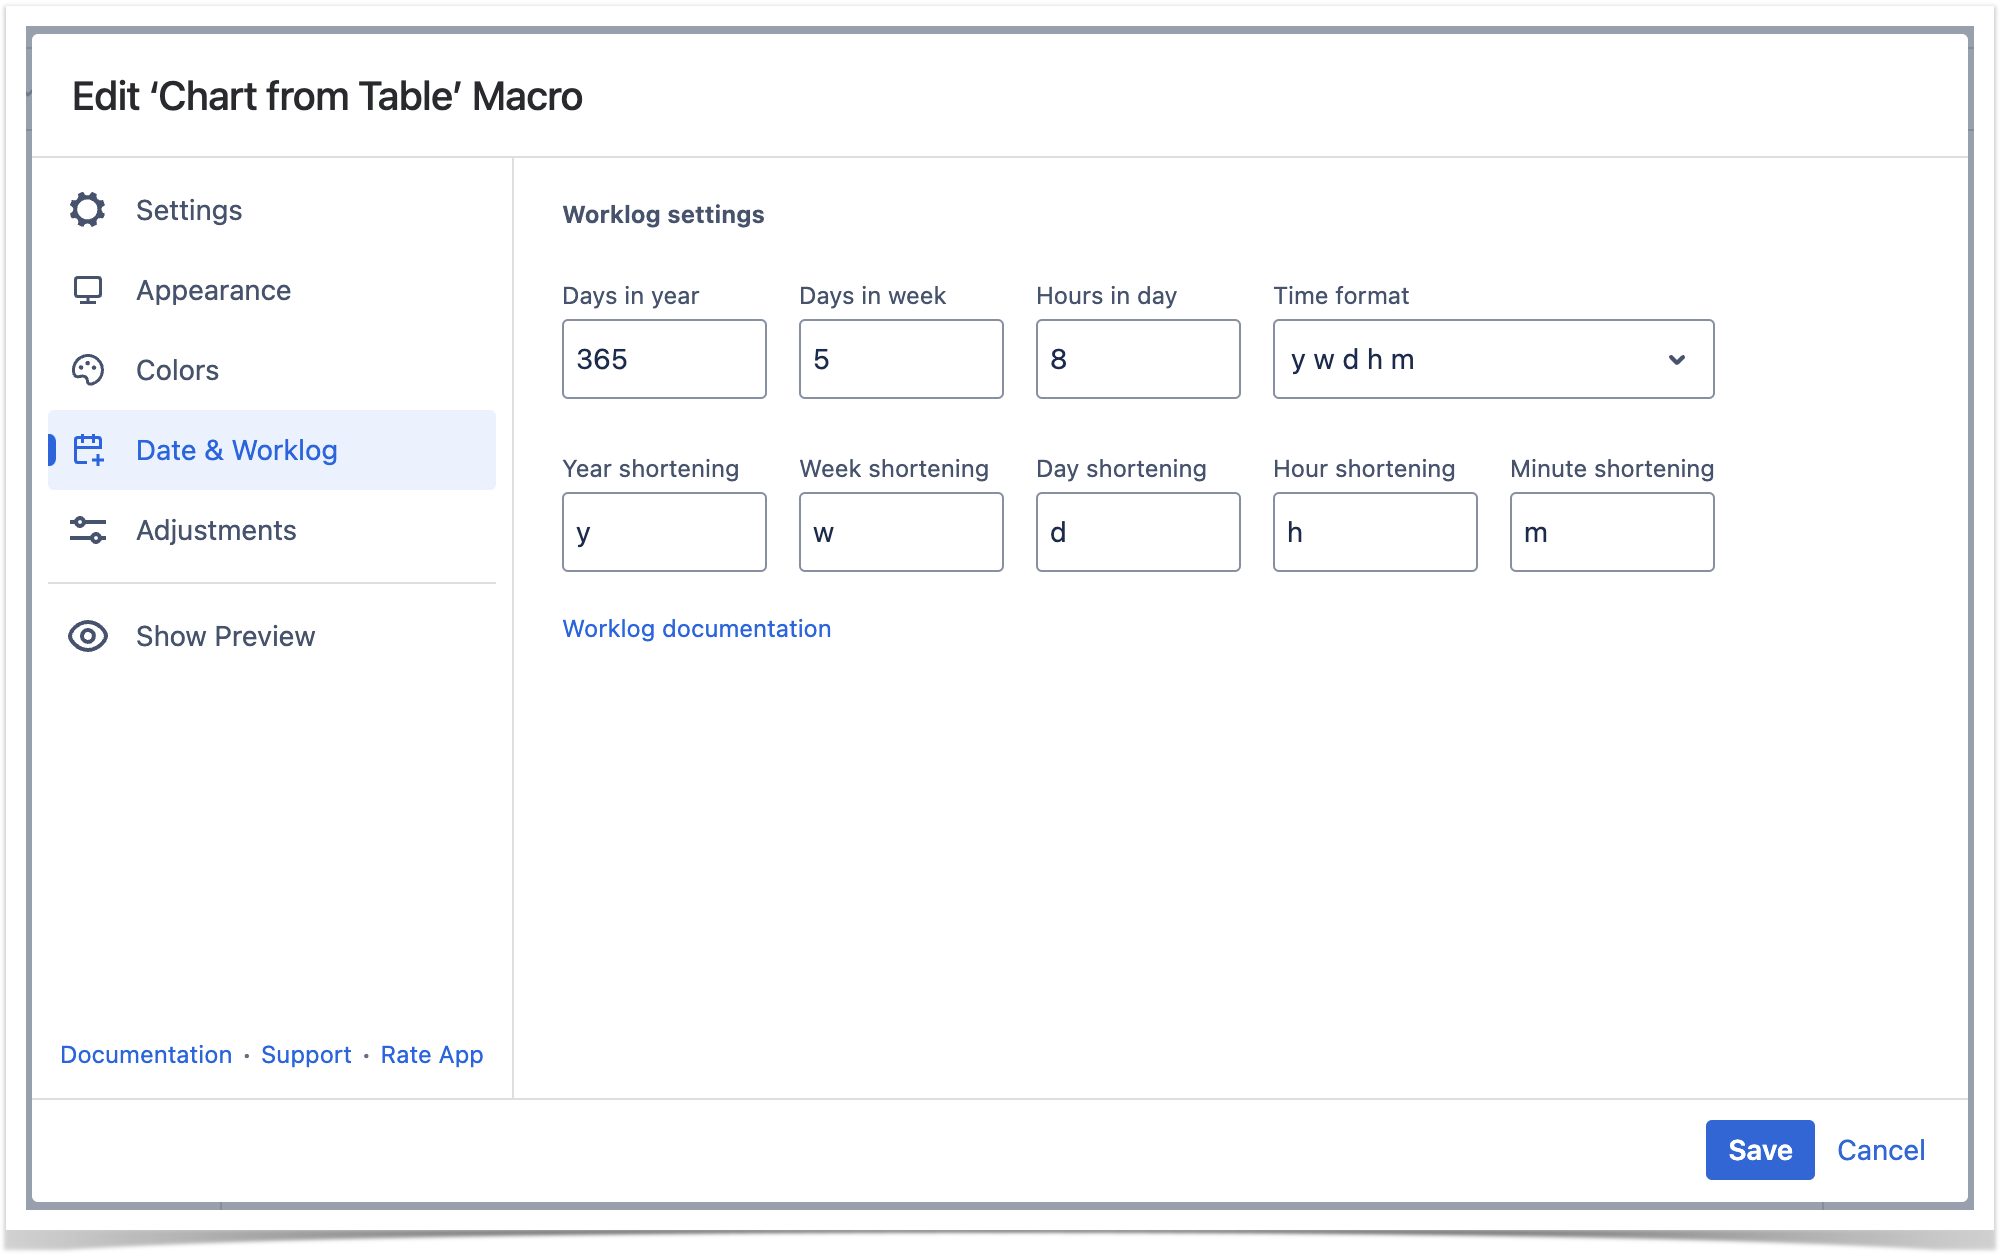
Set the worklog settings
| Info |
|---|
| Please ensure that the worklog parameters set in the macro are identical to parameters configured in Atlassian JIRA. |
- Switch the page to the edit mode.
- Select the macro and click Edit.
- Switch to the Date & Worklog tab.
- Locate the Worklog settings option.
- Define the worklog parameters, as follows:
- Days in year - enter the number of days in a year.
- Days in week - enter the number of business days in a week.
- Hours in day - enter the number of working hours in one business day.
- Time format - select the used time format in worklog values.
- Year shortening - enter the shortening for the year time unit if you use any language different from English.
- Week shortening - enter the shortening for the week time unit if you use any language different from English.
- Day shortening - enter the shortening for the day time unit if you use any language different from English.
- Hour shortening - enter the shortening for the hour time unit if you use any language different from English.
- Minute shortening - enter the shortening for the minute time unit if you use any language different from English.
- Save the macro and the page.
| Info |
|---|
| Worklog time units in different languages are denoted with different shortenings. Please adjust them according to your JIRA localization settings. |
Appearance Tab
Set the height and width of the chart
- Switch the page to the edit mode.
- Select the macro and click Edit.
- Switch to the Appearance tab.
- Locate the Height and Width fields.
- Enter the appropriate dimensions of the chart.
Save the macro and the page.
| Info |
|---|
To set the Height and Width of the chart in the page view mode:
|
| Handy Carousel | ||
|---|---|---|
| ||
|
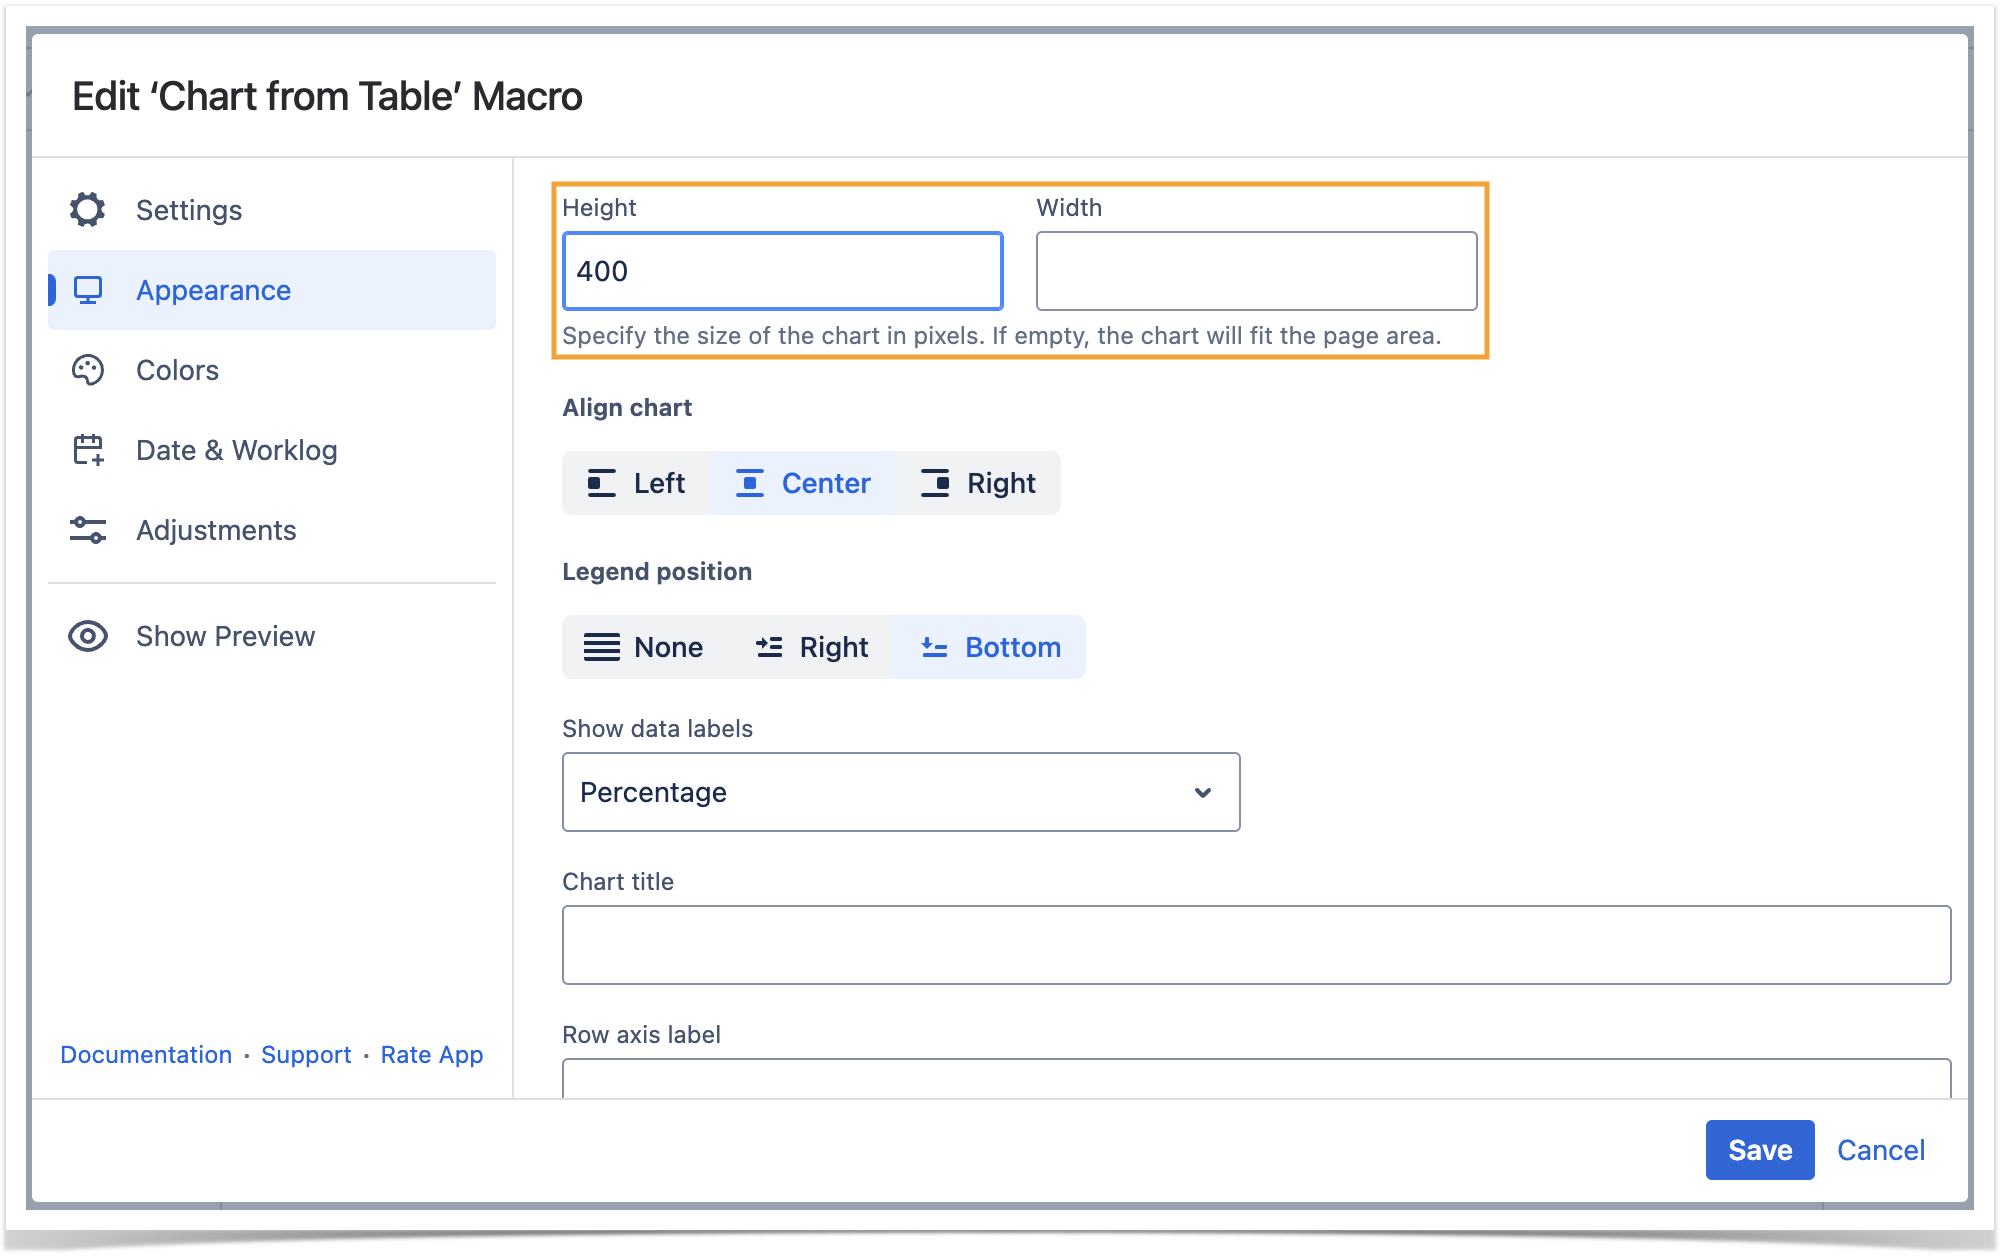
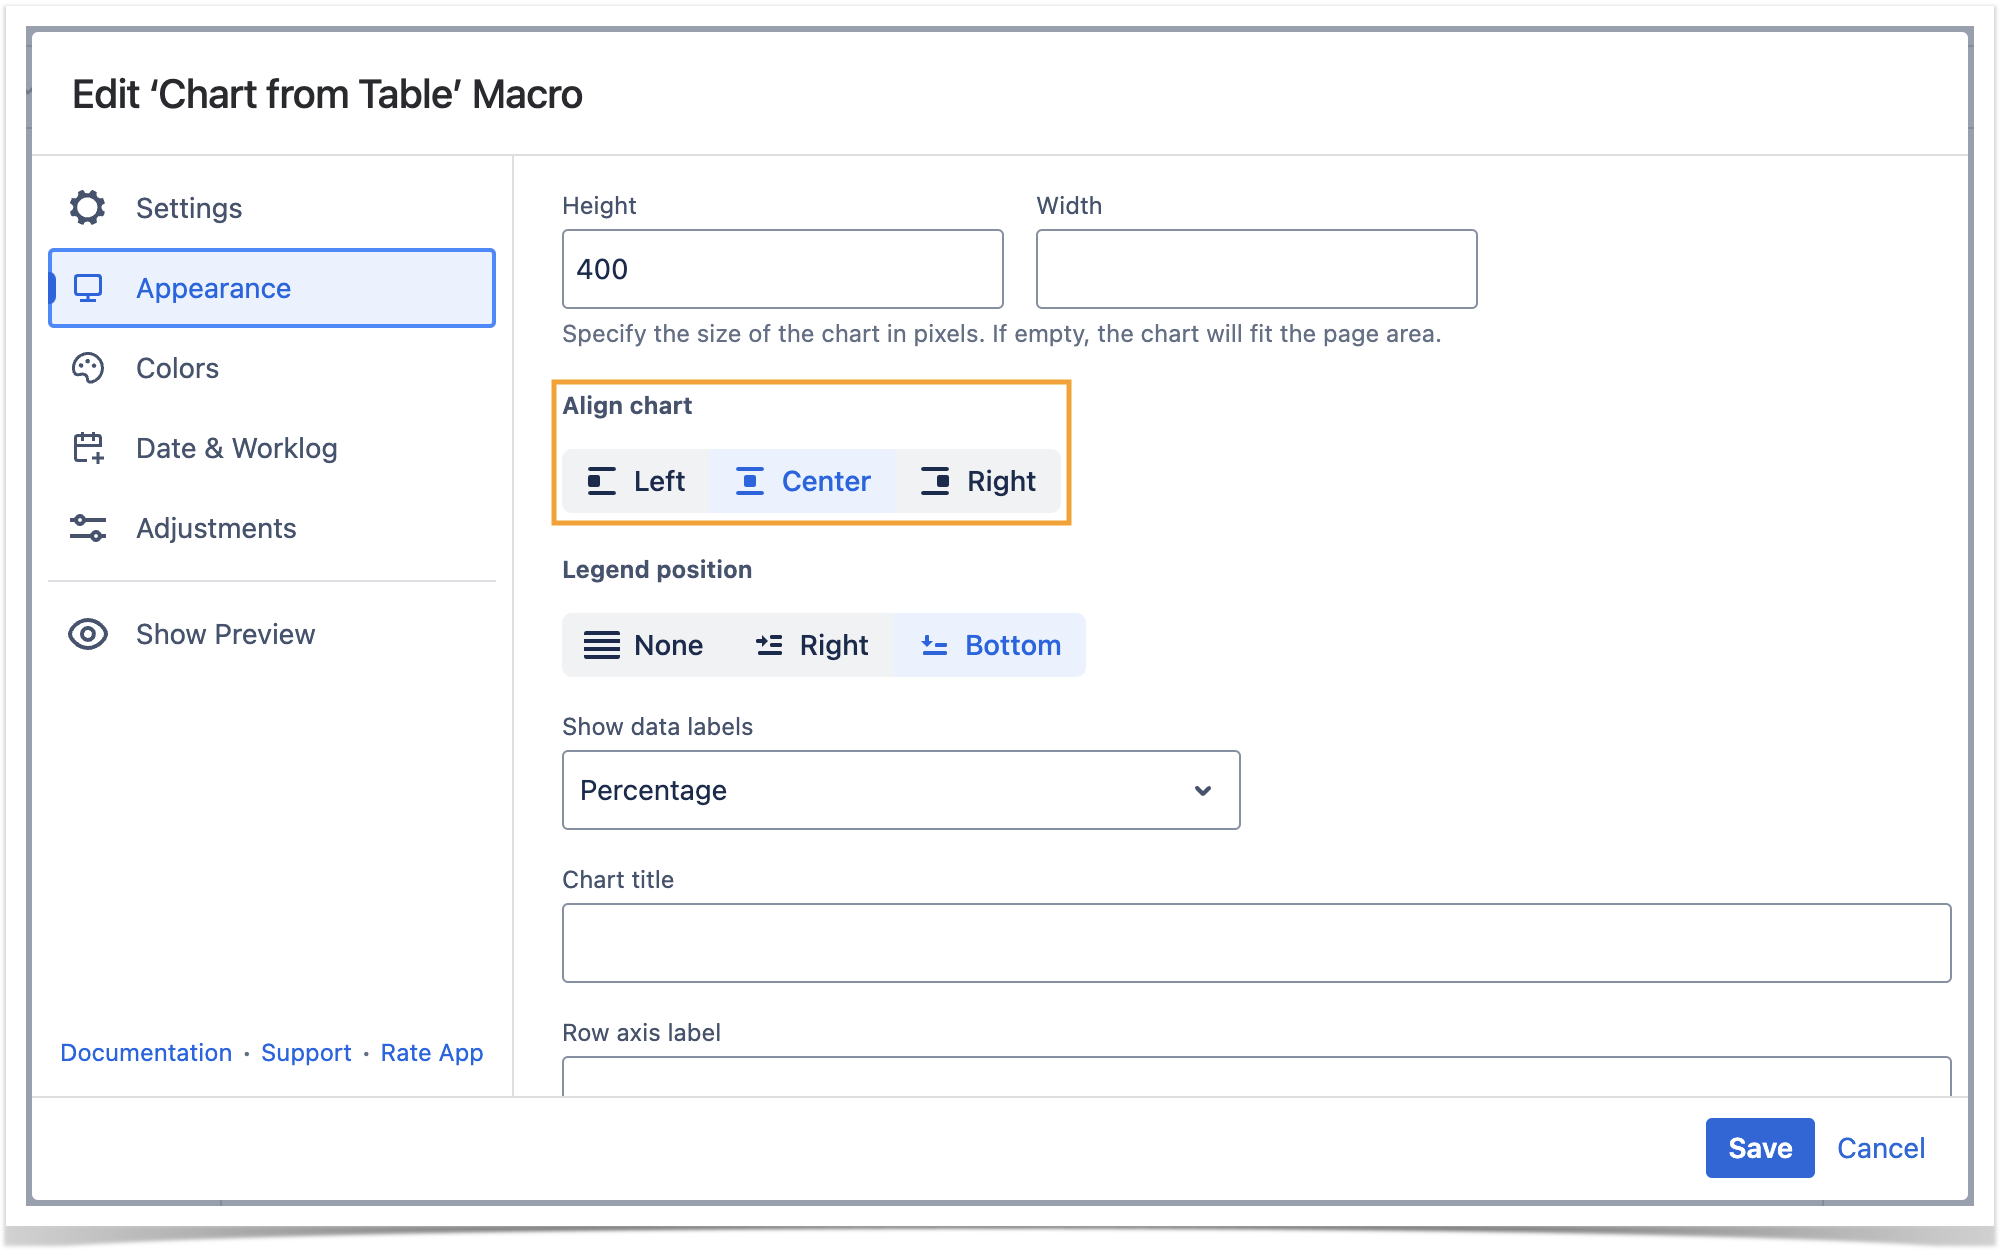
Align chart
- Switch the page to the edit mode.
- Select the macro and click Edit.
- Switch to the Appearance tab.
- Locate the Align chart option.
- Select the appropriate chart alignment, as follows:
- Left
- Center
- Right
- Save the macro and the page.
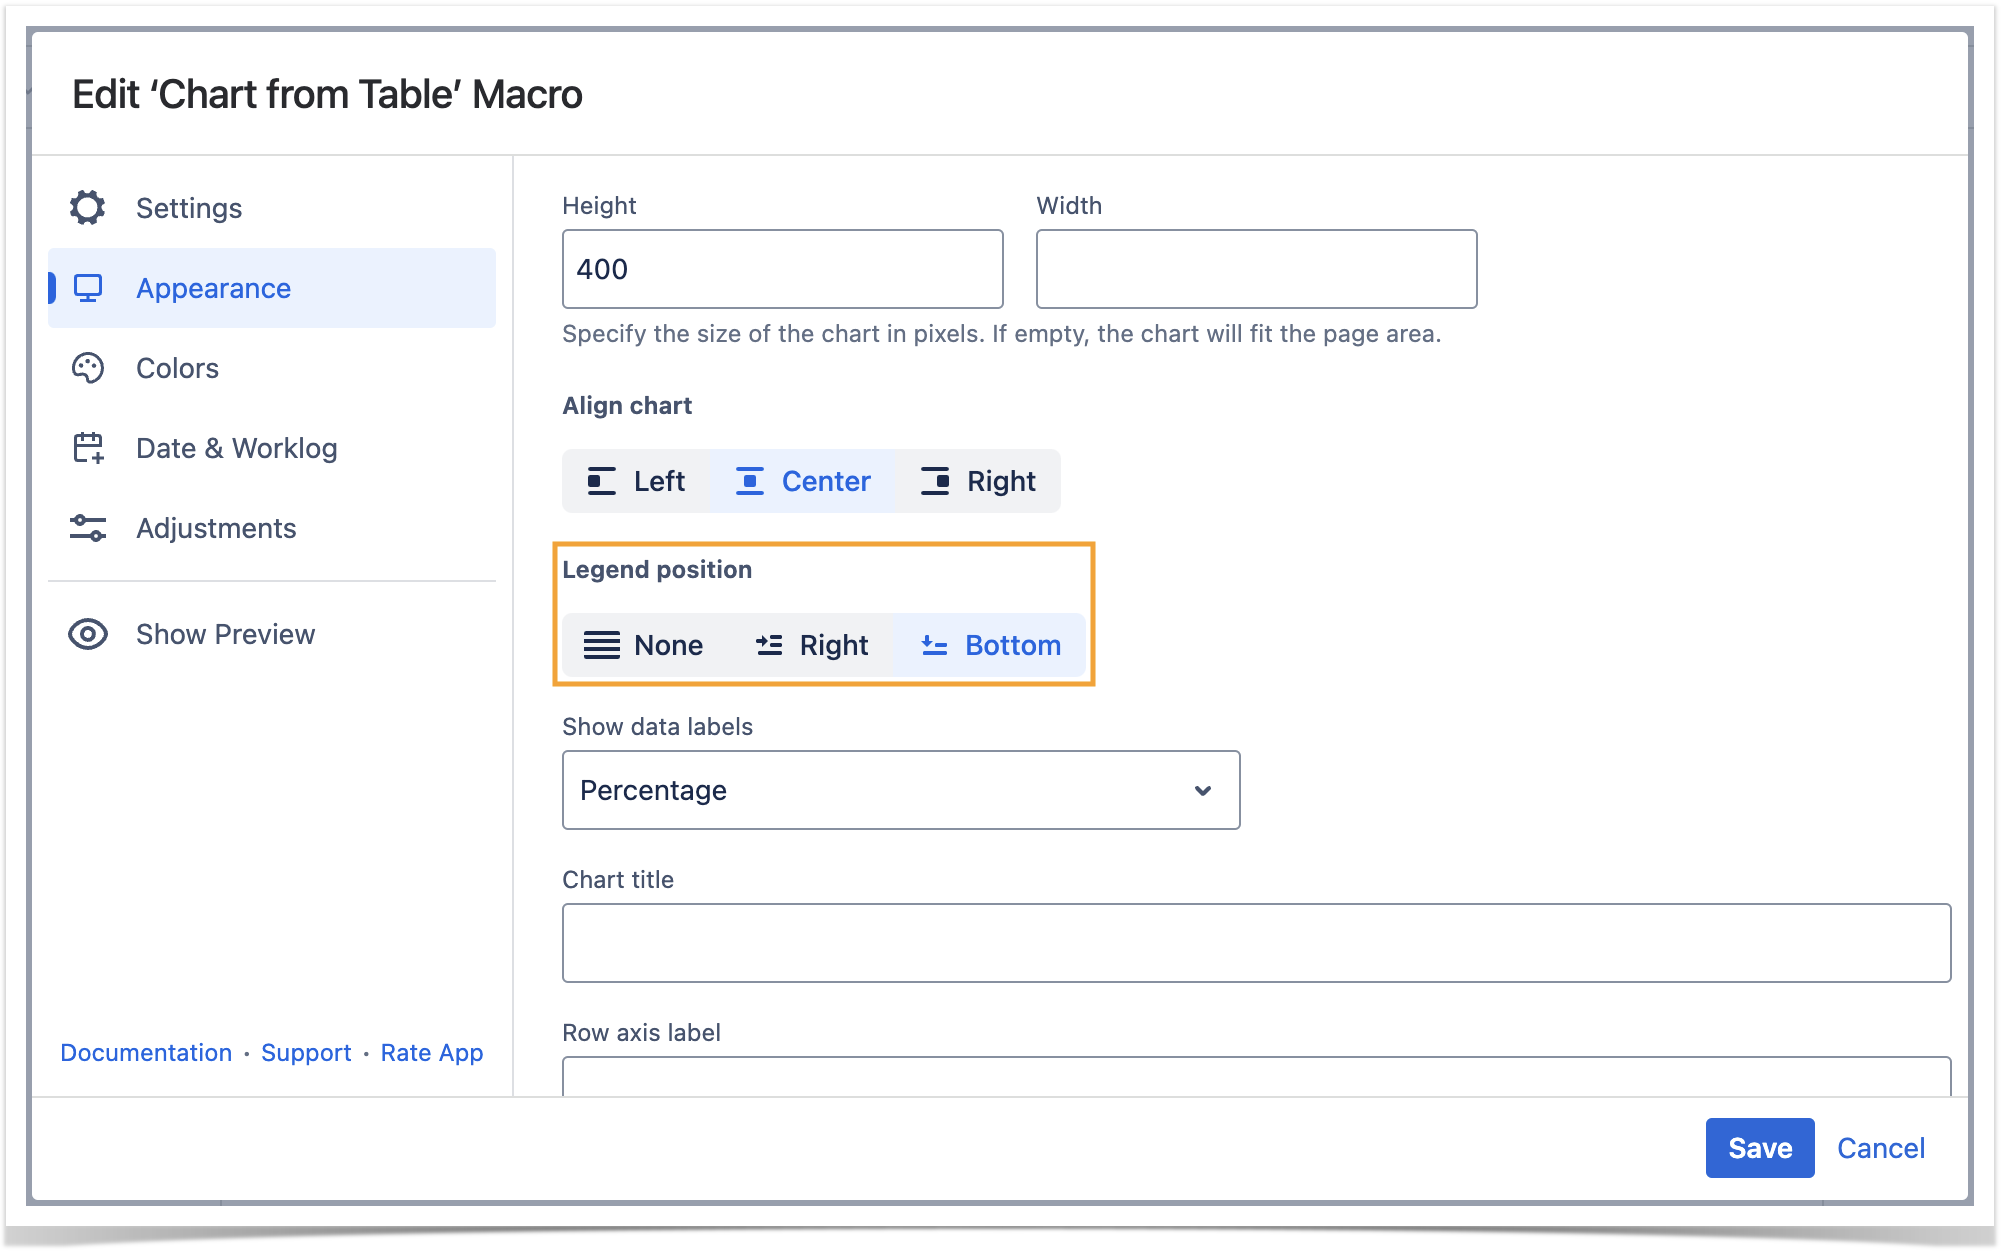
Set the legend position
- Switch the page to the edit mode.
- Select the macro and click Edit.
- Switch to the Appearance tab.
- Locate the Legend Position option.
- Select the appropriate legend position, as follows:
- None
- Right
- Bottom
- Save the macro and the page.
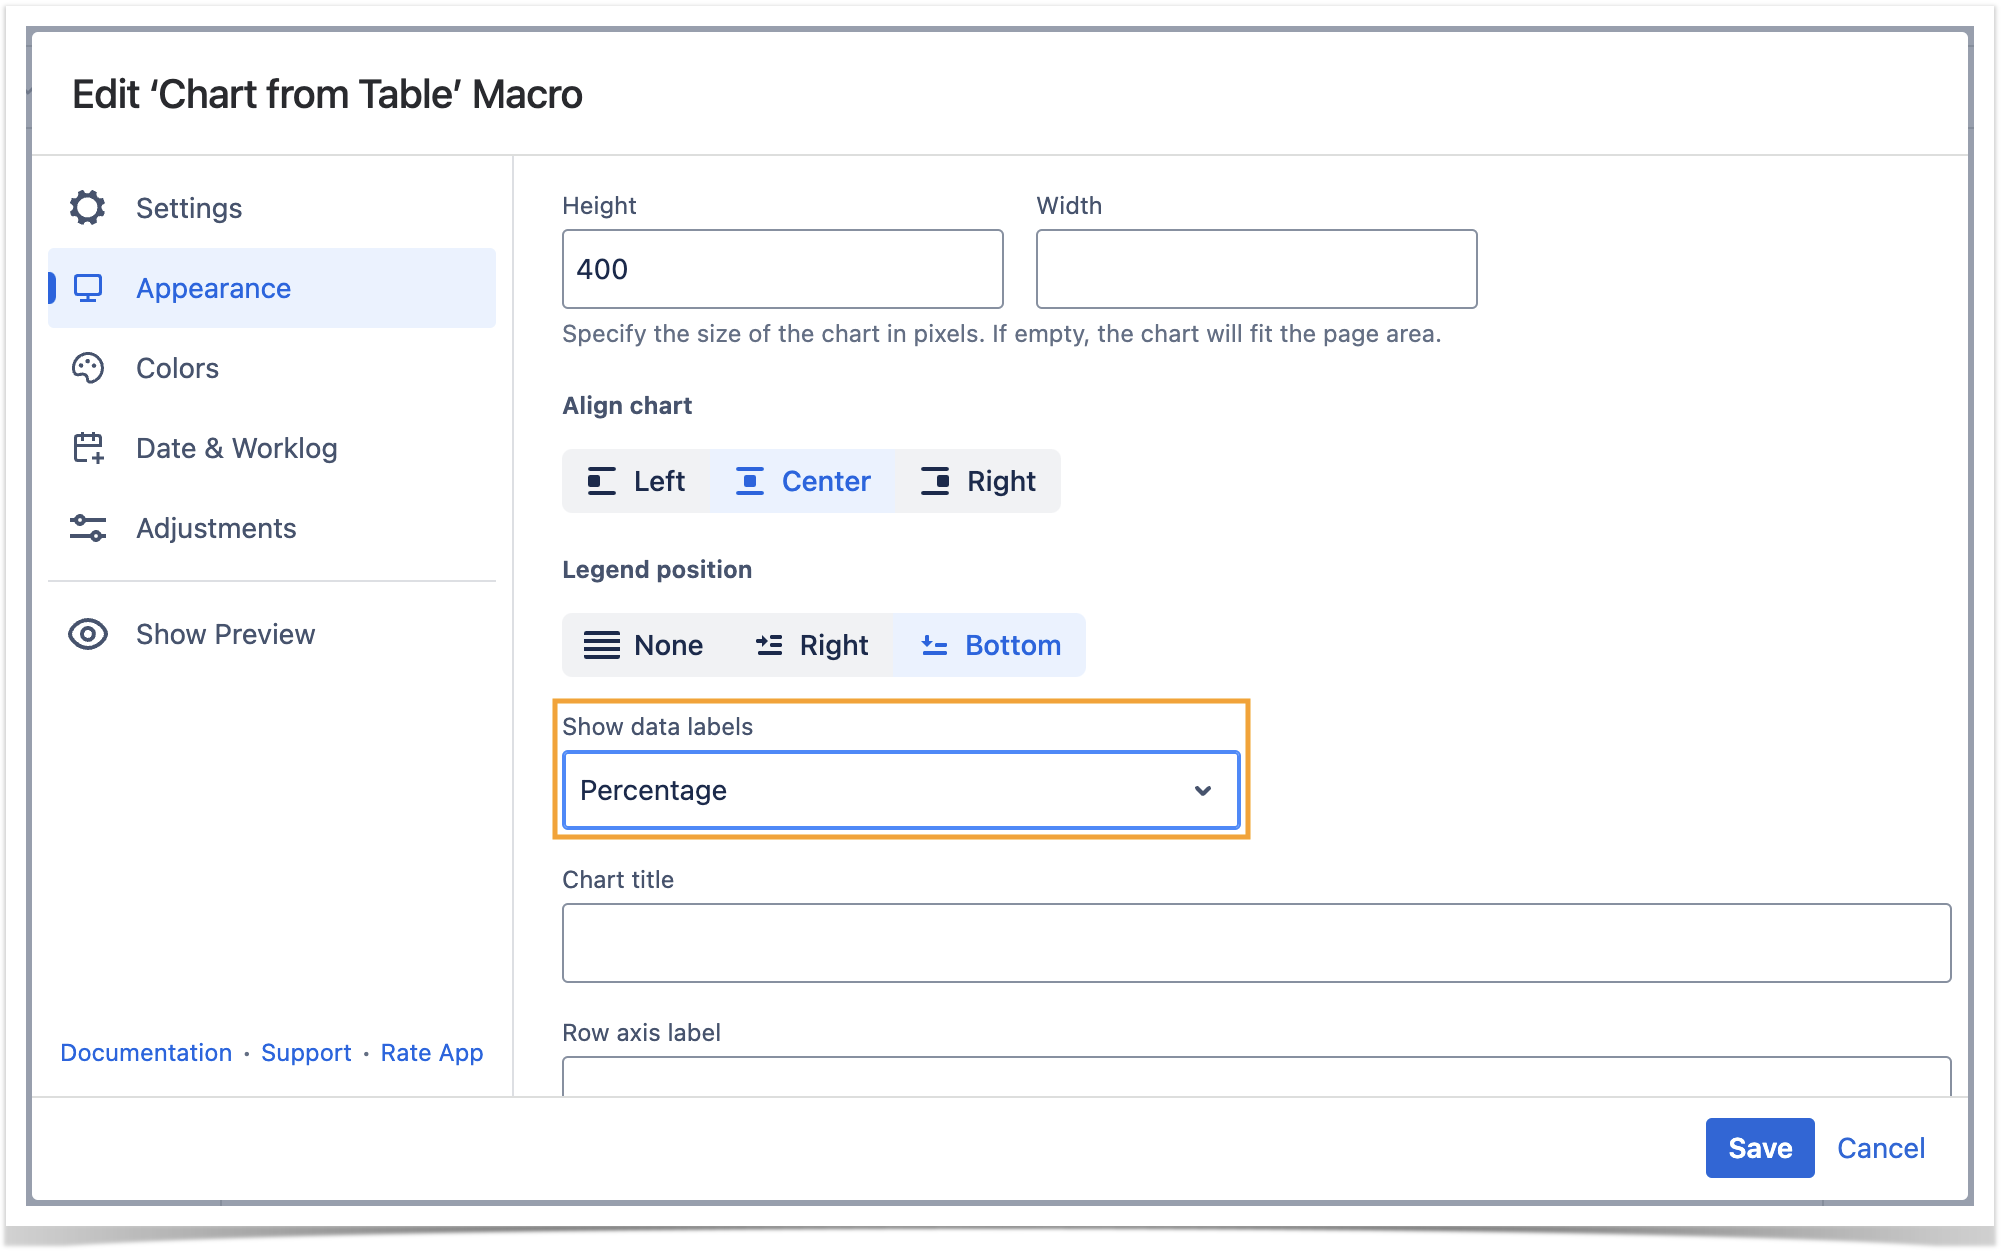
Show data labels
- Switch the page to the edit mode.
- Select the macro and click Edit.
- Switch to the Appearance tab.
- Locate the Show data labels option and select the appropriate option, as follows:
- None
- Value
- Percentage
- Value (Percentage)
- Percentage (Value)
- Save the macro and the page.
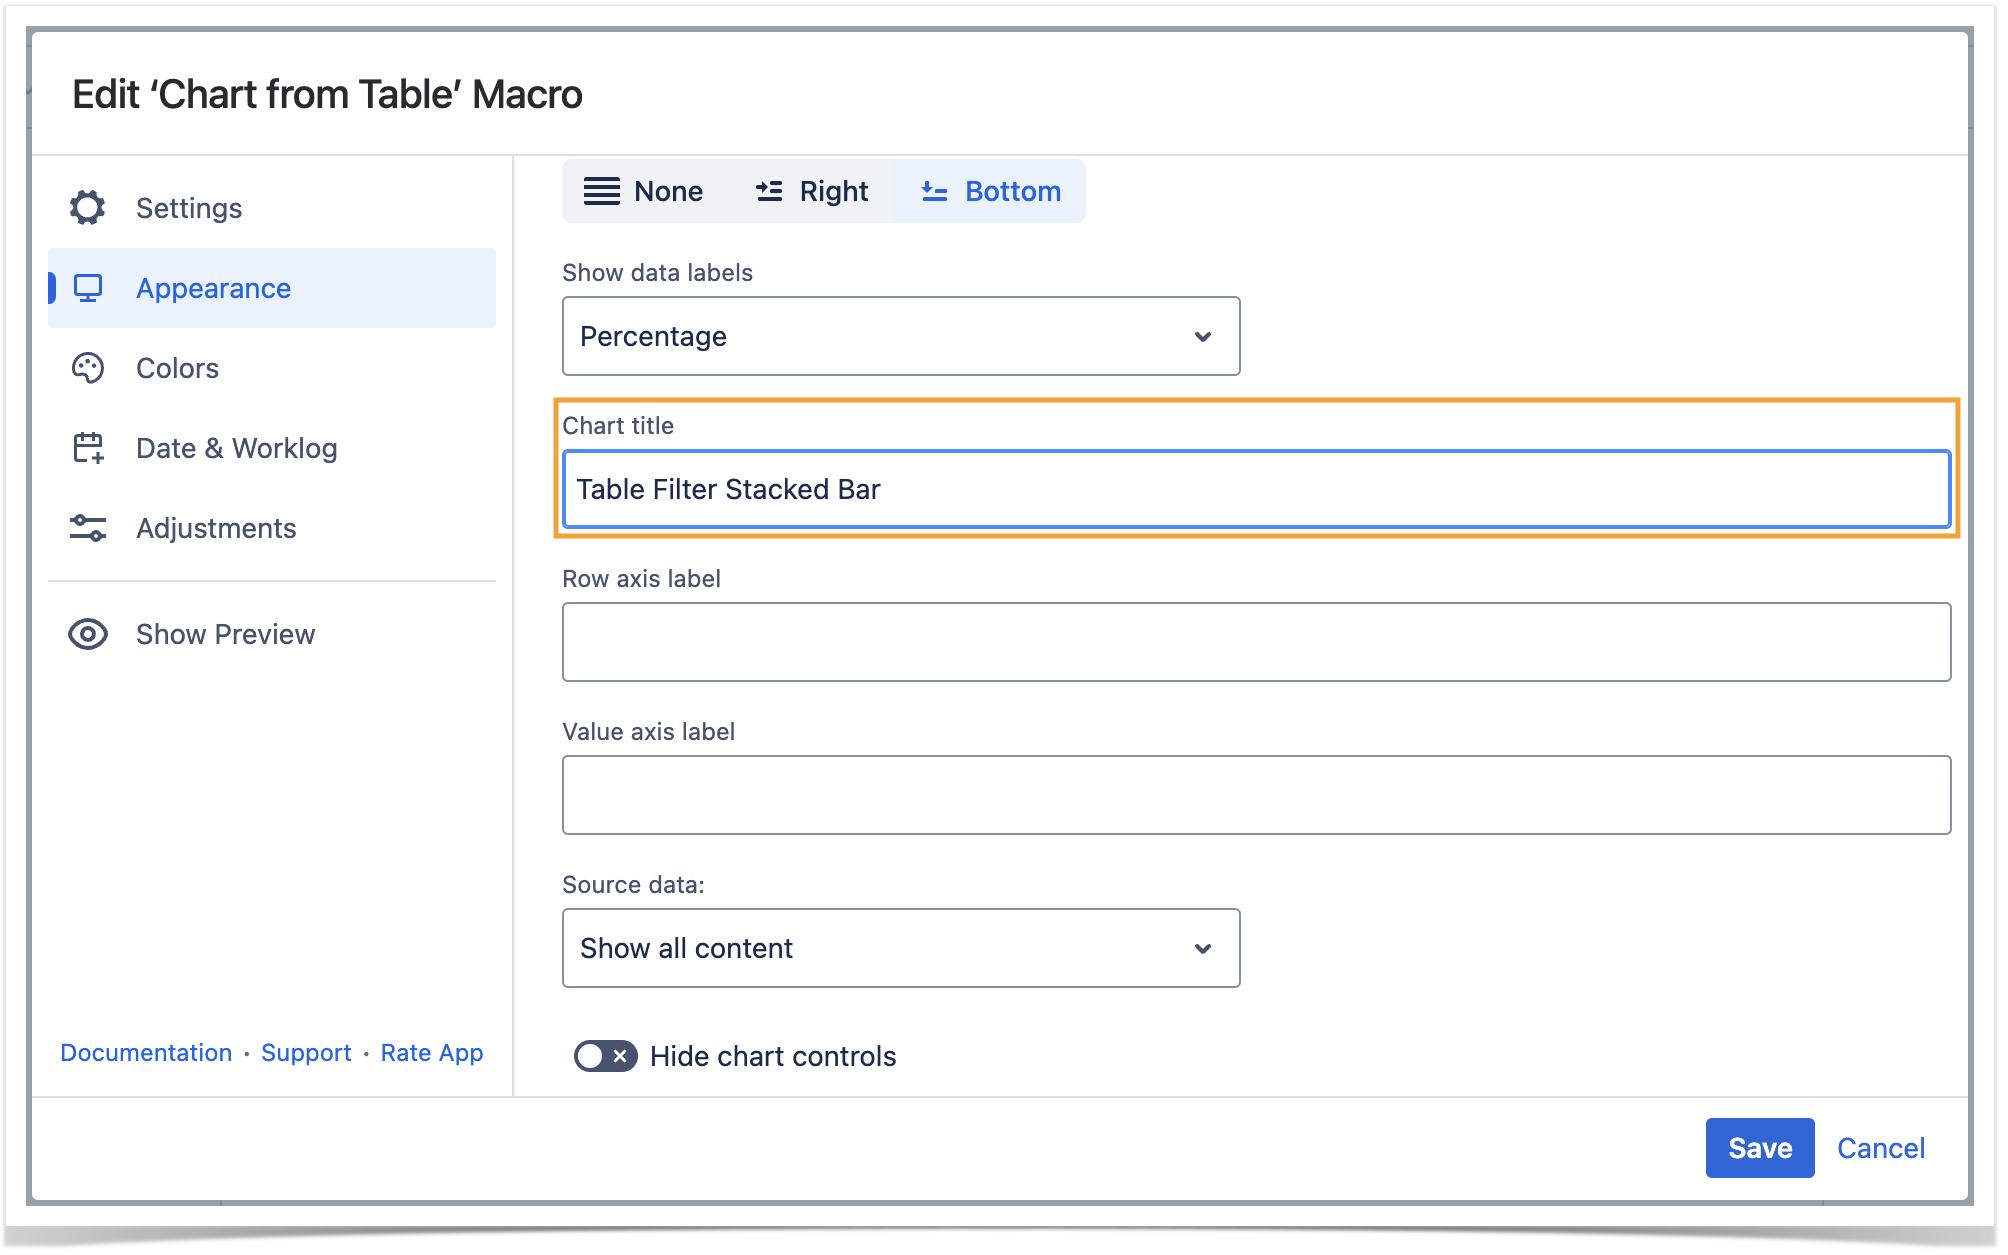
Set the chart title
- Switch the page to the edit mode.
- Select the macro and click Edit.
- Switch to the Appearance tab.
- Locate the Chart title option and enter the title.
- Save the macro and the page.
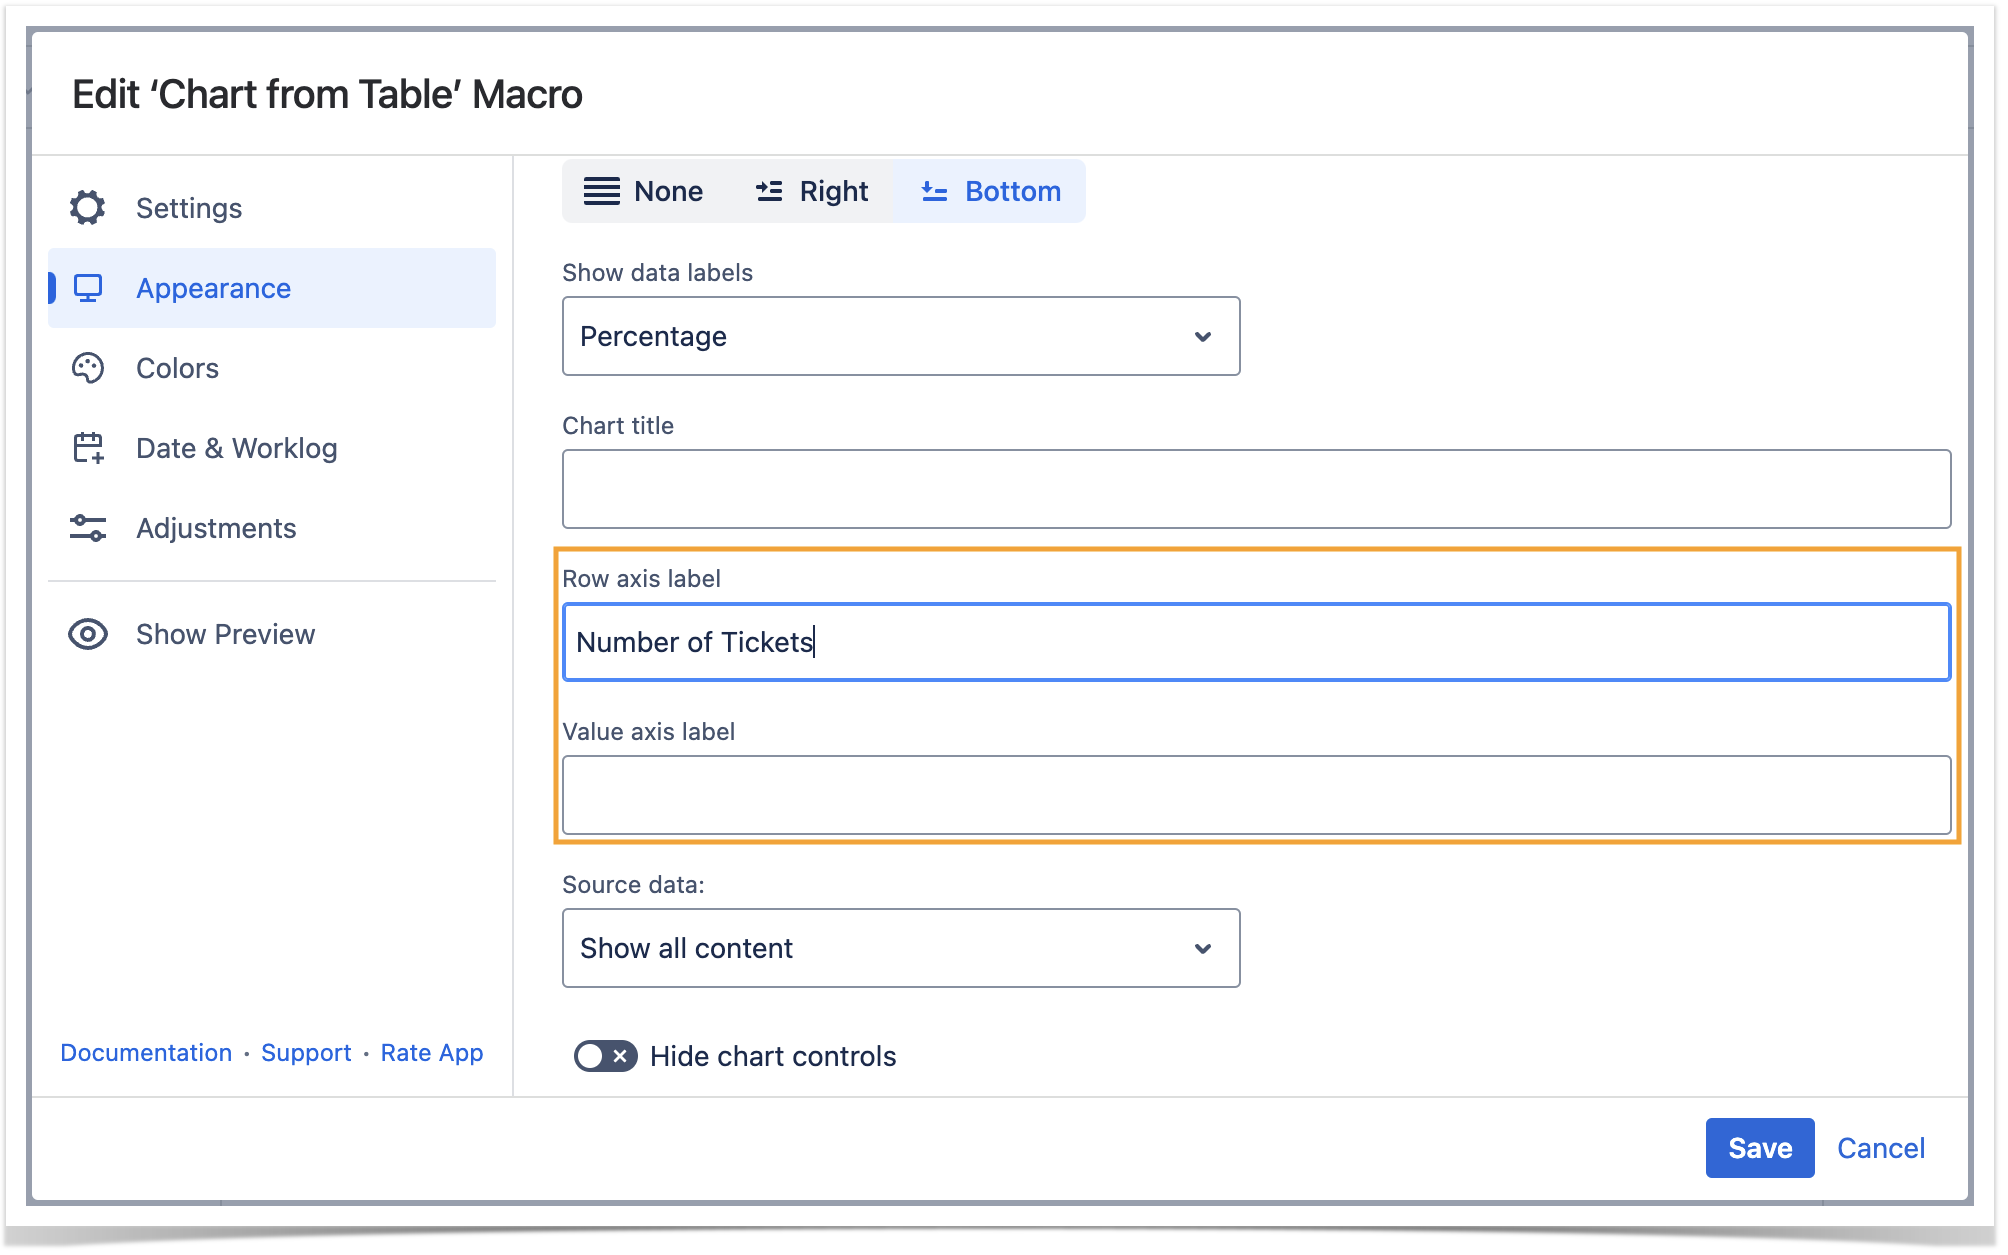
Set axis labels
- Switch the page to the edit mode.
- Select the macro and click Edit.
- Switch to the Appearance tab.
- Locate theRow axis label andValue axis label options and enter the labels.
- Save the macro and the page.
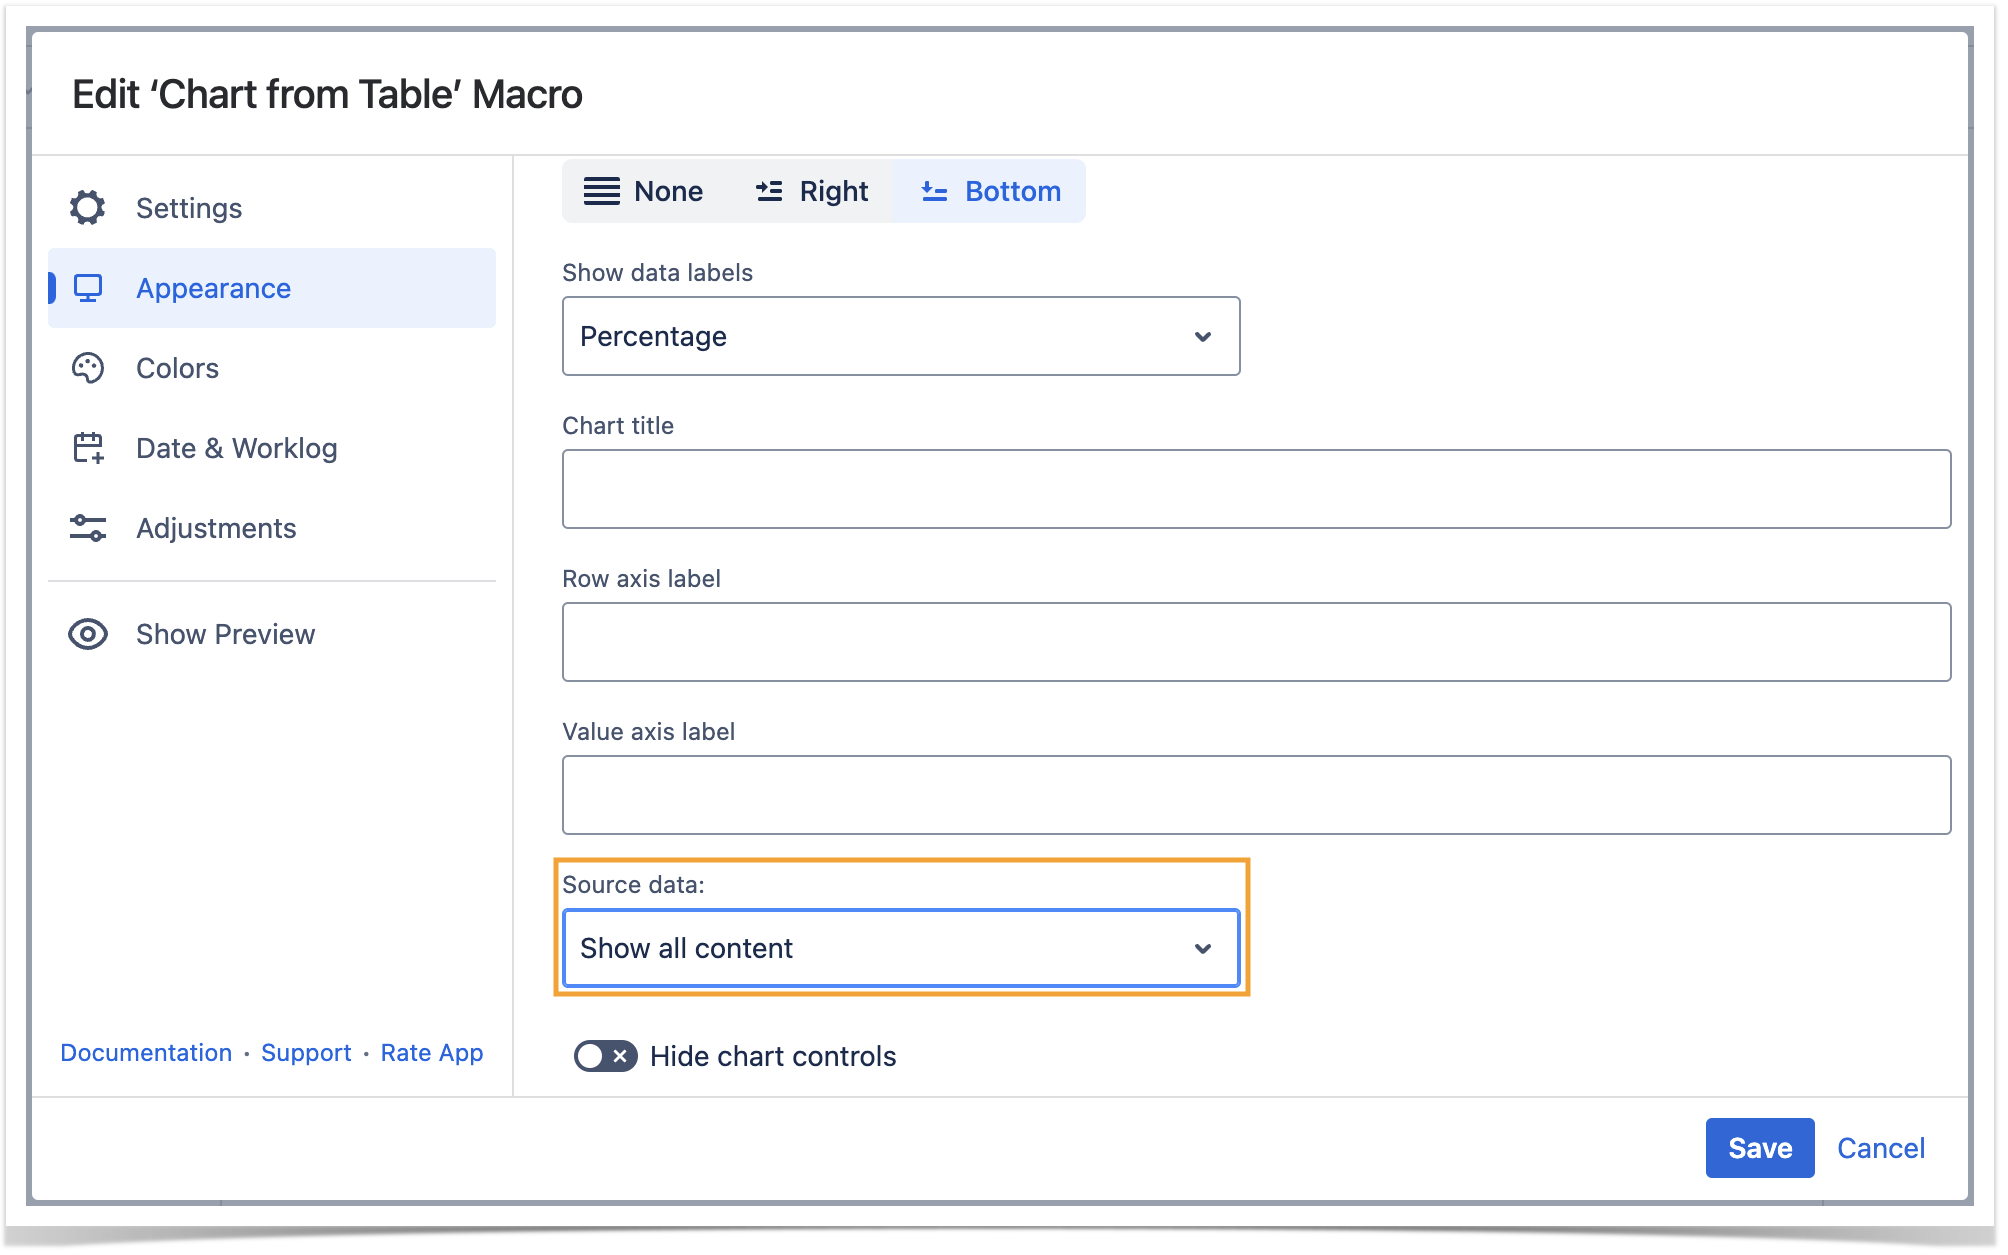
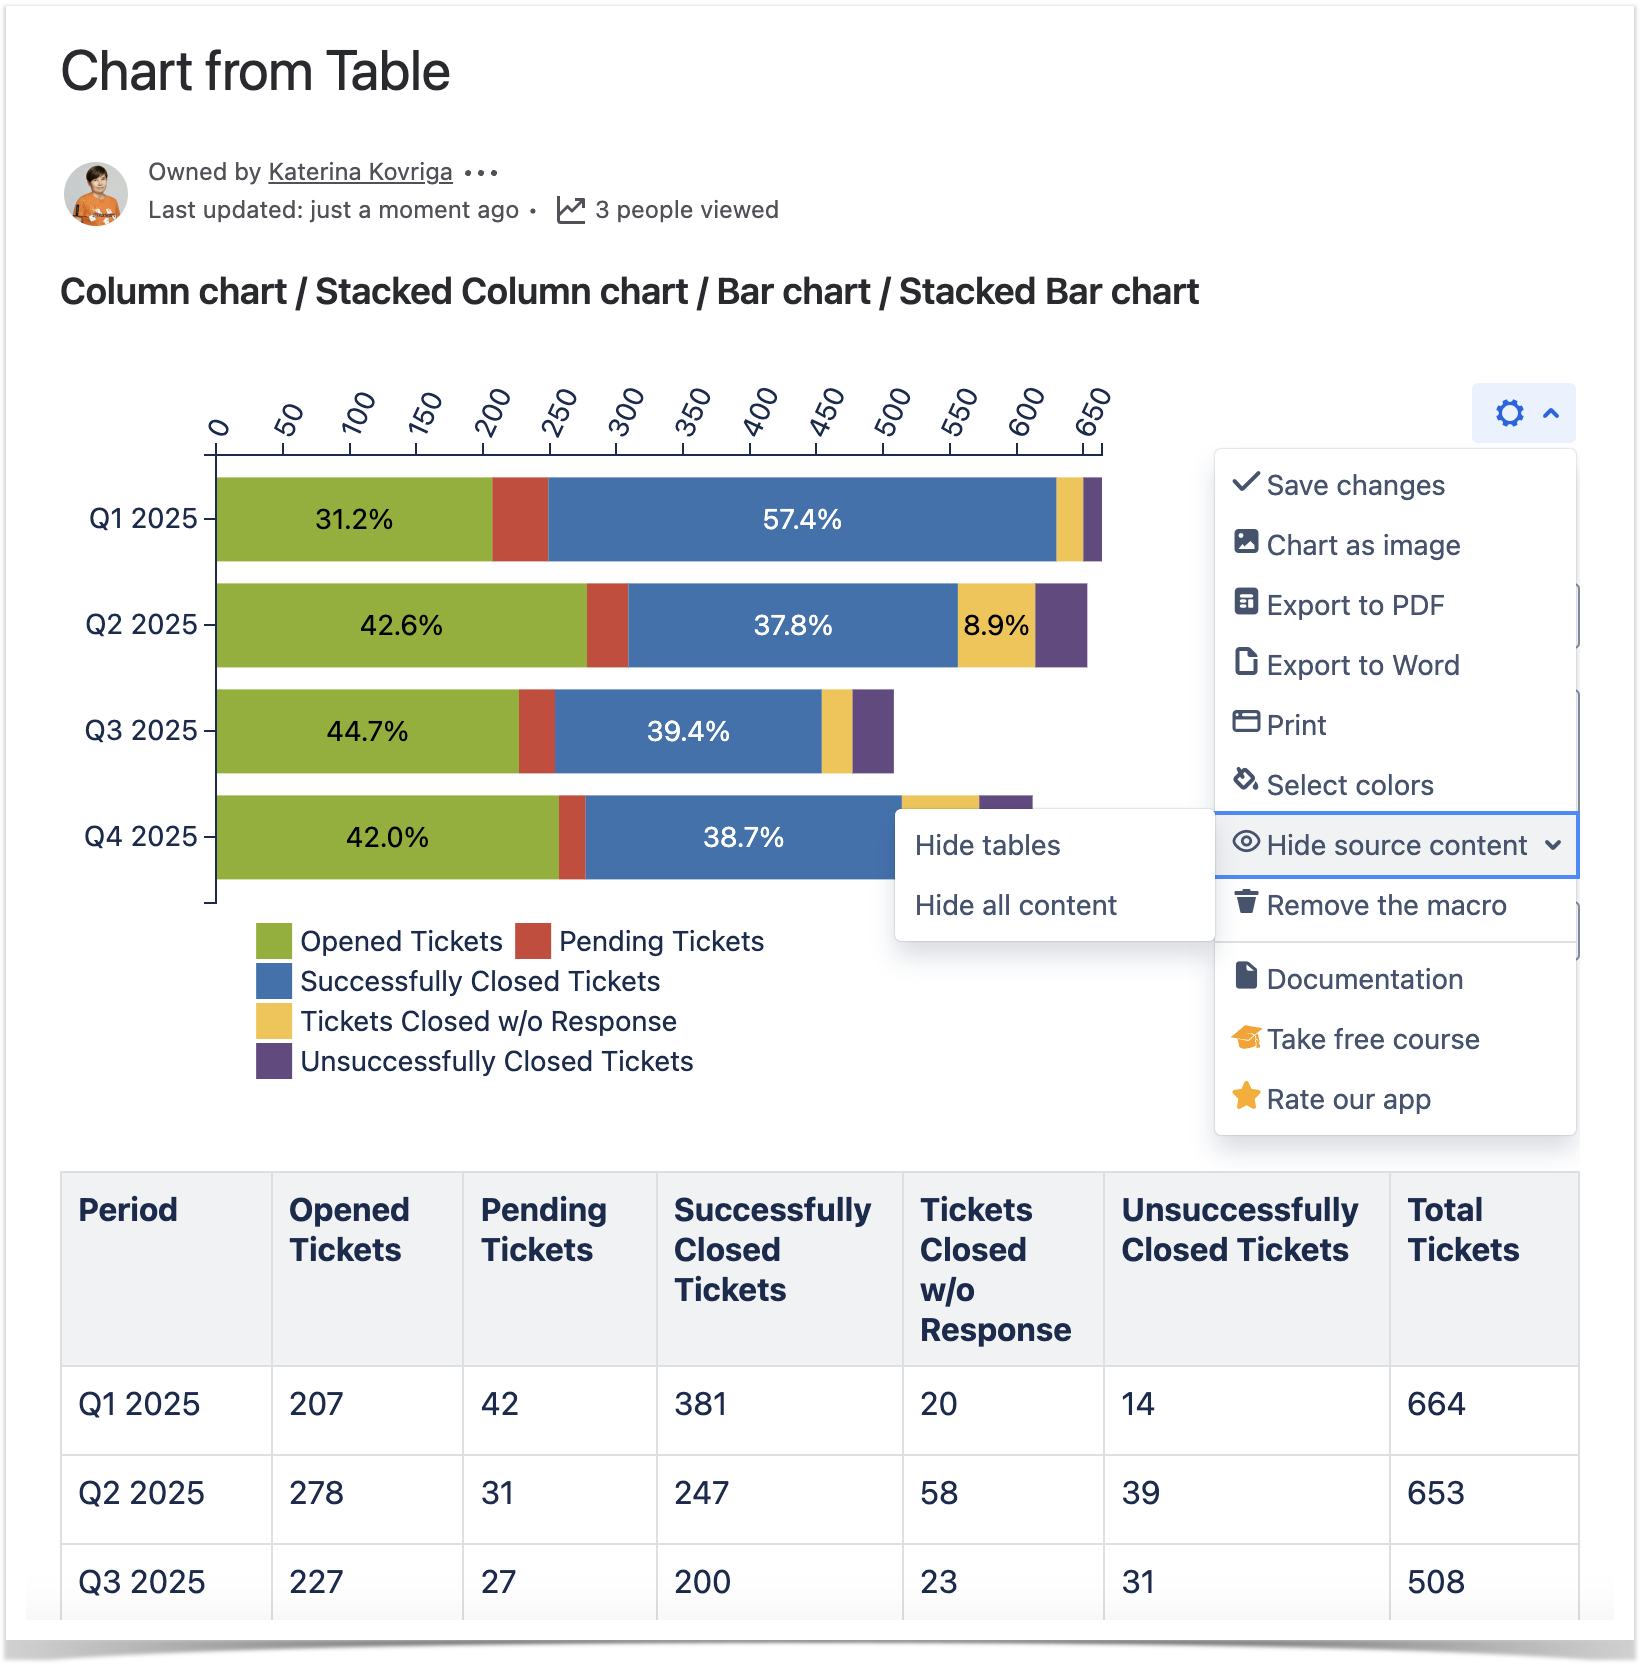
Show/Hide source data
- Switch the page to the edit mode.
- Select the macro and click Edit.
- Switch to the Appearance tab.
- Locate the Source data option and select the appropriate option, as follows:
- Show all content
- Hide tables
- Hide all content
- Save the macro and the page.
| Info |
|---|
To show/hide source data in the page view mode:
|
| Handy Carousel | ||
|---|---|---|
| ||
|
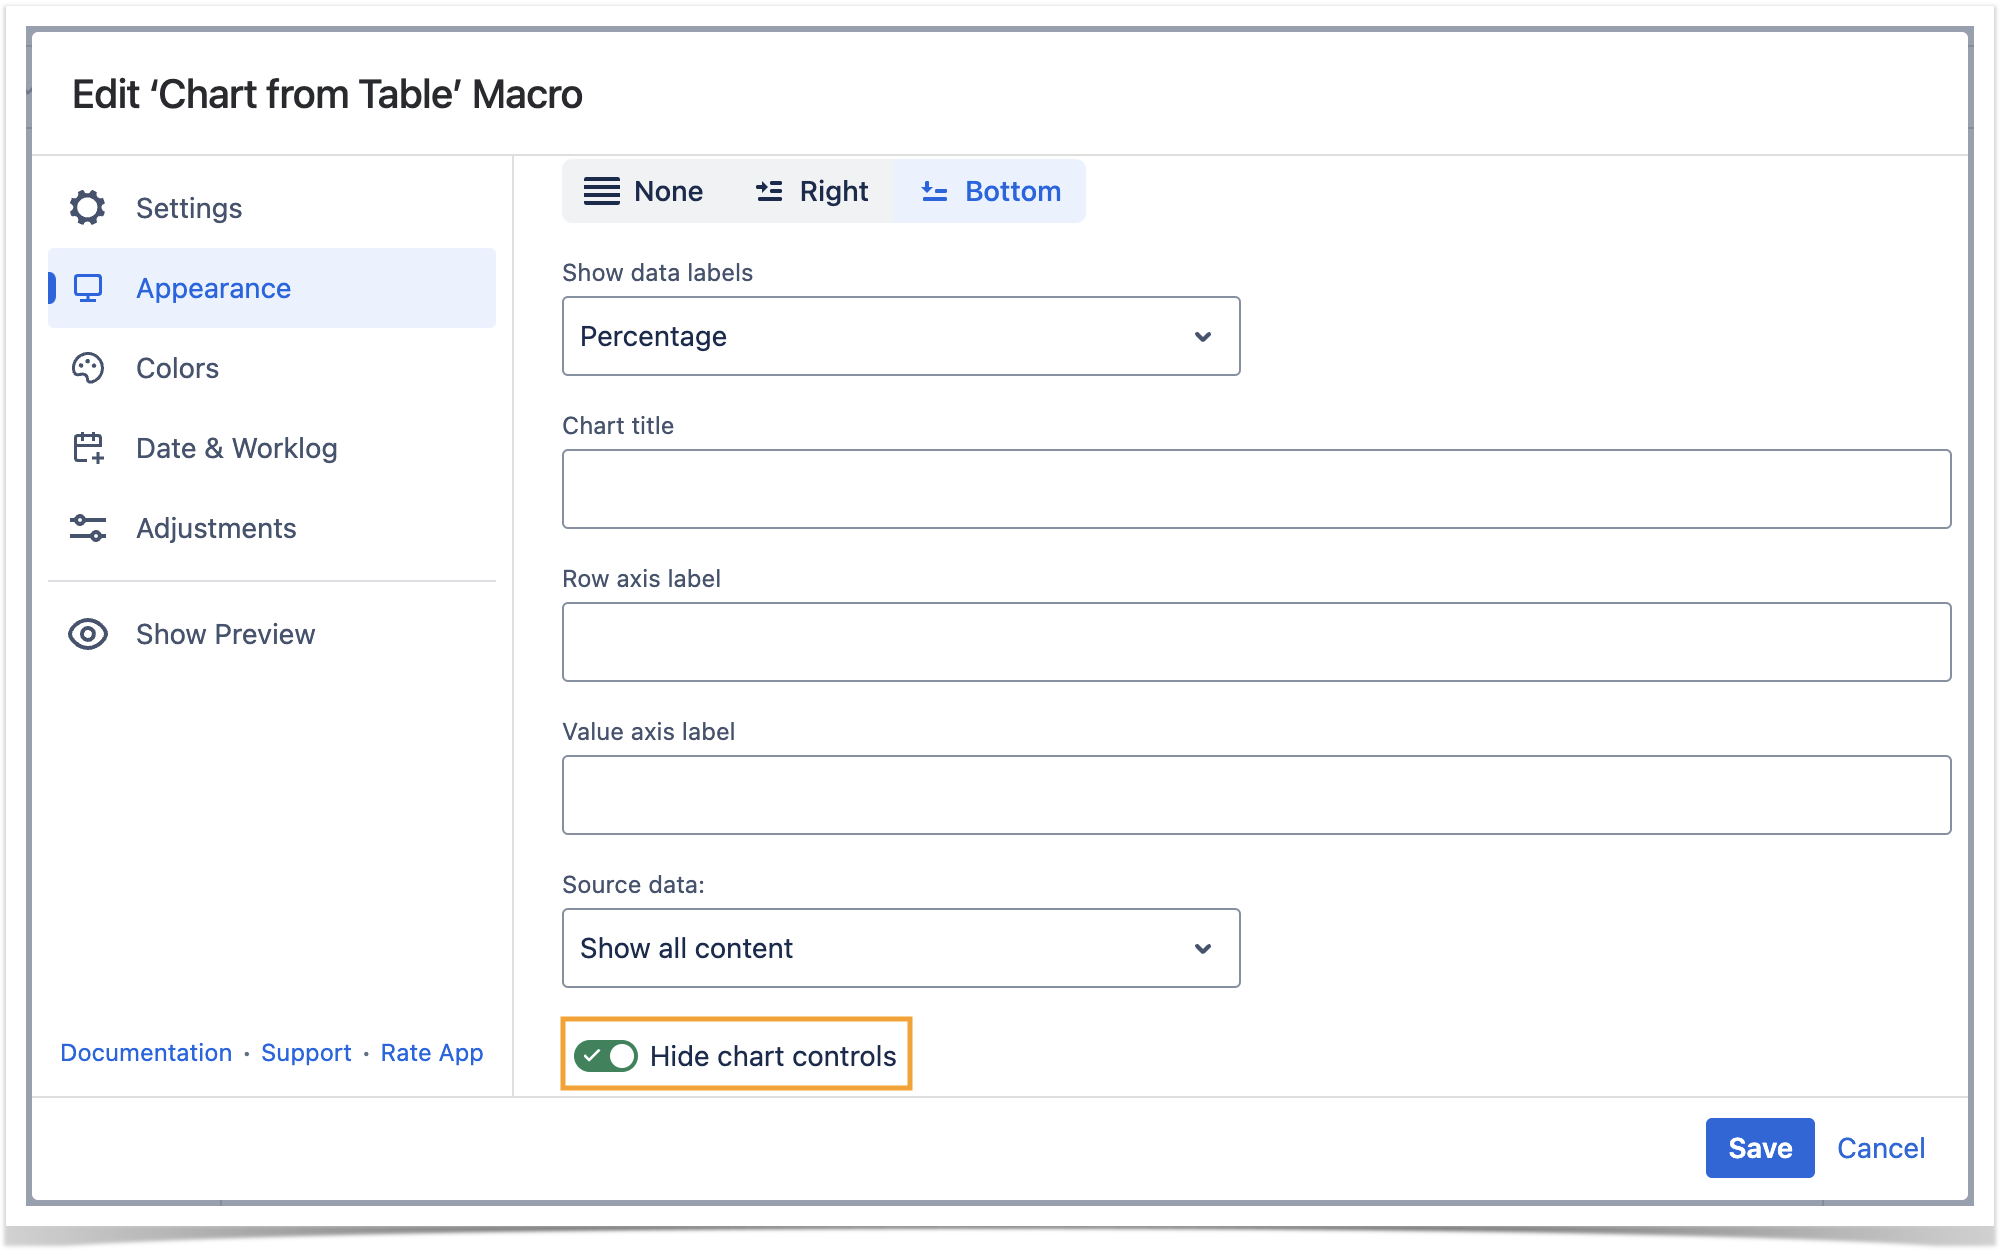
Hide chart controls
- Switch the page to the edit mode.
- Select the macro and click Edit.
- Switch to the Appearance tab.
- Locate and enable the Hide chart controls option.
- Save the macro and the page.
Colors Tab
Set colors
- Switch the page to the edit mode.
- Select the macro and click Edit.
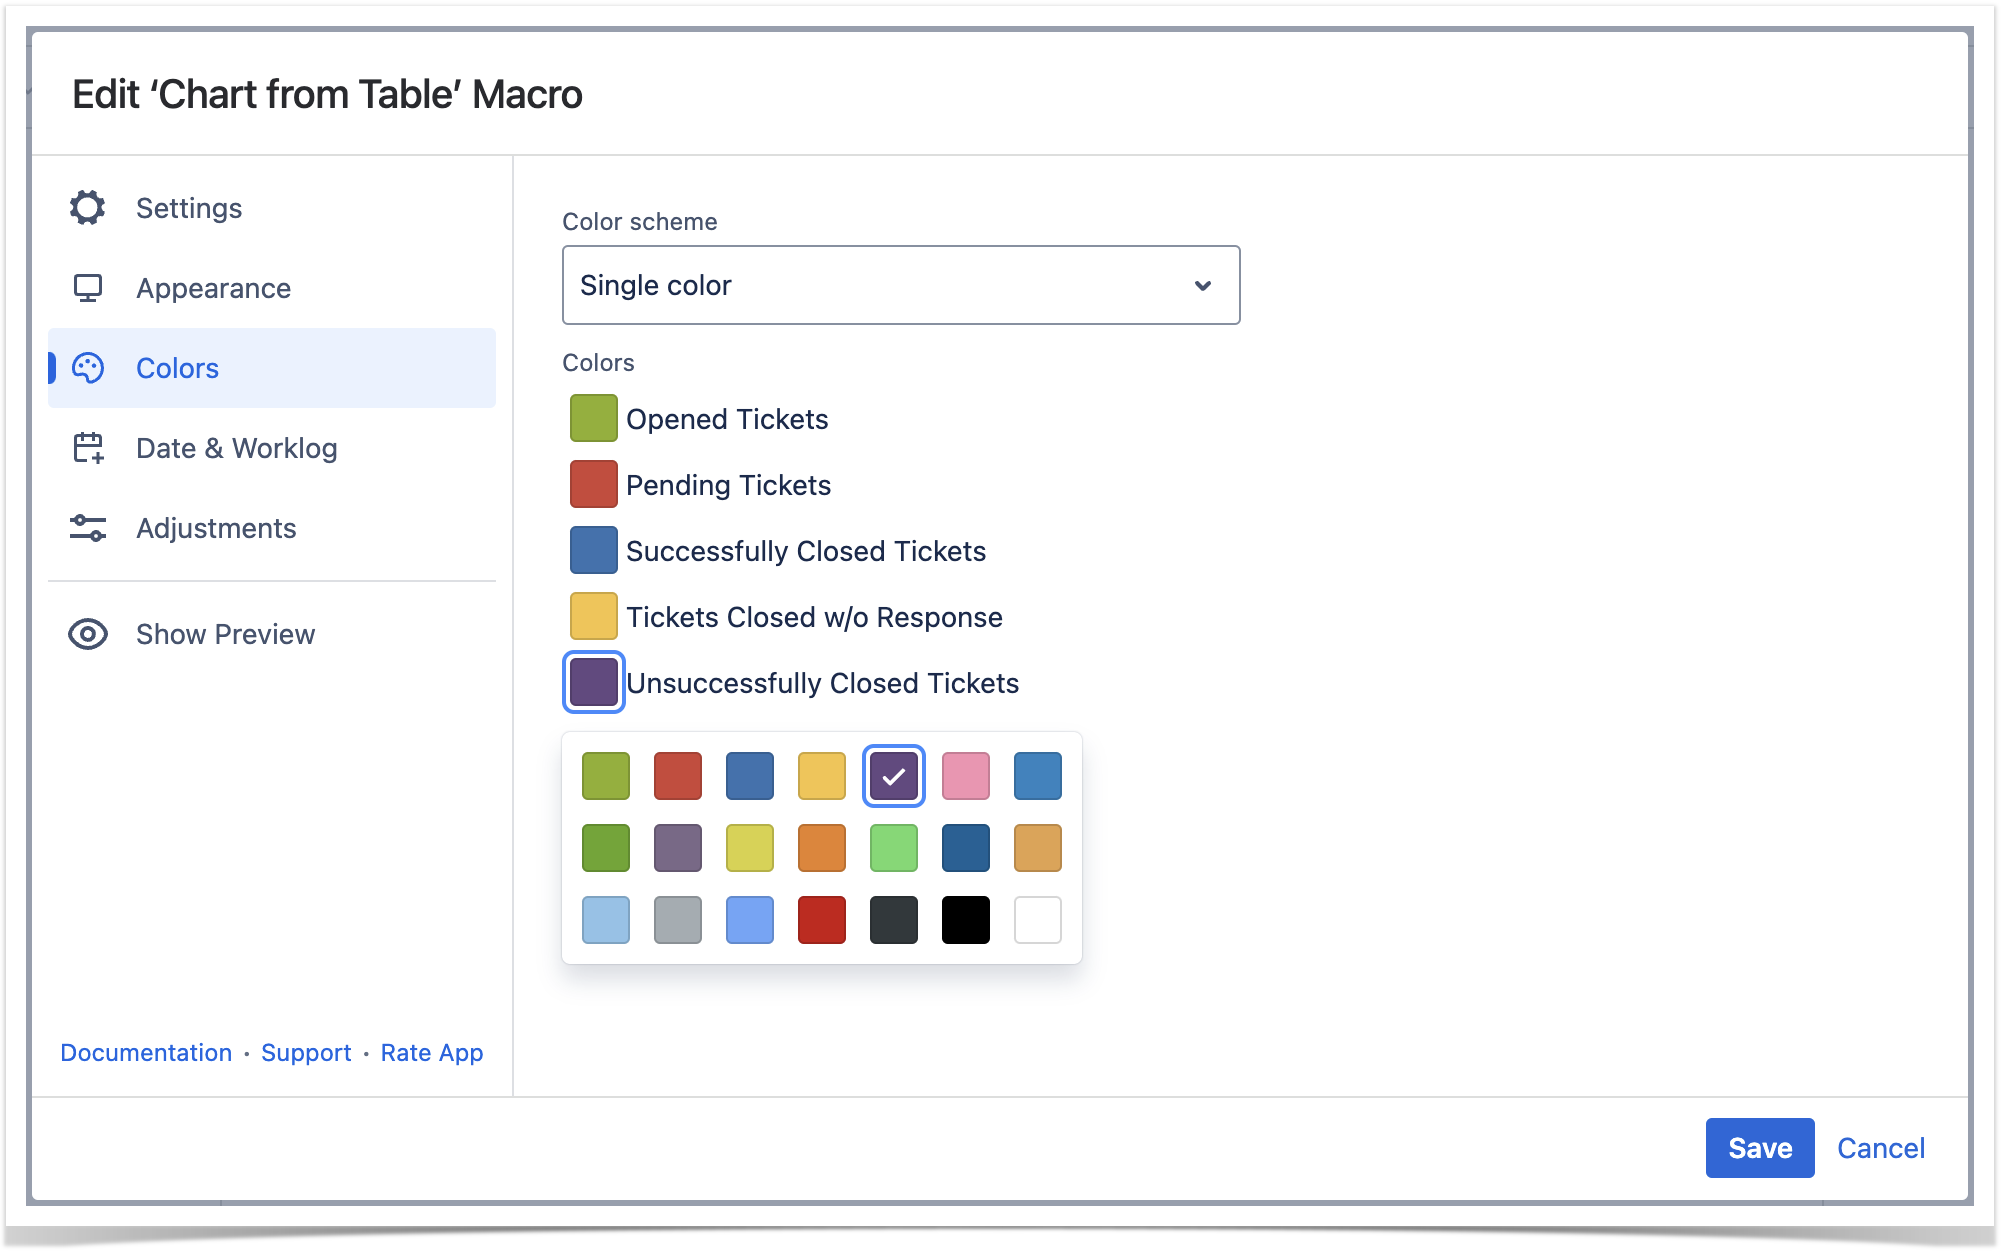
- Switch to the Colors tab.
- Select the appropriate colors for each label.
- To set individual column colors, locate the Color scheme option.
Select the Multicolor or Colors in the table columns option.
- Save the macro and the page.
| Info |
|---|
To set the colors in the page view mode:
|
| Handy Tip | ||
|---|---|---|
| ||
The Multicolor setting enables you to select the appropriate colors for each value of the Label column specified in the data series field of the chart. |
| Handy Tip | ||
|---|---|---|
| ||
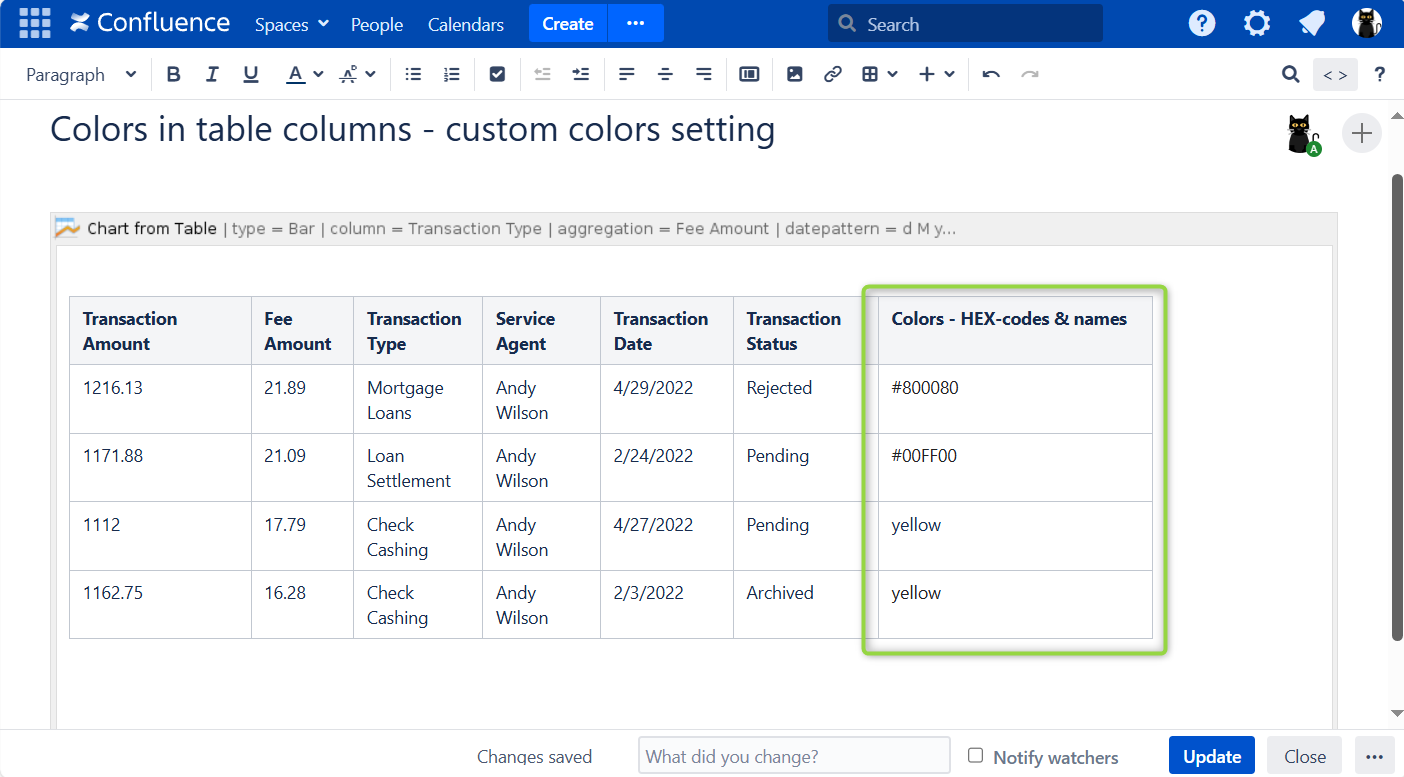
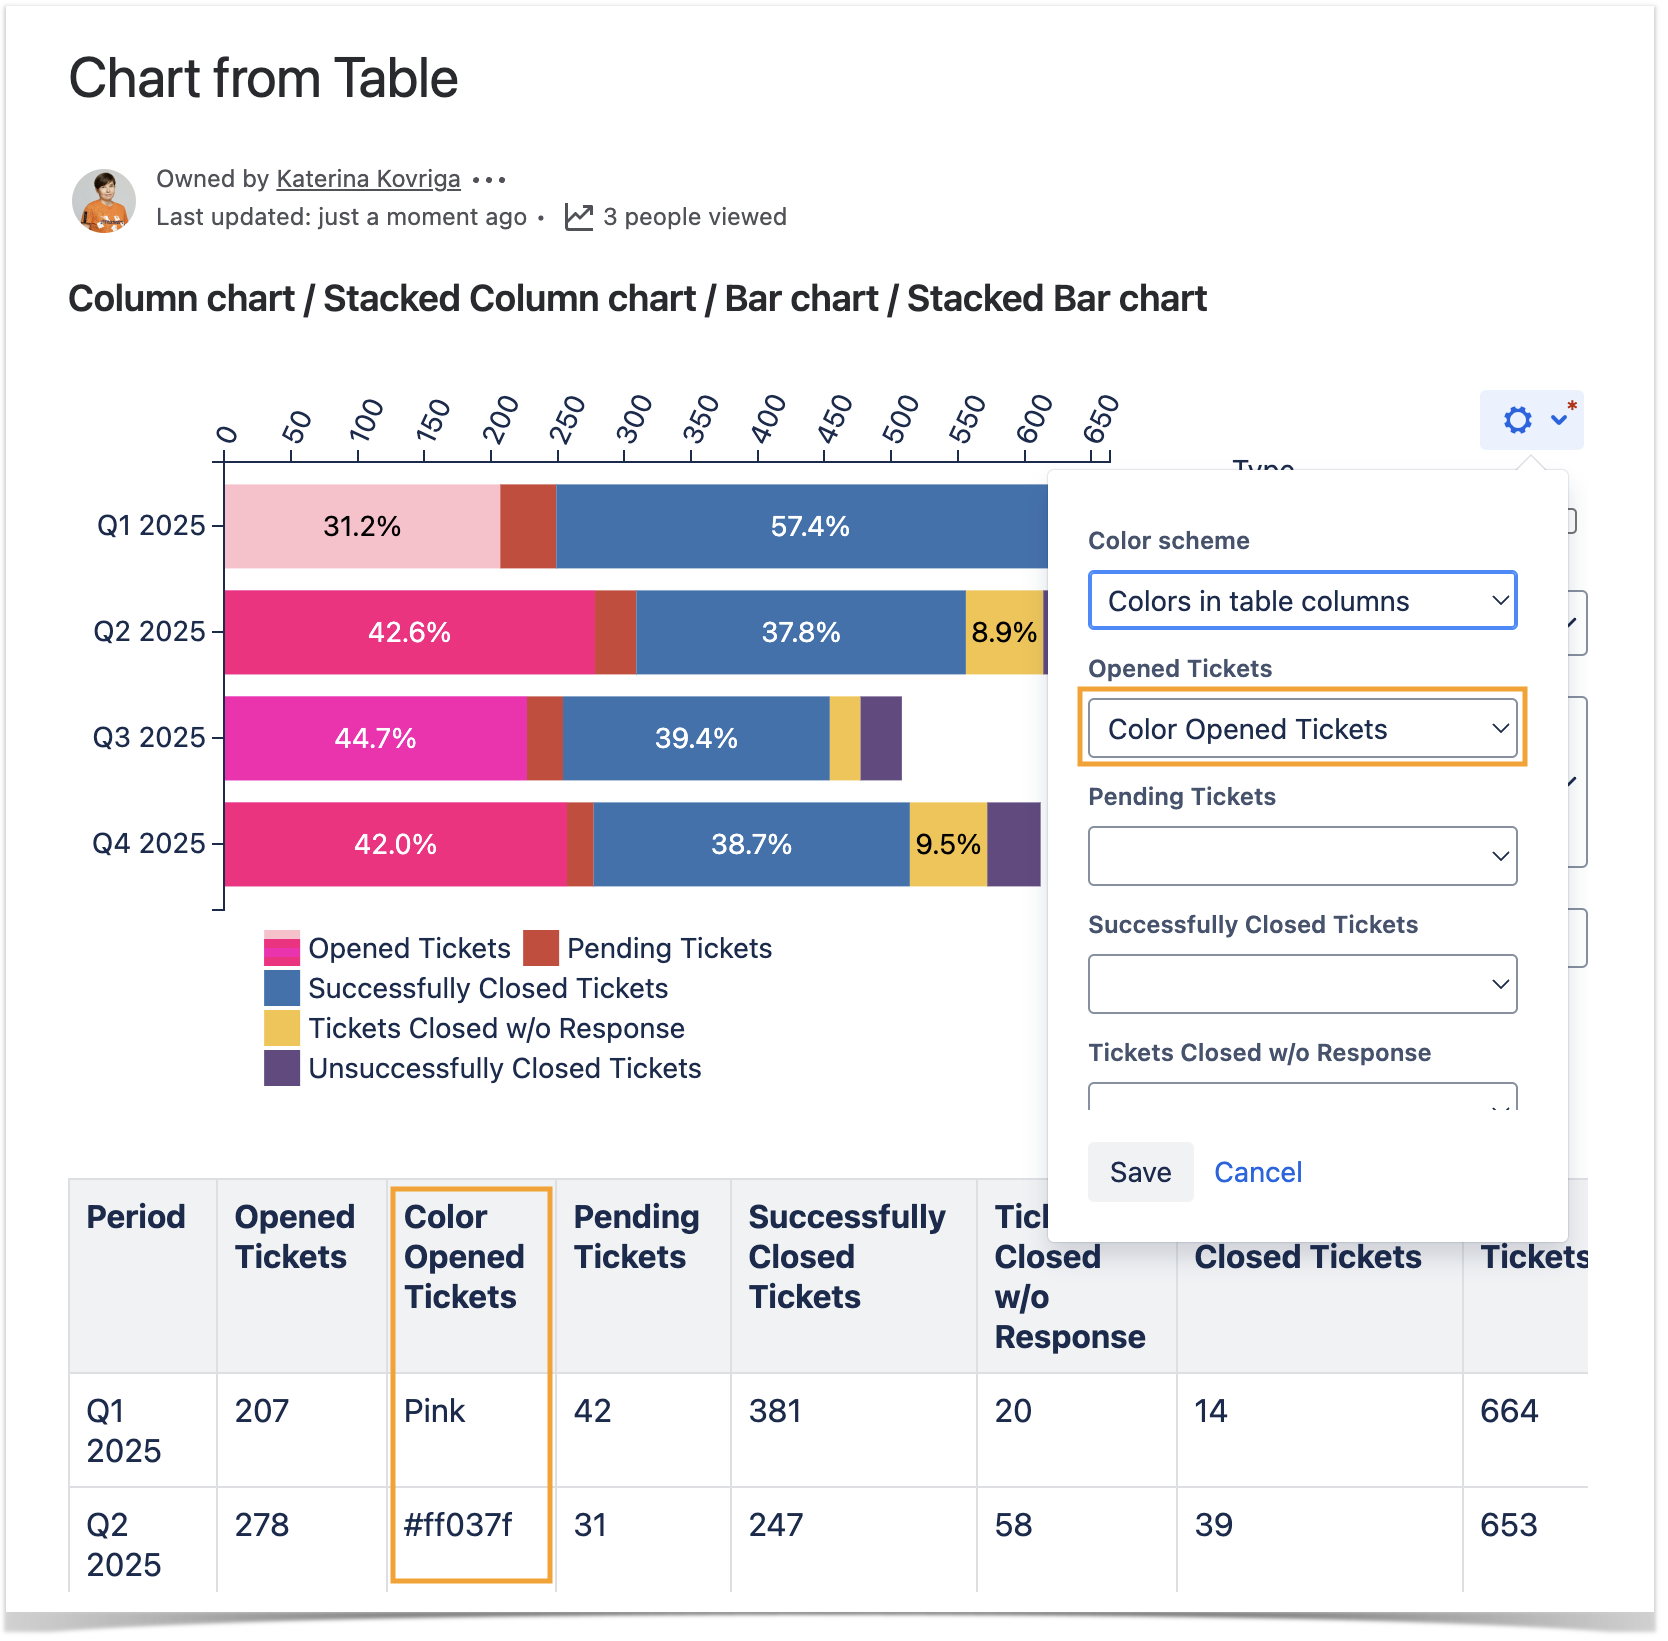
The Colors in the table columns setting enables you to add colors as either its simple name (e.g. green, yellow) or a HEX code (e.g. #808080-> gray) in a separate custom-made column to paint values of the Labels column(-s) specified in the data series field of the chart.
|
| Handy Carousel | ||
|---|---|---|
| ||
|
Preview Option
While working in the edit mode, use the Show/hide preview option to adjust the required settings before saving the macro and publishing the page.
| Handy Carousel | ||
|---|---|---|
| ||
|
Filter the Source Table
- Select one or more chart columns/sectors/bars.
- Only the related rows of the source table are displayed.
- Deselect all the columns/sectors/bars to display the whole source table.