| Handy Cards | ||||||||||||||||||||||||||||||||||||||||||||||||||
|---|---|---|---|---|---|---|---|---|---|---|---|---|---|---|---|---|---|---|---|---|---|---|---|---|---|---|---|---|---|---|---|---|---|---|---|---|---|---|---|---|---|---|---|---|---|---|---|---|---|---|
| ||||||||||||||||||||||||||||||||||||||||||||||||||
|


Before you start
configure link
display all issues
no more 1000 (Jira limitations)
in all the use cases below, we use JQL: 'project = name' and apply filtration with the TF macro
remember about date format and worklog settings
use one Jira issues table to create multiple pivot tables and charts
hide Jira user macro
настройки языка
Aggregating Issues by Assignee
Macro combination:
- Insert the Jira Issues macro.
- Wrap the Jira macro in the Table Filter macro.
- Wrap the Table Filter macro in the Pivot Table macro.

Macro configuration:
Table Filter:
| Filter Column | Status |
|---|---|
| Filter Type | Dropdown |
| Filter Values | Reversed filter 'Done' |
Pivot Table:
| Row Labels | Assignee |
|---|---|
| Column Labels | Status |
| Calculated Column | Key |
| Operation Type | Count, Literal |
Additional parameters:
- Set the Literal value delimiter option: Bulleted list.
- Hide totals of the pivot table.
| Handy Carousel |
|---|
|


Evaluating Calculated Planned and Spent Time Per Assignee
Macro combination:
- Insert the Jira Issues macro.
- Wrap the Jira macro in the Table Filter macro.
- Wrap the Table Filter macro in the Pivot Table macro.
- Add a table with a single column 'Time Evaluation' and containing the Status macros.

- Wrap the Pivot Table macro and the table containing statuses in the Table Transformer macro.
| Handy Tip | ||
|---|---|---|
| ||
If you don't need to have colorful statuses in the Time Evaluation column, don't add this single column table. |

Macro configuration:
Table Filter:
| Filter Column | Status |
|---|---|
| Filter Type | Dropdown |
| Filter Values | Done |
Pivot Table:
| Row Labels | Assignee |
|---|---|
| Column Labels | - |
| Calculated Column | Original Estimate, Time Spent |
| Operation Type | Sum |
Table Transformer:
Use the following SQL query:
| Code Block | ||
|---|---|---|
| ||
SELECT *, CASE WHEN 'Sum of Time Spent' > 'Sum of Original Estimate' THEN "OVERDUE" ELSE "IN TIME" END AS 'Time Evaluation' FROM T1 |
| Handy Carousel |
|---|
|


Visualizing of the Amount of Planned and Spent Time Within the Project
Macro combination:
- Insert the Jira Issues macro.
- Wrap the Jira macro in the Table Filter macro.
- Wrap the Table Filter macro in the Pivot Table macro.
- Wrap the Pivot Table macro in the Chart from Table macro.

Macro configuration:
Table Filter:
| Filter Column | Status |
|---|---|
| Filter Type | Dropdown |
| Filter Values | Done |
Pivot Table:
| Row Labels | T |
|---|---|
| Column Labels | - |
| Calculated Column | Original Estimate, Time Spent |
| Operation Type | Sum |
Chart from Table:
| Type | Bar |
|---|---|
| Labels Column | T |
| Values Column | Sum of Original Estimate, Sum of Time Spent |
| Handy Carousel |
|---|
|


Visualizing the Issues Distribution by Sprints or Releases
Macro combination:
- Insert the Jira Issues macro.
- Wrap the Jira macro in the Table Filter macro.
- Wrap the Table Filter macro in the Pivot Table macro.
- Wrap the Pivot Table macro in the Chart from Table macro.

Macro configuration:
Table Filter:
| Filter Column | Status |
|---|---|
| Filter Type | Dropdown |
| Filter Values | Reversed filter 'Done' |
Pivot Table:
| Row Labels | Assignee |
|---|---|
| Column Labels | Status |
| Calculated Column | Key |
| Operation Type | Count, Literal |
Chart from Table:
| Type | Stacked column |
|---|---|
| Labels Column | Fix Version(s) |
| Values Column | Count Improvement, Count New Feature |
Additional parameters:
- Set the Show data labels option: Percentage.
| Handy Carousel |
|---|
|


Comparison of Graphs of Open and Resolved Tasks
Macro combination (the chart is based on two transformed pivot tables):
Step 1. Configure Table1:
- Insert the Jira Issues macro.
- Wrap the Jira issues macro in the Pivot Table macro.
- Wrap the Pivot Table macro and the table containing statuses in the Table Transformer macro.
Step 2. Configure Table2:
- Insert the Jira Issues macro.
- Wrap the Jira macro in the Table Filter macro.
- Wrap the Table Filter macro in the Pivot Table macro.
- Wrap the Pivot Table macro and the table containing statuses in the Table Transformer macro.
Step 3. Wrap Table1 and Table2 in the Chart from Table macro.

Macro configuration:
Step 1. Configure Table1:
Pivot Table:
| Row Labels | Created |
|---|---|
| Column Labels | - |
| Calculated Column | Summary |
| Operation Type | Count |
Additional parameters:
- Set the Date period aggregation option: Week.
Table Transformer:
Use the following SQL query:
| Code Block | ||
|---|---|---|
| ||
SELECT 'Created', SUM (TT2.'Count') AS 'Count' FROM T1 AS TT1 JOIN T1 AS TT2 on TT1.'Created' >= TT2.'Created' GROUP BY TT1.'Created' ORDER BY TT1.'Created' |
| Handy Carousel |
|---|

|


Step 2. Configure Table2:
Table Filter:
| Filter Column | Resolved |
|---|---|
| Filter Type | Dropdown |
| Filter Values | Reversed filter '-empty-' |
Pivot Table:
| Row Labels | Resolved |
|---|---|
| Column Labels | - |
| Calculated Column | Summary |
| Operation Type | Count |
Additional parameters:
- Set the Date period aggregation option: Week.
Table Transformer:
Use the following SQL query:
| Code Block | ||
|---|---|---|
| ||
SELECT 'Resolved', SUM (TT2.'Count') AS 'Count' FROM T1 AS TT1 JOIN T1 AS TT2 on TT1.'Resolved' >= TT2.'Resolved' GROUP BY TT1.'Resolved' ORDER BY TT1.'Resolved' |
| Handy Carousel |
|---|
|


Step 3. Wrap Table1 and Table2 in the Chart from Table macro.
Chart from Table:
| Type | Time Area |
|---|---|
| Dates Column | Created, Resolved |
| Values Column | Count |

Visualizing Story Points Performance
Macro combination:
- Insert the Jira Issues macro.
- Wrap the Jira macro in the Table Filter macro.
- Wrap the Table Filter macro in the Pivot Table macro.
- Wrap the Pivot Table macro in the Chart from Table macro.

Macro configuration:
Table Filter:
| Filter Column | T | Sprint |
|---|---|---|
| Filter Type | Visual | Dropdown |
| Filter Values | Improvement, New Feature | Reversed filter: '-empty-' |
Pivot Table:
| Row Labels | Sprint |
|---|---|
| Column Labels | Status |
| Calculated Column | Story points |
| Operation Type | Sum |
Chart from Table:
| Type | Column |
|---|---|
| Labels Column | Sprint |
| Values Column | Sum of story points Done, Sum of story points In Progress, Sum of story points To Do |
Additional parameters:
- Set the Show trendline option.
| Handy Carousel |
|---|
|


Calculating Velocity
Macro combination:
- Insert the Jira Issues macro.
- Wrap the Jira macro in the Table Filter macro.
- Wrap the Table Filter macro in the Pivot Table macro.
- Wrap the Pivot Table macro and the table containing statuses in the Table Transformer macro.
- Wrap the Table Transformer macro in the Chart from Table macro.

Macro configuration:
Table Filter:
| Filter Column | Sprint |
|---|---|
| Filter Type | Dropdown |
| Filter Values | Reversed filter '-empty-' |
Pivot Table:
| Row Labels | Sprint |
|---|---|
| Column Labels | Status |
| Calculated Column | Story points |
| Operation Type | Sum |
Table Transformer:
Use the following SQL query:
| Code Block | ||
|---|---|---|
| ||
SELECT 'sprint', MIN(TT1.'Sum of story points') AS 'Story Points Committed', MIN(TT1.'Sum of story points Done') AS 'Story Points Completed', AVG(TT2.'Sum of story points Done') AS 'Velocity' FROM T1 AS TT1 JOIN T1 AS TT2 on TT1.'sprint' >= TT2.'sprint' WHERE TT1.'sprint'<>"Total" GROUP BY TT1.'sprint' ORDER BY TT1.'sprint' |
Additional parameters:
- Set the Decimal places option: 1.
Chart from Table:
| Type | Column |
|---|---|
| Labels Column | Story Points Committed |
| Values Column | Story Points Completed |
| Handy Carousel |
|---|
 |


Visualizing of Completed Story Points by Teams
Macro combination:
- Insert the Jira Issues macro.
- Wrap the Jira macro in the Table Filter macro.
- Add a table containing additional information for merging.
- Wrap the Table Filter macro and the table containing additional information in the Table Transformer macro.
- Wrap the Table Transformer macro in the Pivot Table macro.
- Wrap the Pivot Table macro in the Chart from Table macro.
| Handy Tip | ||
|---|---|---|
| ||
You can include any table from your Confluence instance using the Table Excerpt and Table Excerpt Include macros. |

Macro configuration:
Table Filter:
| Filter Column | Status | Sprint |
|---|---|---|
| Filter Type | Dropdown | Dropdown |
| Filter Values | Done | Reversed filter: '-empty-' |
Table Transformer:
Select the default Lookup tables preset and a column for matching the records. ![]()
| Handy Tip | ||
|---|---|---|
| ||
If the columns for matching have different labels in multiple tables, use the query from the example. |
Pivot Table:
| Row Labels | Sprint |
|---|---|
| Column Labels | Team |
| Calculated Column | Story points |
| Operation Type | Sum |
Chart from Table:
| Type | Column |
|---|---|
| Labels Column | Sprint |
| Values Column | Sum of story points Team 1, Sum of story points Team 2, Sum of story points Team 3 |
| Handy Carousel |
|---|
|


Building a Burnup Chart
Macro combination (the chart is based on two transformed pivot tables):
Step 1. Configure Table1:
- Insert the Jira Issues macro.
- Wrap the Jira Issues macro in the Table Filter macro.
- Wrap the Table Filter macro in the Pivot Table macro.
- Wrap the Pivot Table macro in the Table Transformer macro.
Step 2. Configure Table2:
- Insert the Jira Issues macro (or use one Jira issues macro for both tables with the help of the Table Excerpt and Table Excerpt Include macros).
- Wrap the Jira macro in the Table Filter macro.
- Wrap the Table Filter macro in the Pivot Table macro.
- Place the Pivot Table macro in a cell of the manually created table containing start and end dates of a sprint.
Step 3. Wrap Table1 and Table2 in the Chart from Table macro.

Macro configuration:
Step 1. Configure Table1:
Table Filter:
| Filter Column | Status | Sprint |
|---|---|---|
| Filter Type | Dropdown | Dropdown |
| Filter Values | Done | ECS Sprint 3 |
Pivot Table:
| Row Labels | Resolved |
|---|---|
| Column Labels | - |
| Calculated Column | Story points |
| Operation Type | Sum |
Table Transformer:
Use the following SQL query:
| Code Block | ||
|---|---|---|
| ||
SELECT 'Resolved', SUM (TT2.'Sum of story points') AS 'Actual' FROM T1 AS TT1 JOIN T1 AS TT2 on TT1.'Resolved' >= TT2.'Resolved' GROUP BY TT1.'Resolved' ORDER BY TT1.'Resolved' |
| Handy Carousel |
|---|
|


Step 2. Configure Table2:
Table Filter:
| Filter Column | Sprint |
|---|---|
| Filter Type | Dropdown |
| Filter Values | ECS Sprint 3 |
Pivot Table:
| Row Labels | - |
|---|---|
| Column Labels | - |
| Calculated Column | Story points |
| Operation Type | Sum |

Step 3. Wrap Table1 and Table2 in the Chart from Table macro.
Chart from Table:
| Type | Time Line |
|---|---|
| Dates Column | Resolved |
| Values Column | Ideal, Actual |

Building a Gantt Chart
Macro combination:
- Insert the Jira Issues macro.
- Wrap the Jira Issues macro in the Table Filter macro.
- Wrap the Table Filter macro in the Table Transformer macro.
- Add a table containing project milestones.

- Wrap the Table Filter macro and the table containing milestones in the Table Transformer macro.
- Wrap the Table Transformer macro and the table in the Chart from Table macro.
| Handy Tip | ||
|---|---|---|
| ||
You can include any table from your Confluence instance using the Table Excerpt and Table Excerpt Include macros or use any default and custom columns of the Jira Issues macro. |
| Handy Tip | ||
|---|---|---|
| ||
We insert the Table Transformer macro in order to calculate the Completion ratio based on the Jira Issues macro columns. If you have any other column containing percentage values or don't need to visualize progress bars in the chart, you can skip this step. |

Macro configuration:
Table Filter:
| Filter Column | Issue type | Sprint |
|---|---|---|
| Filter Type | Visual | Dropdown |
| Filter Values | New feature, Improvement | ECS Sprint 2, ECS Sprint 3, ECS Sprint 4 |
Table Transformer:
Use the following SQL query:
| Code Block | ||
|---|---|---|
| ||
SELECT *,
CASE WHEN 'Status' = "Done"
THEN "100%"
WHEN 'Status' = "To Do"
THEN "0%"
ELSE (100 - ('Remaining Estimate' / 'Time Spent' * 100) + "%")
END AS 'Completion Ratio'
FROM T* |
Chart from Table:
| Type | Gantt |
|---|---|
| Labels Column | Sprint, Key, Milestone |
| Values Column | Created, Due, Completion ratio, Date |
| Handy Carousel |
|---|
 |

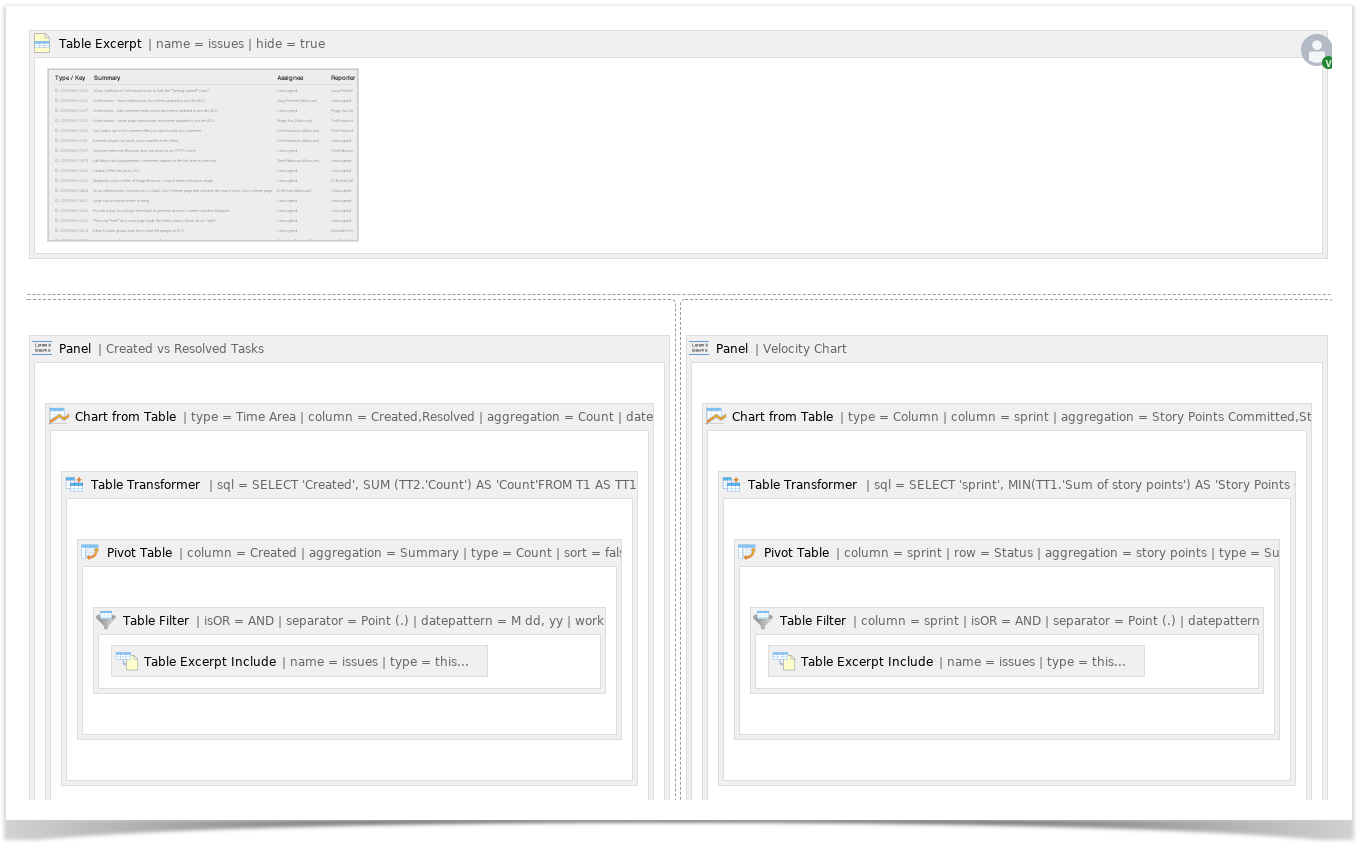
Creating a Dashboard Based on One Table

You can create a dashboard with multiple charts and pivot tables based on one Jira Issues macro with the helsp of the Table Excerpt and Table Excerpt Include macros.
The following options are useful for better viewing:
- Hide filtration panel (Tabel Filter)
- Hide control panel (Pivot Table)
- Hide chart controls (Chart from Table)
- Show/hide source table (in Table filter, Pivot Table, Chart from Table)
- Set chart dimensions
- Align a chart
- Chart legend position
- Set colors and line settings
| Handy Carousel |
|---|
|


Create a user macro to hide the unnecessary information from the Jira Issues macro:

| Code Block | ||
|---|---|---|
| ||
## @noparams


<style>

.refresh-issues-bottom { display: none}

</style> |