...
| Excerpt | ||
|---|---|---|
| ||
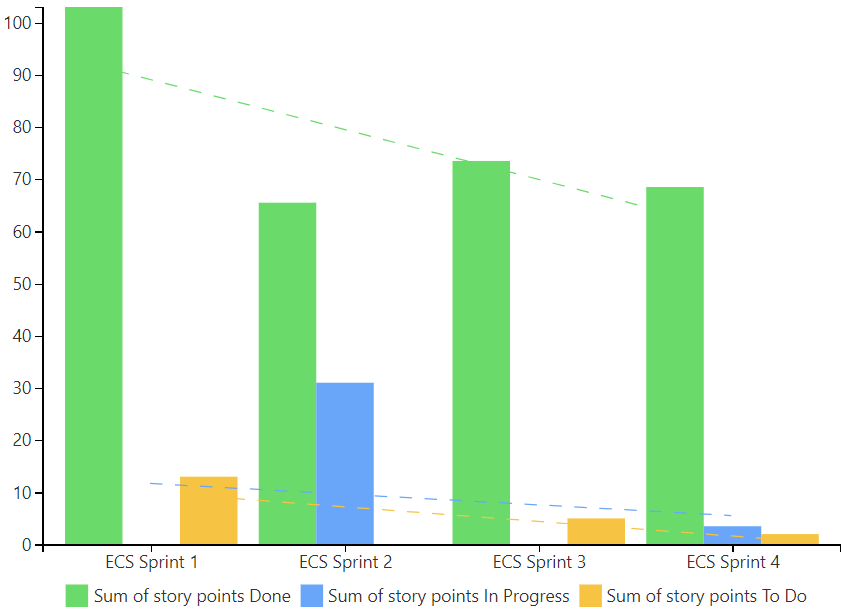
Visualizing Story Points Performance
|
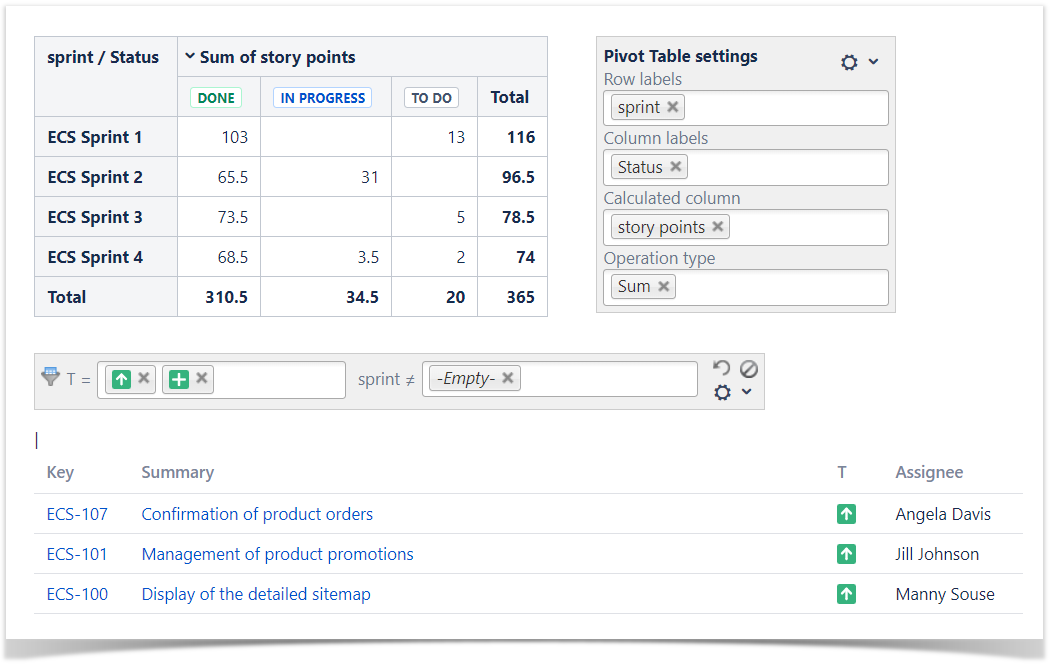
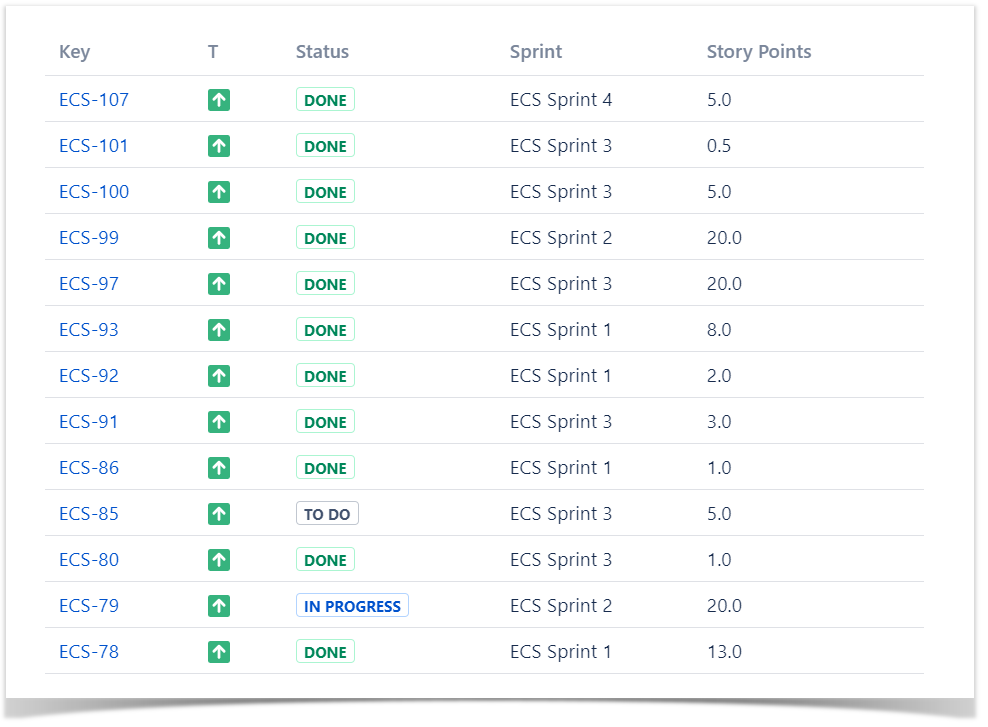
The Source Table:
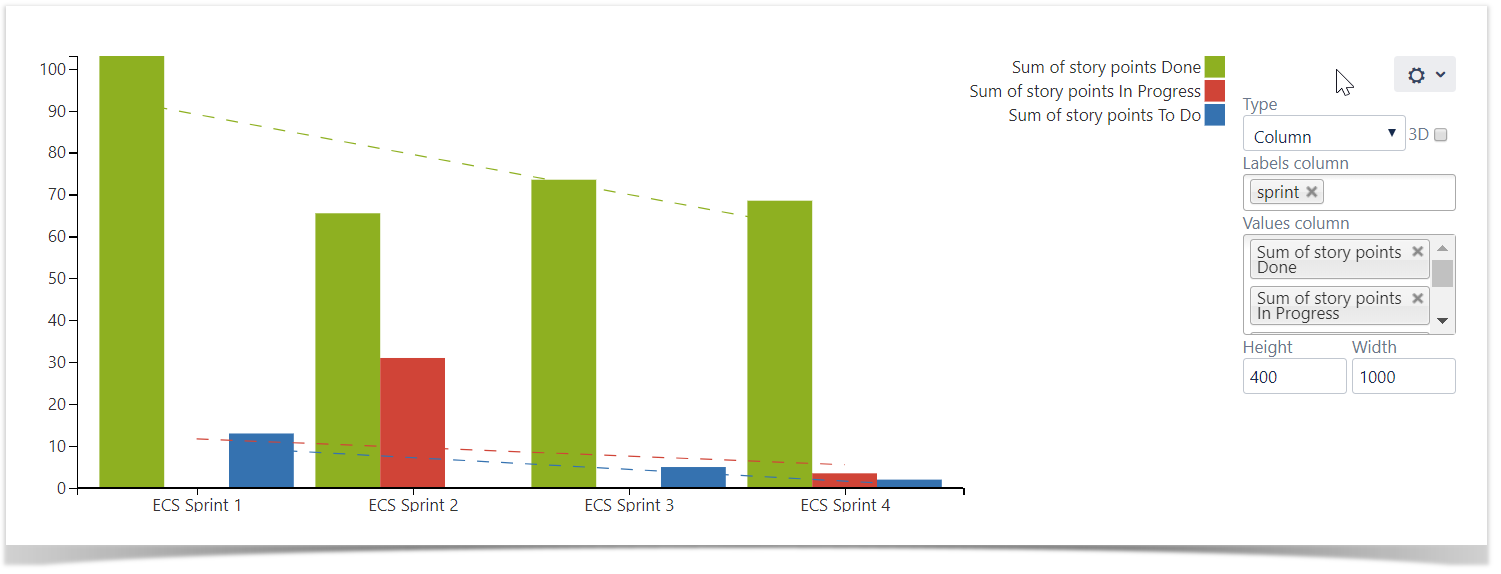
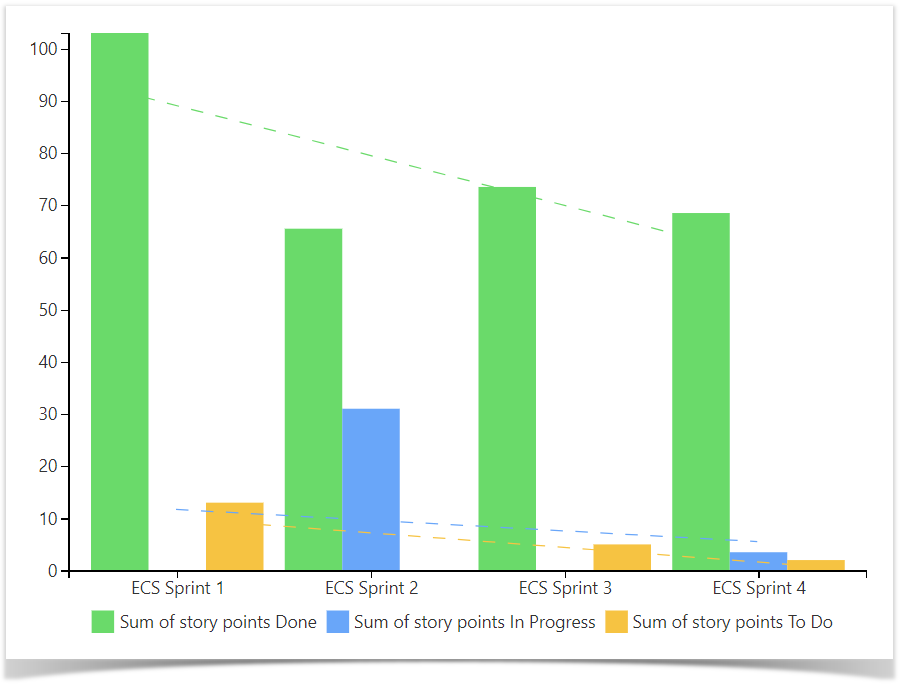
The Result:
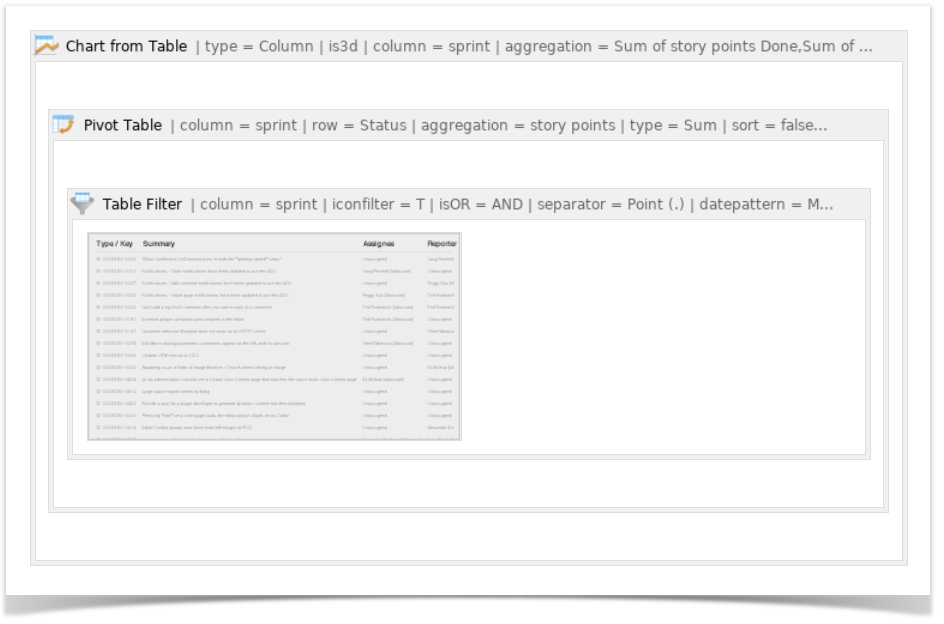
Macro combination:
- Insert the Jira Issues macro.
- Wrap the Jira Issues macro in the Table Filter macro.
- Wrap the Table Filter macro in the Pivot Table macro.
- Wrap the Pivot Table macro in the Chart from Table macro.
Macro configuration:
Table Filter:
| Filter Column | T | Sprint |
|---|---|---|
| Filter Type | Visual | Dropdown |
| Filter Values | Improvement, New Feature | Reversed filter: '-empty-' |
Pivot Table:
| Row Labels | Sprint |
|---|---|
| Column Labels | Status |
| Calculated Column | Story points |
| Operation Type | Sum |
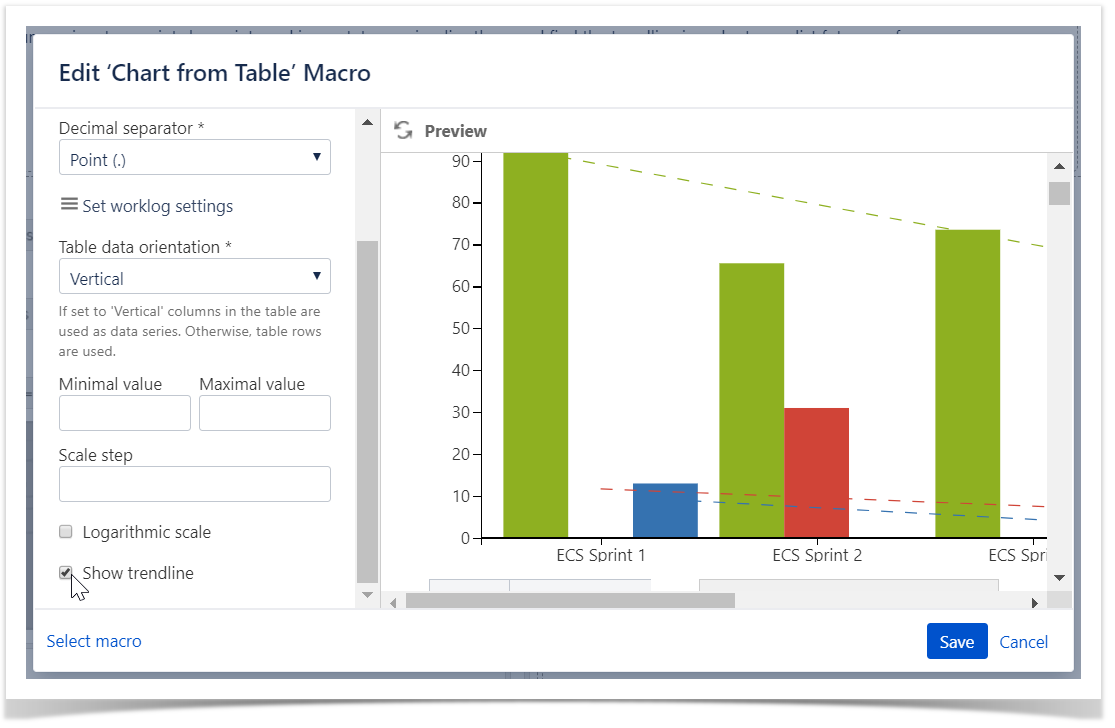
Chart from Table:
| Type | Column |
|---|---|
| Labels Column | Sprint |
| Values Column | Sum of story points Done, Sum of story points In Progress, Sum of story points To Do |
Additional parameters:
- Set the Show trendline option.
| Handy Carousel |
|---|
|