...
| Excerpt | ||
|---|---|---|
| ||
Building a Burnup Chart
|
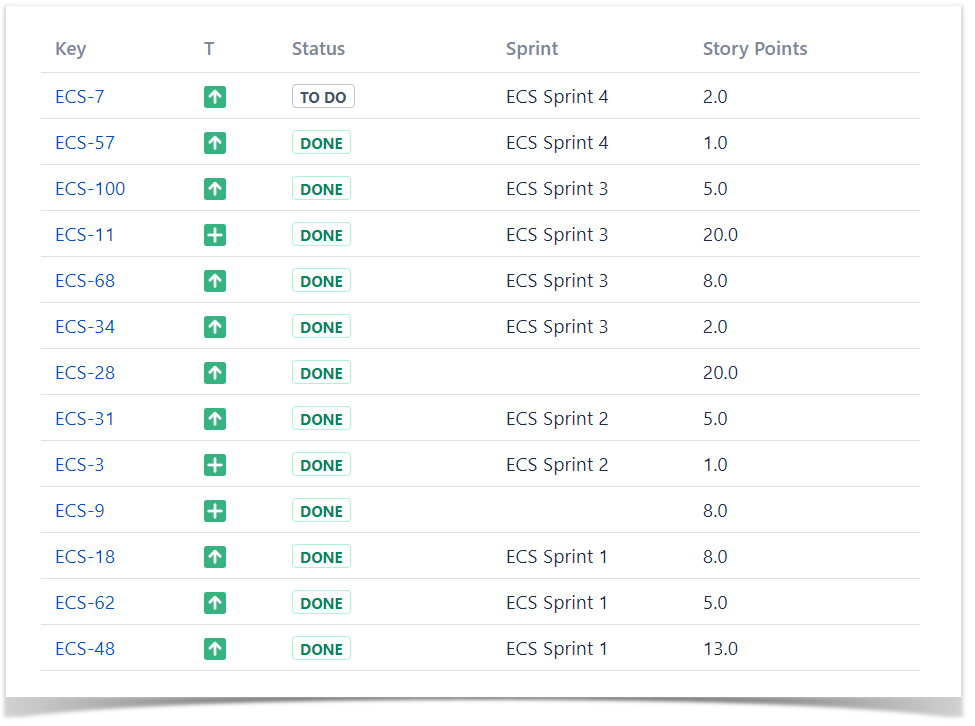
The Source Table:
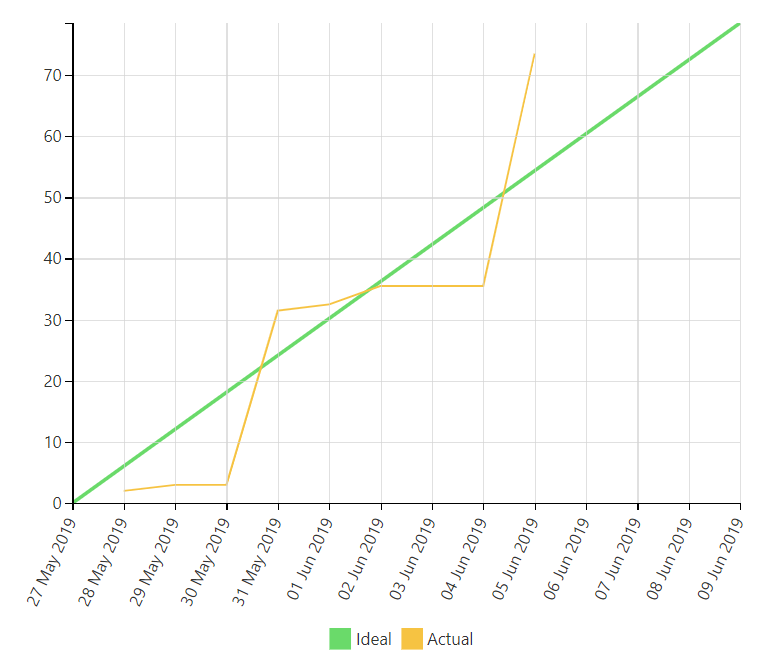
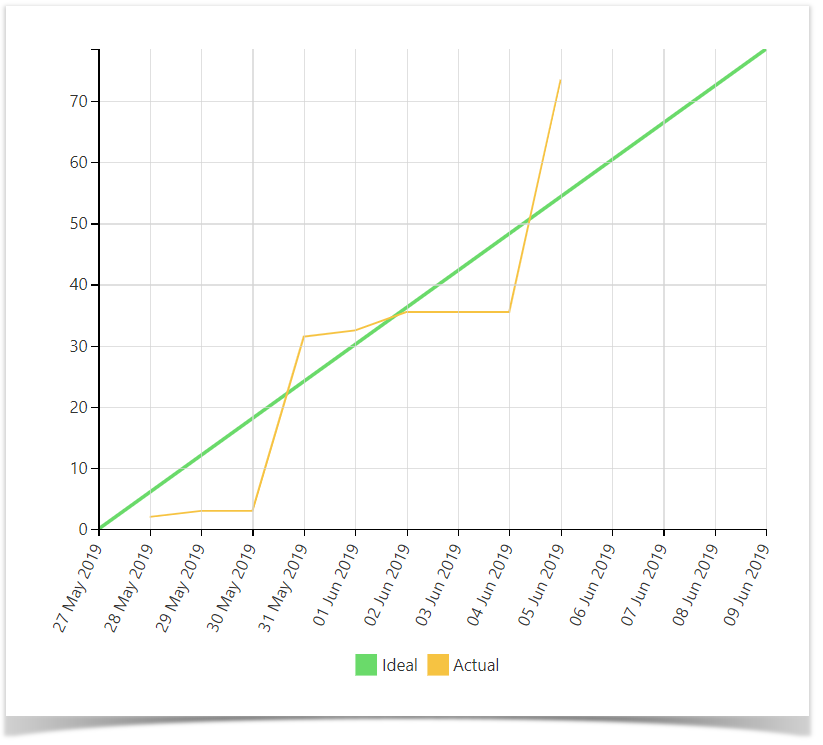
The Result:
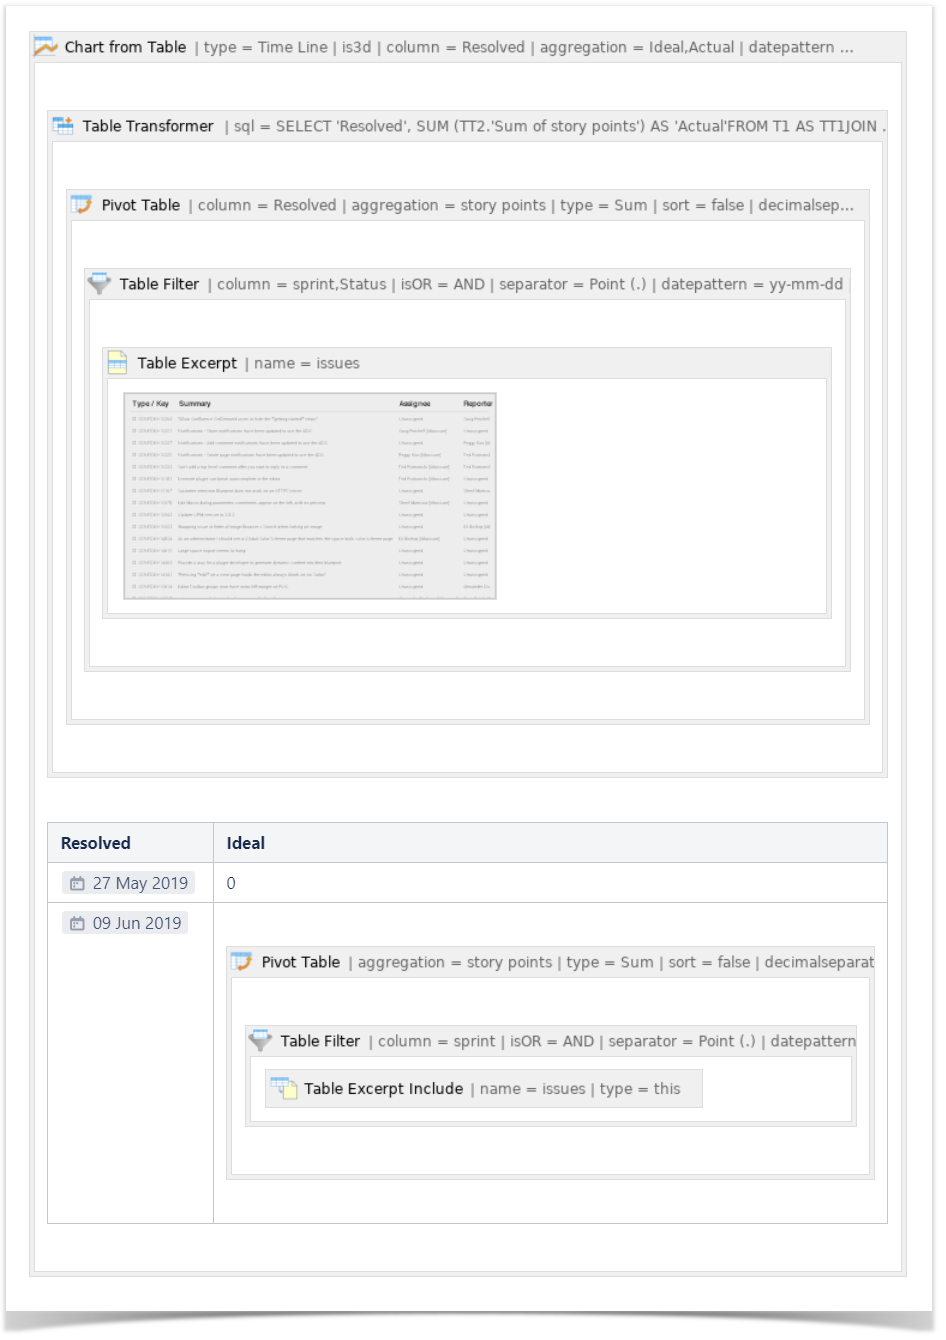
Macro combination (the chart is based on two transformed pivot tables):
Step 1. Configure Table1:
- Insert the Jira Issues macro.
- Wrap the Jira Issues macro in the Table Filter macro.
- Wrap the Table Filter macro in the Pivot Table macro.
- Wrap the Pivot Table macro in the Table Transformer macro.
Step 2. Configure Table2:
- Insert the Jira Issues macro (or use one Jira issues macro for both tables with the help of the Table Excerpt and Table Excerpt Include macros).
- Wrap the Jira Issues macro in the Table Filter macro.
- Wrap the Table Filter macro in the Pivot Table macro.
- Place the Pivot Table macro in a cell of the manually created table containing start and end dates of a sprint.
Step 3. Wrap Table1 and Table2 in the Chart from Table macro.
Macro configuration:
Step 1. Configure Table1:
Table Filter:
| Filter Column | Status | Sprint |
|---|---|---|
| Filter Type | Dropdown | Dropdown |
| Filter Values | Done | ECS Sprint 3 |
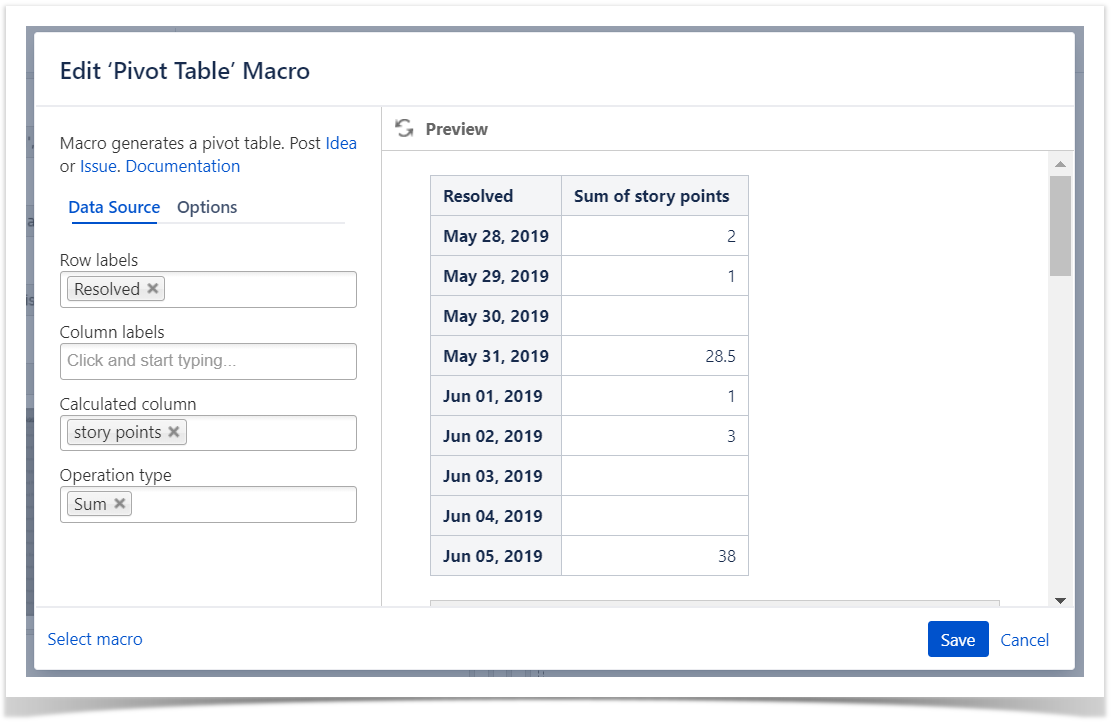
Pivot Table:
| Row Labels | Resolved |
|---|---|
| Column Labels | - |
| Calculated Column | Story points |
| Operation Type | Sum |
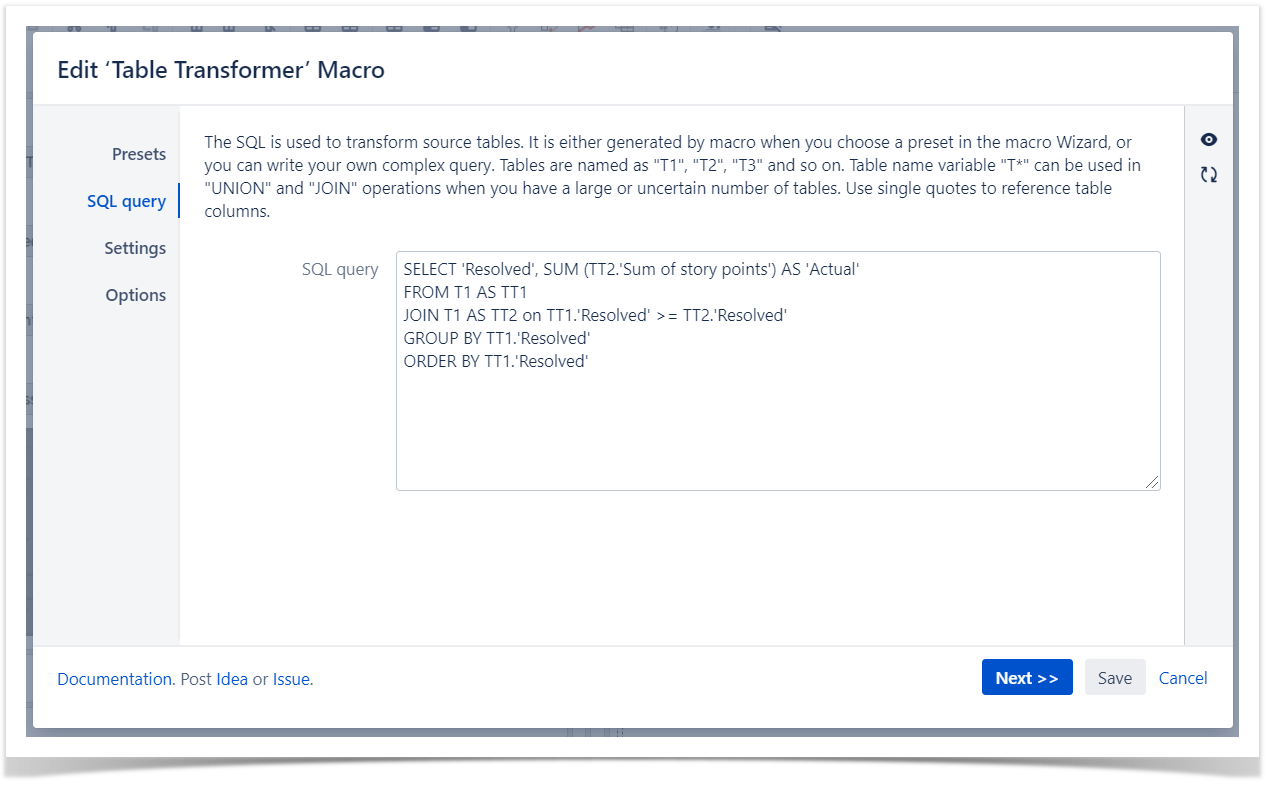
Table Transformer:
Use the following SQL query:
| Code Block | ||
|---|---|---|
| ||
SELECT 'Resolved', SUM (TT2.'Sum of story points') AS 'Actual' FROM T1 AS TT1 JOIN T1 AS TT2 on TT1.'Resolved' >= TT2.'Resolved' GROUP BY TT1.'Resolved' ORDER BY TT1.'Resolved' |
| Handy Carousel |
|---|
|
Step 2. Configure Table2:
Table Filter:
| Filter Column | Sprint |
|---|---|
| Filter Type | Dropdown |
| Filter Values | ECS Sprint 3 |
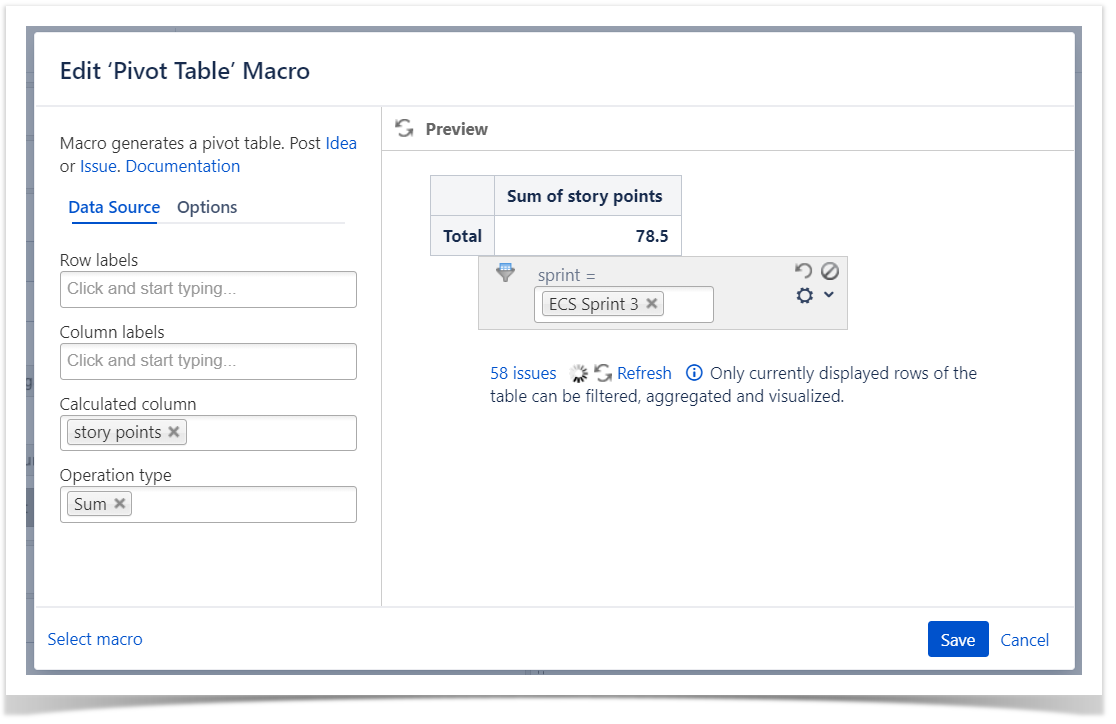
Pivot Table:
| Row Labels | - |
|---|---|
| Column Labels | - |
| Calculated Column | Story points |
| Operation Type | Sum |
Step 3. Wrap Table1 and Table2 in the Chart from Table macro.
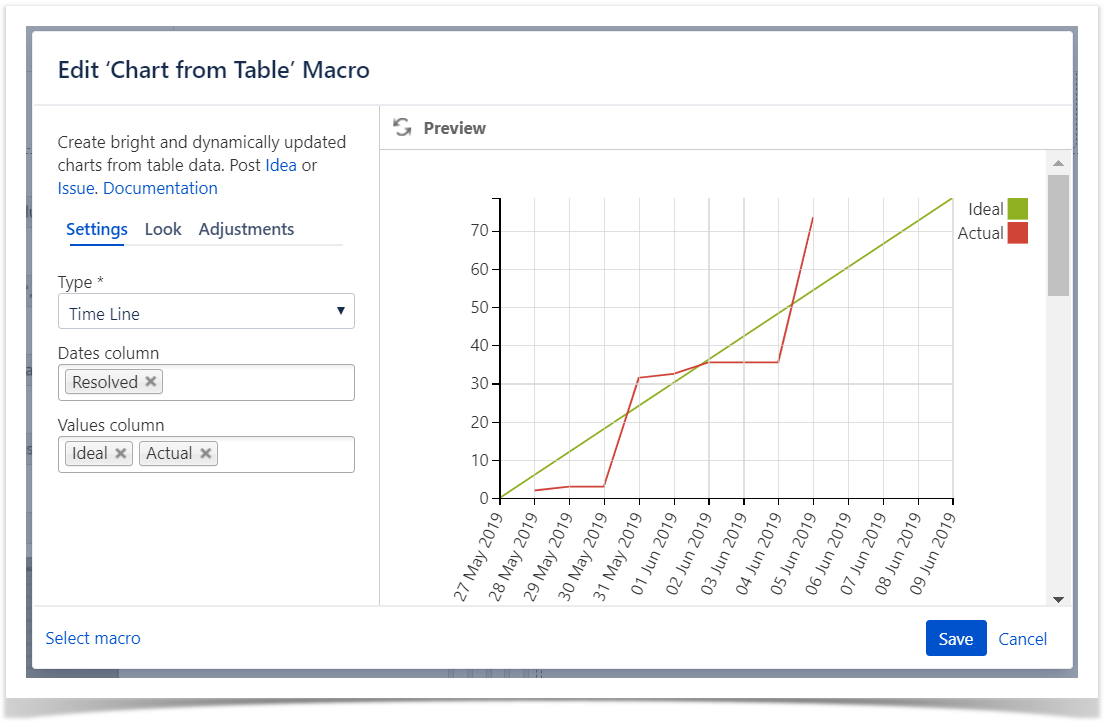
Chart from Table:
| Type | Time Line |
|---|---|
| Dates Column | Resolved |
| Values Column | Ideal, Actual |