...
| Panel |
|---|
...
| title | Welcome to your new space! |
|---|
...
Confluence spaces are great for sharing content and news with your team. This is your home page. Right now it shows recent space activity, but you can customize this page in any way you like.
Complete these tasks to get started
- Edit this home page - Click Edit in the top right of this screen to customize your Space home page
- Create your first page - Click the Create button in the header to get started
- Brand your Space - Click Configure Sidebar in the left panel to update space details and logo
- Set permissions - Click Space Tools in the left sidebar to update permissions and give others access
Recent space activity
| Recently Updated | ||||||||
|---|---|---|---|---|---|---|---|---|
|
Space contributors
| Contributors | ||||||||||
|---|---|---|---|---|---|---|---|---|---|---|
|
| ||||||||||
Join our Product Advisory program to get free access to our new Cloud apps and start contributing to solutions that will be used worldwide.
View terms and conditions |
About
Project Performance Dashboard is a tool which can give you valuable insights into how your project evolves and how your team performs.
The app automatically calculates the reporting data for your software projects and generates the following charts:
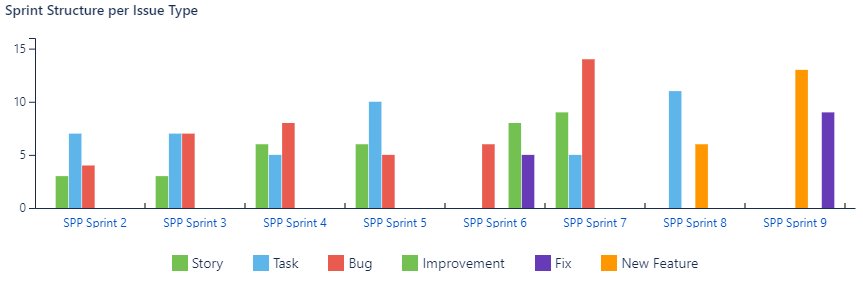
- Sprint Structure per Issue Type
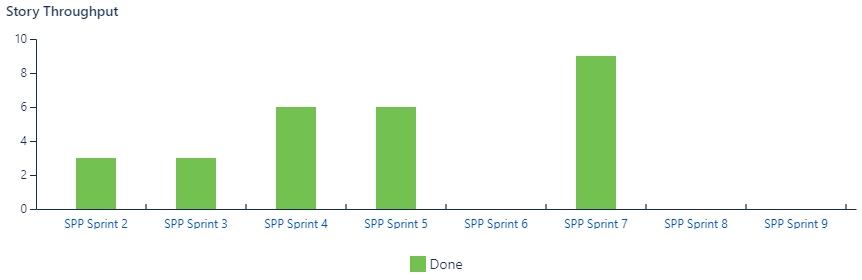
- Story Throughput
Charts
| Chart | What it shows |
|---|---|
| Sprint Structure per Issue TypeThis chart type shows the distribution of issue types across last eight sprints. This way you can track the scope of your sprints and identify whether you create new functionality or address issues and refactor code from older sprints. Normally, each sprint should contain at least 50-60%% of stories and new features, 20% of bugs or less, 15% for improvements. If there |
| Story ThroughputThis chart is similar to Sprint Velocity and helps you to count the number of stories finished in a sprint. Within this metric, stories should be included into the sprint they were completed, not started in. Story Throughput is a highly useful metric. If all your stories are similar in size, you can use ST instead of Velocity. If your stories have a normal distribution (one part of your stories has a specific average size, and the other part goes below and above that average), you can also use ST instead of Sprint Burndown and Sprint Burnup. |
...