| Info |
|---|
This feature is available only under a commercial or evaluation license. |
There are project and repository Activity graphs.
To view the project Activity graph:
- navigate to the project of your choice
- click Graphs on the left-hand sidebar
- you'll see the Activity page in the Graphs tab
To view the repository Activity graph:
...
- while browsing the Activity graph of a certain project, select one of its repositories from the Repository Selection drop-down menu with the list of all the repositories of the current project:

In the Activity tab, in the upper part, you can see Commits Chart and Pull Requests Chart showing the number of commits/pull requests made by top contributors during the selected time span.
...
- number of days included into the selected time span
- total number of commits made during the selected time span
- total number of contributors who contributed to the project/repository during the selected time span
...
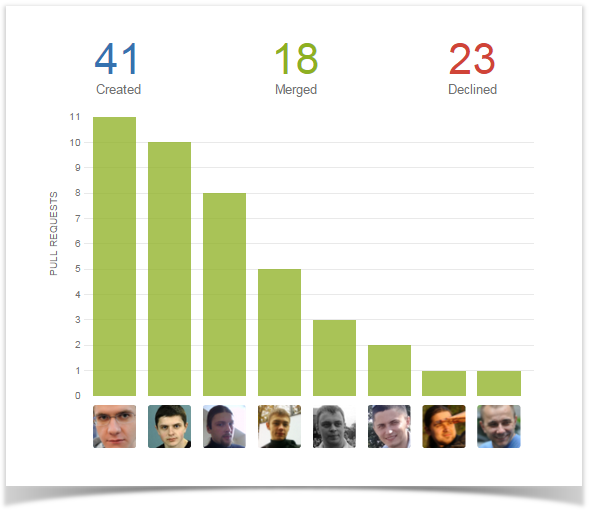
Pull Requests Chart displays the contributors with the biggest number of pull requests over the selected time span. Each bar represents the number of pull requests created by one contributor. Above the chart you can see the total number of pull requests created, merged and declined during the selected time span.
It's possible to hide Pull Requests Chart.
To hide the chart of the Activity page in a project, a user needs global administrator or project admin permissions.
To hide the chart of the Activity page in a repository, a user needs Stash users with global administrator, project admin or repository admin permissions can hide Pull Requests Chart.
To do that, it's necessary to:
- navigate to the Activity tab of the Awesome Graphs section in the project/repository settings
- clear the 'Display pull requests chart' checkbox
- click 'Save'
...