| Info |
|---|
This feature is available only under a commercial or evaluation license. |
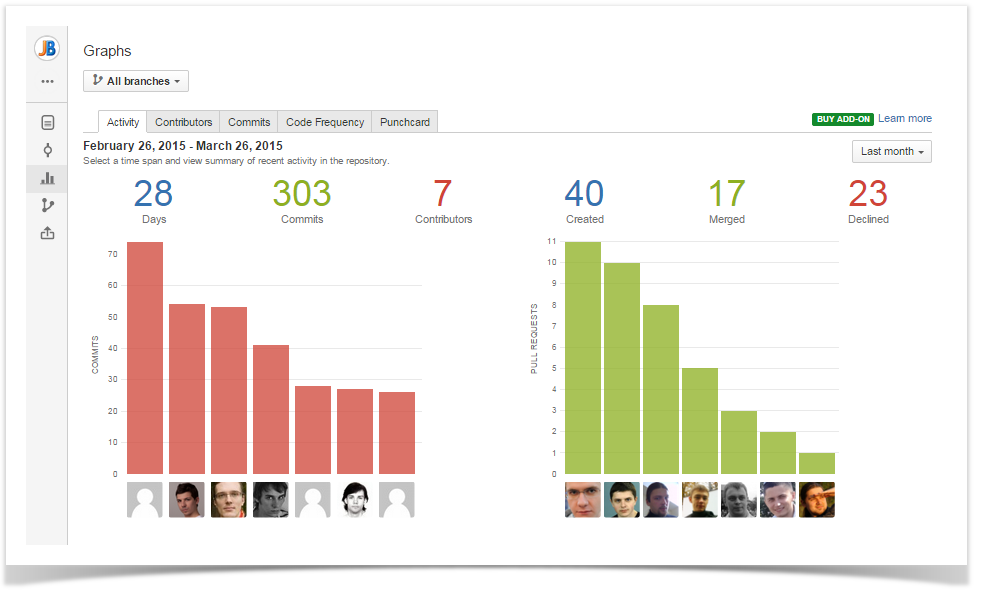
Activity graphs allow you to track the recent activity in your projects and repositories.
In the Activity tab, in the upper part, you can see Commits Chart and Pull Requests Chart showing the number of commits/pull requests made by top contributors during the selected time span.

There are project and repository Activity graphs.
| Talk | ||
|---|---|---|
|
View the project graph
To view the project Activity graph:
- navigate to the project of your choice
- click Graphs on the left-hand sidebar
- you'll see the Activity page in the Graphs tab
View the repository graph
To view the repository Activity graph:
- navigate to the repository of your choice
- click Graphs on the left-hand sidebar
- you'll see the Activity page in the Graphs tab
or
Also while browsing the Activity graph of a certain project, select one of its repositories from the Repository Selection drop-down menu with the list of all the repositories of the current project:

In the Activity tab, in the upper part, you can see Commits Chart and Pull Requests Chart showing the number of commits/pull requests made by top contributors during the selected time span.
Time Span
To set a time span, navigate to the Time Span menu and select one of the options from the drop-down list.
...