...
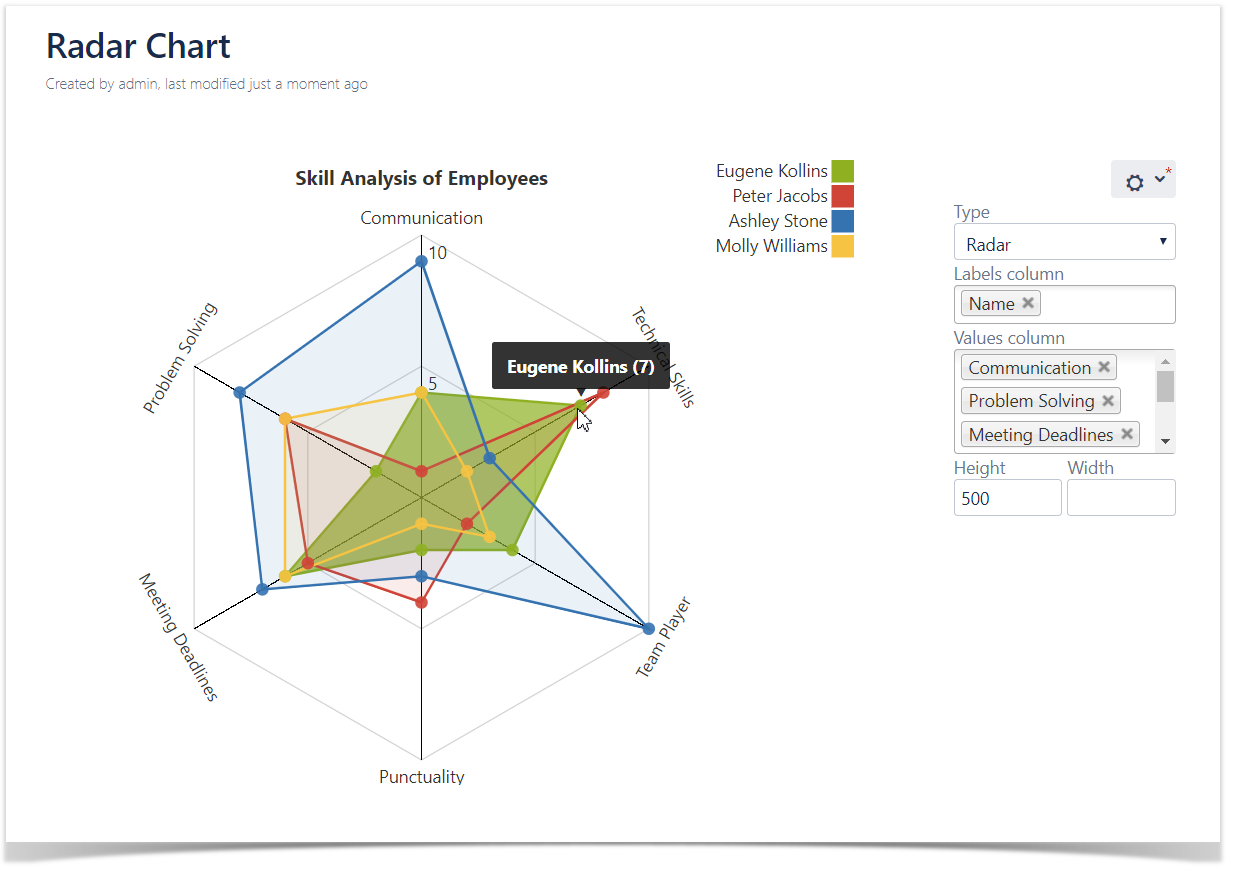
The chart displays multivariate data in the form of a two-dimensional chart of three or more quantitative variables. The chart can be applied to sort the variables into relative positions that reveal distinct correlations, trade-offs, and a multitude of other comparative measures.
Version 5.2 also includes the following features:
...