| Warningmybanner |
|---|
This version of the app's documentation is outdated. Please find the information you're looking for here: |
| Excerpt | ||
|---|---|---|
| ||
Comparison of Graphs of Open and Resolved Tasks
|
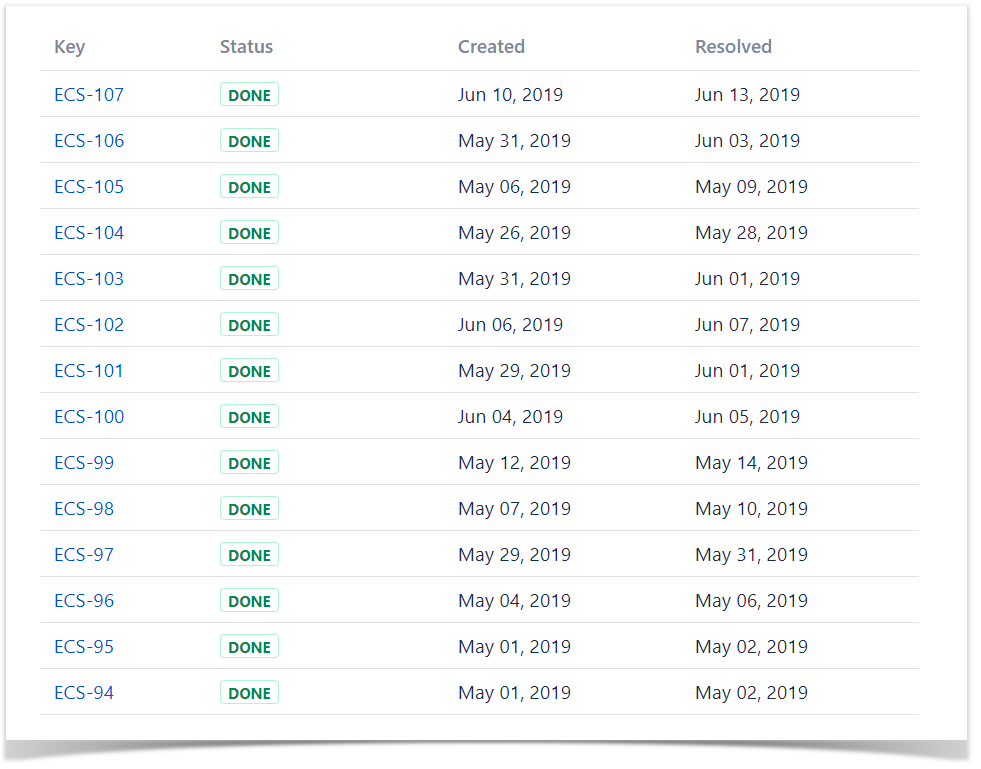
The Source Table:
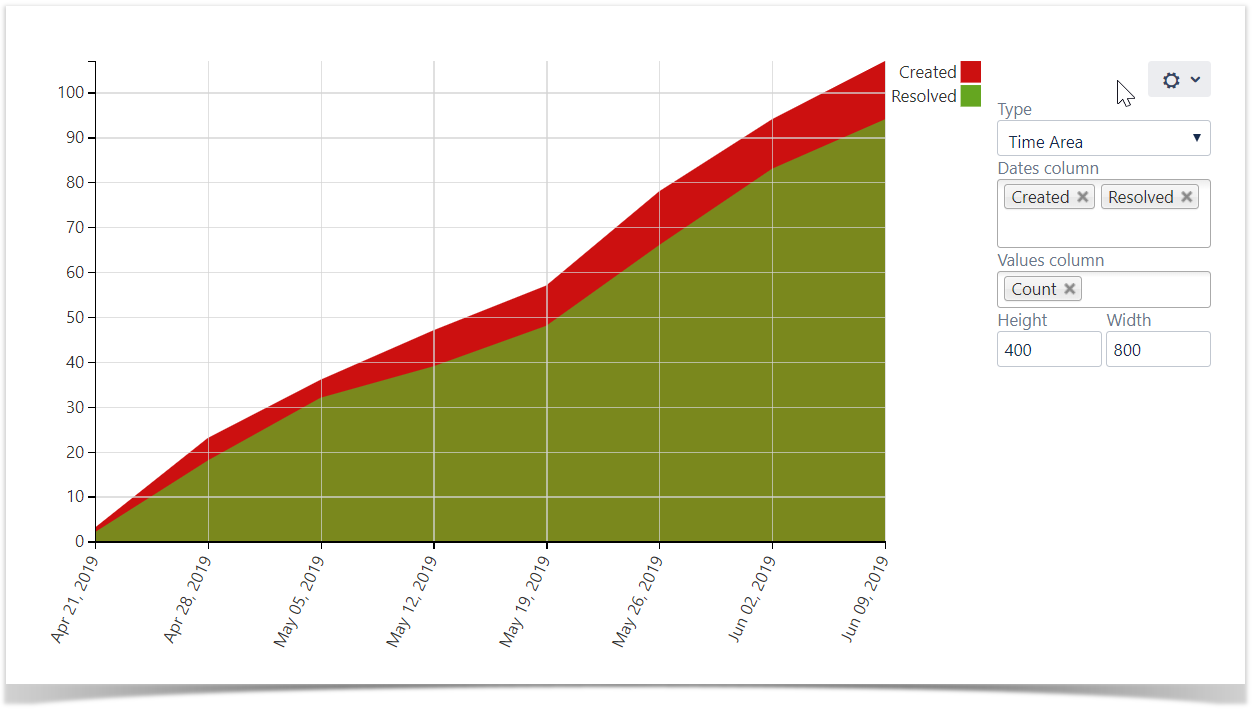
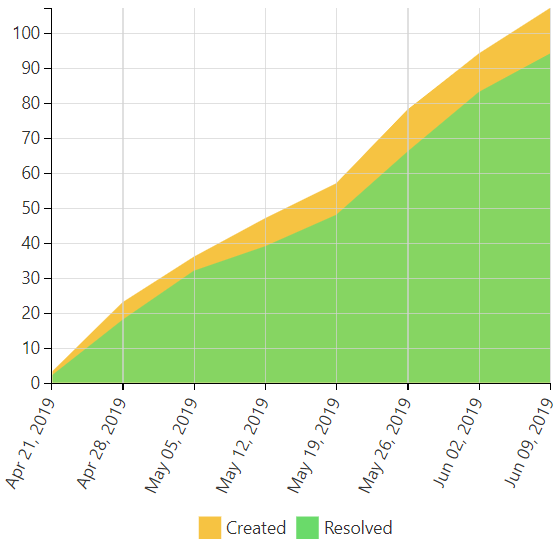
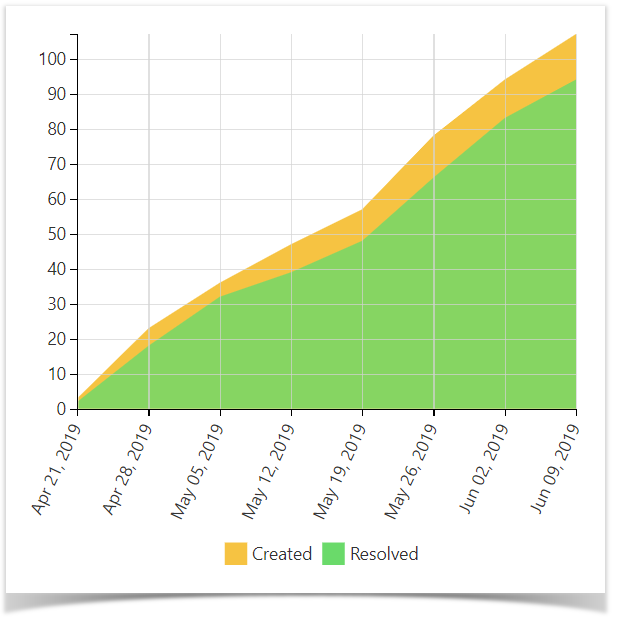
The Result:
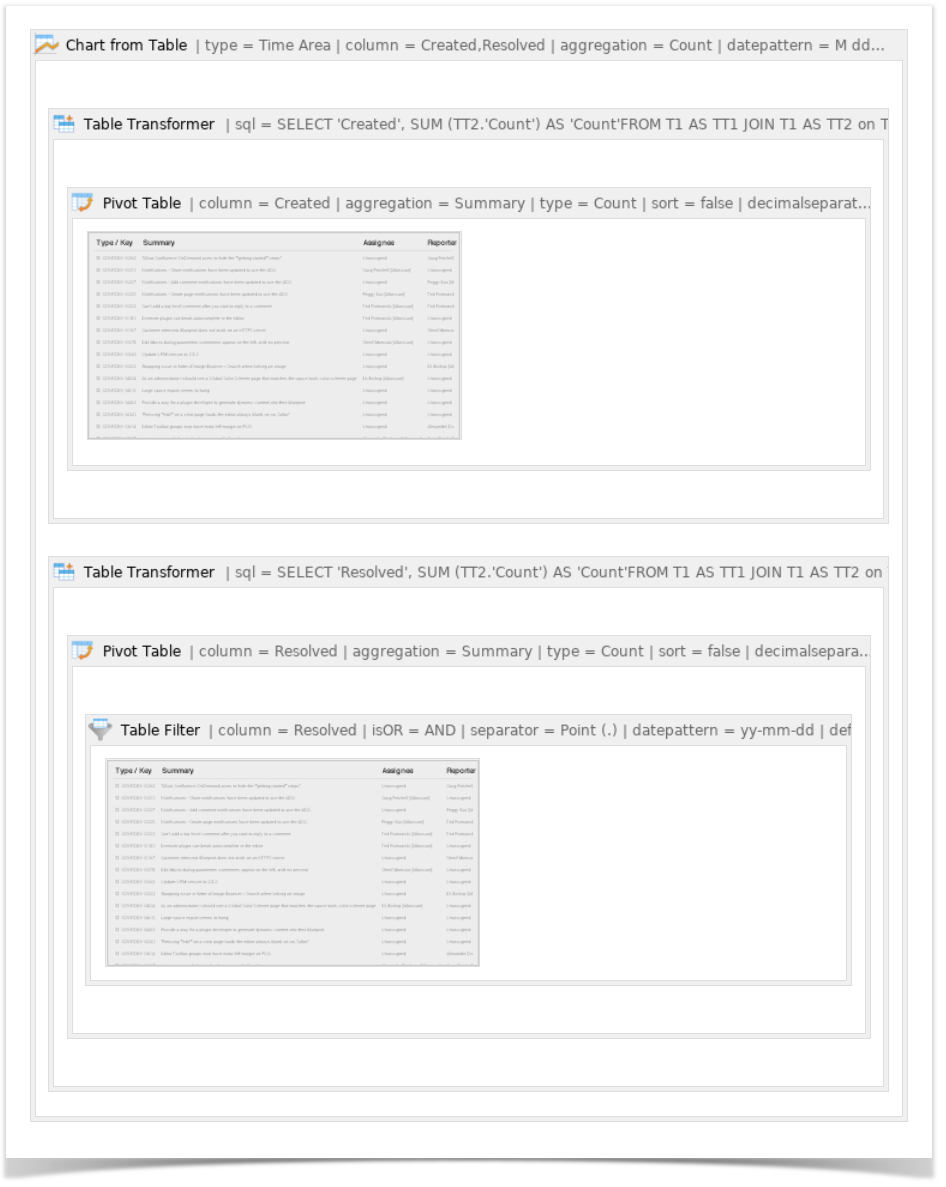
Macro combination (the chart is based on two transformed pivot tables):
Step 1. Configure Table1:
- Insert the Jira Issues macro.
- Wrap the Jira issues macro in the Pivot Table macro.
- Wrap the Pivot Table macro in the Table Transformer macro.
Step 2. Configure Table2:
- Insert the Jira Issues macro.
- Wrap the Jira Issues macro in the Table Filter macro.
- Wrap the Table Filter macro in the Pivot Table macro.
- Wrap the Pivot Table macro in the Table Transformer macro.
Step 3. Wrap Table1 and Table2 in the Chart from Table macro.
Macro configuration:
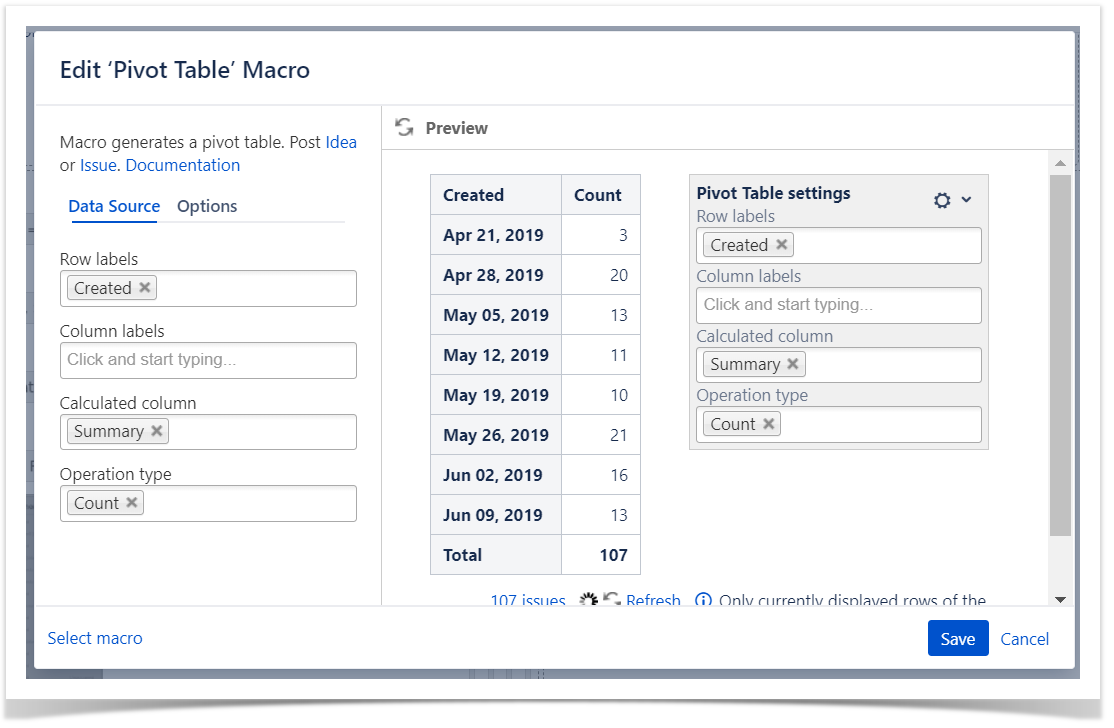
Step 1. Configure Table1:
Pivot Table:
| Row Labels | Created |
|---|---|
| Column Labels | - |
| Calculated Column | Summary |
| Operation Type | Count |
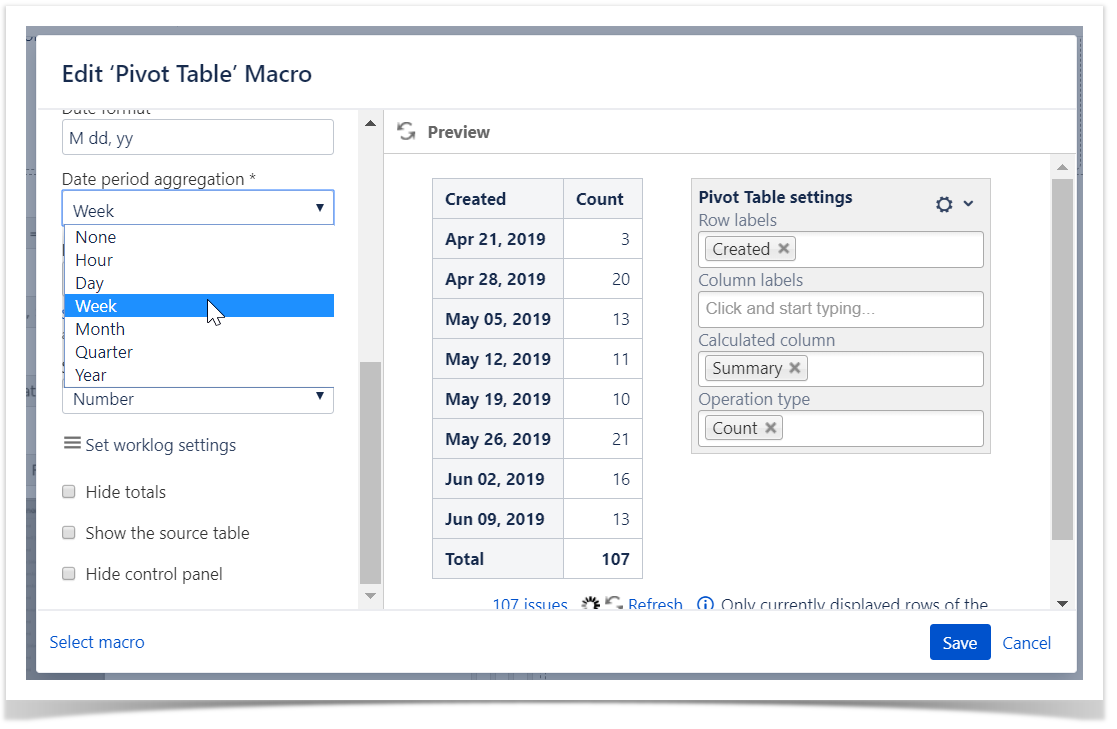
Additional parameters:
- Set the Date period aggregation option: Week.
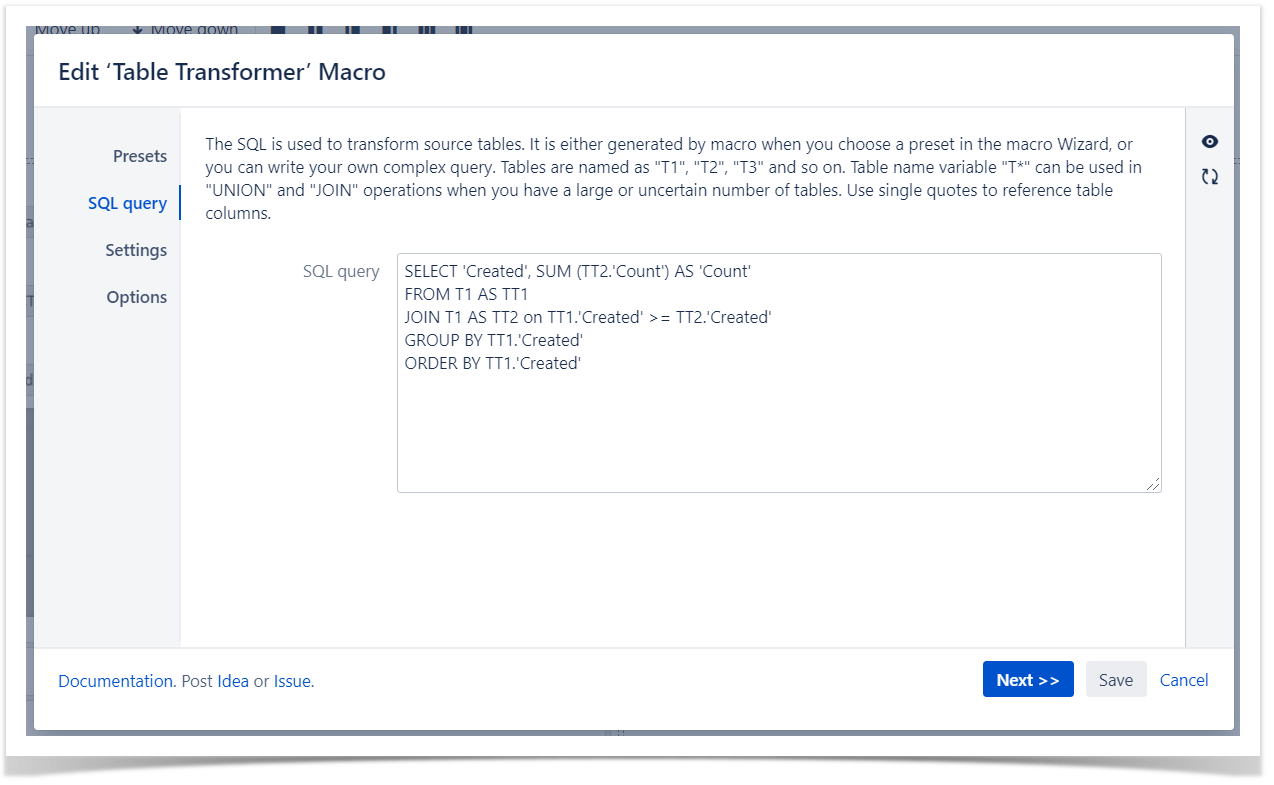
Table Transformer:
Use the following SQL query:
| Code Block | ||
|---|---|---|
| ||
SELECT 'Created', SUM (TT2.'Count') AS 'Count' FROM T1 AS TT1 JOIN T1 AS TT2 on TT1.'Created' >= TT2.'Created' GROUP BY TT1.'Created' ORDER BY TT1.'Created' |
| Handy Carousel |
|---|
|
Step 2. Configure Table2:
Table Filter:
| Filter Column | Resolved |
|---|---|
| Filter Type | Dropdown |
| Filter Values | Reversed filter '-empty-' |
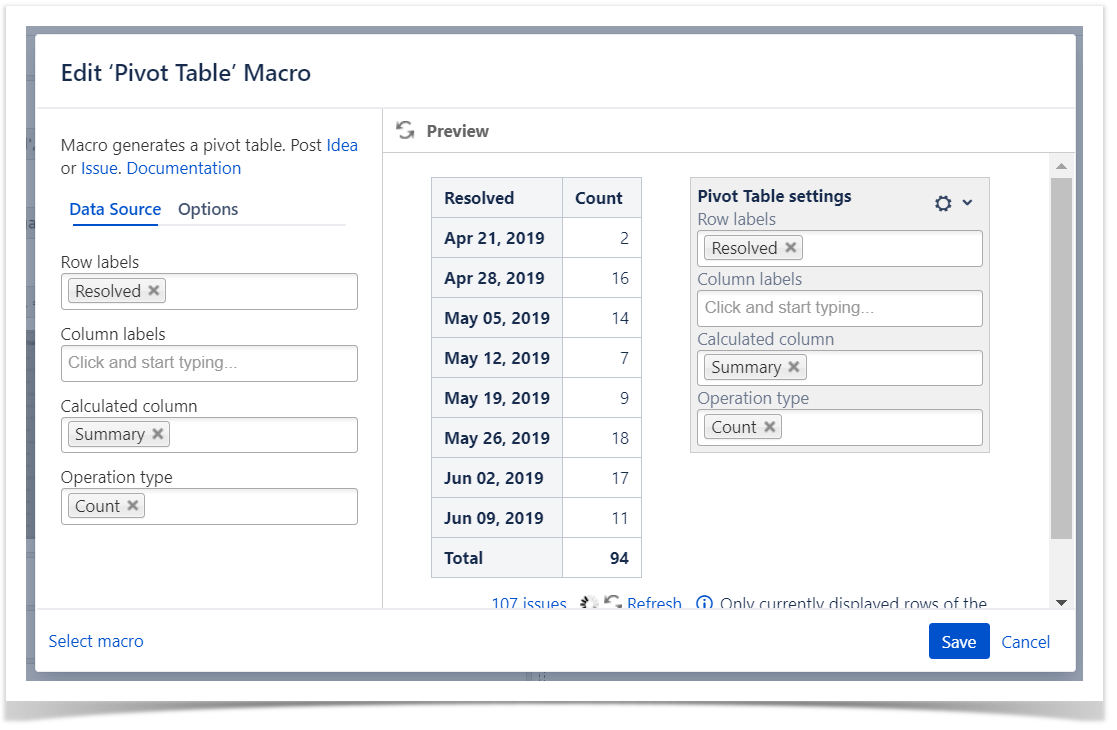
Pivot Table:
| Row Labels | Resolved |
|---|---|
| Column Labels | - |
| Calculated Column | Summary |
| Operation Type | Count |
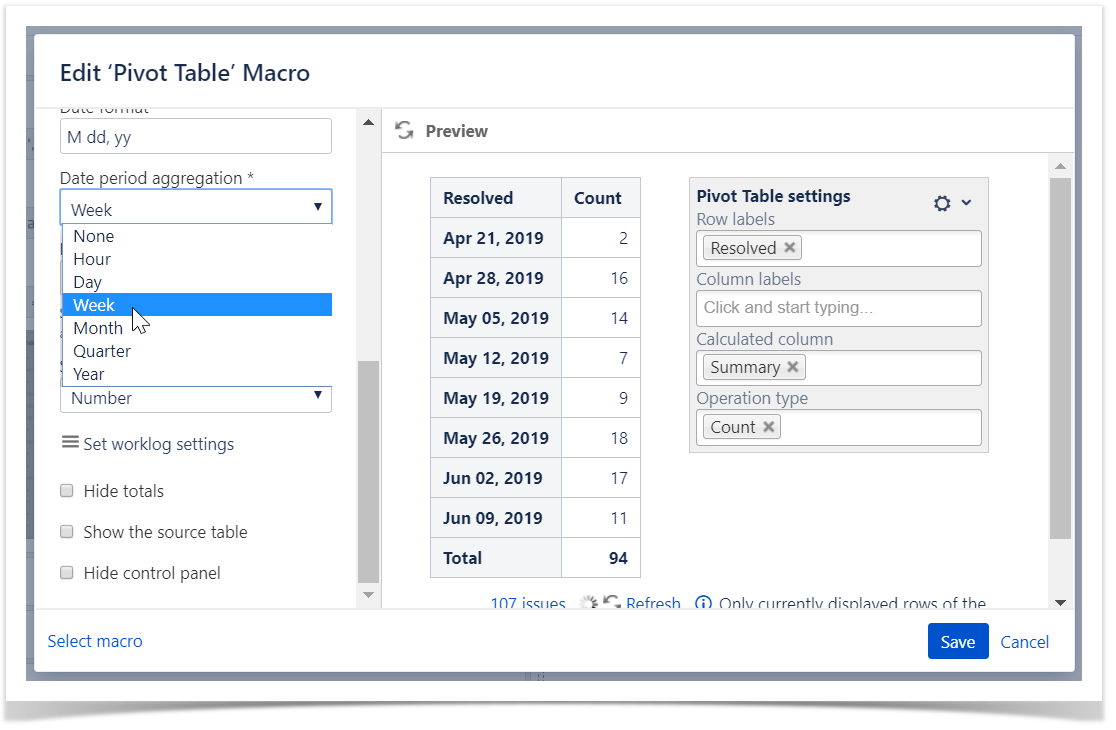
Additional parameters:
- Set the Date period aggregation option: Week.
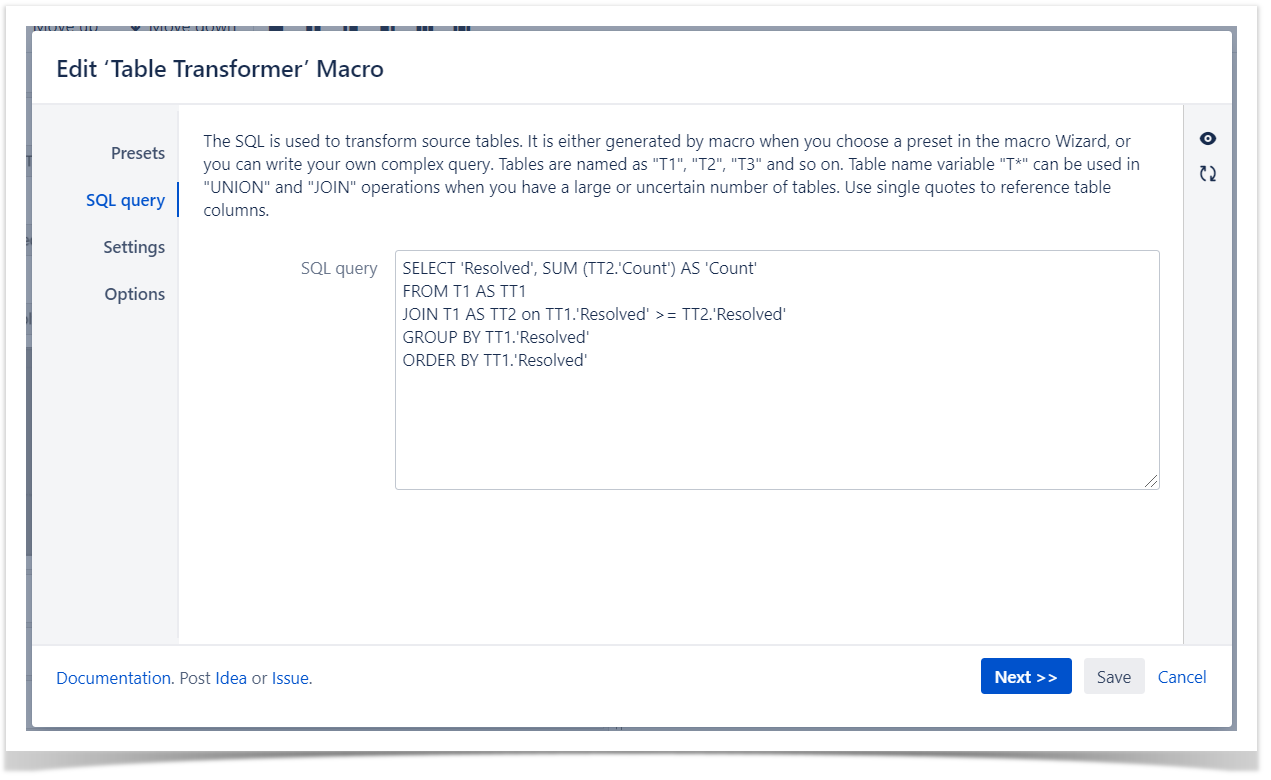
Table Transformer:
Use the following SQL query:
| Code Block | ||
|---|---|---|
| ||
SELECT 'Resolved', SUM (TT2.'Count') AS 'Count' FROM T1 AS TT1 JOIN T1 AS TT2 on TT1.'Resolved' >= TT2.'Resolved' GROUP BY TT1.'Resolved' ORDER BY TT1.'Resolved' |
| Handy Carousel |
|---|
|
Step 3. Wrap Table1 and Table2 in the Chart from Table macro.
Chart from Table:
| Type | Time Area |
|---|---|
| Dates Column | Created, Resolved |
| Values Column | Count |