...
| Excerpt | ||
|---|---|---|
| ||
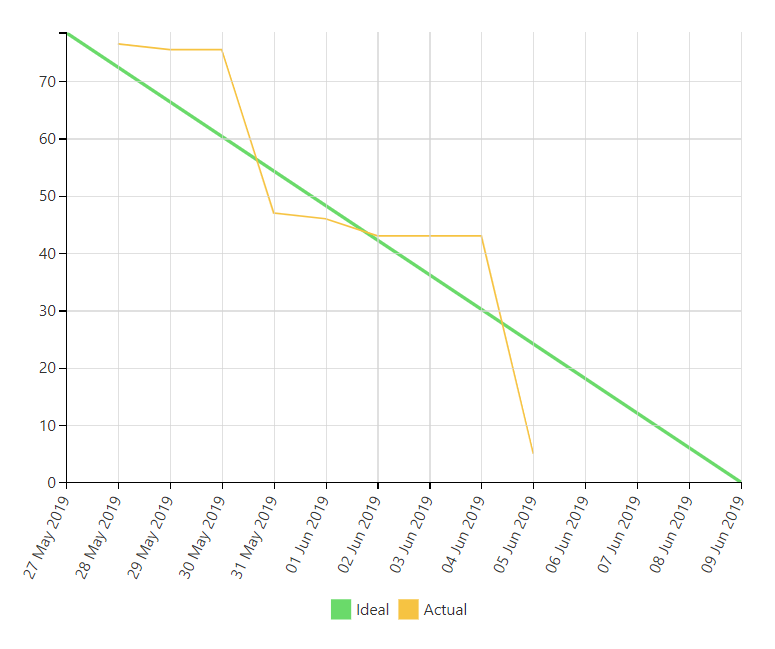
Building a Burndown Chart
|
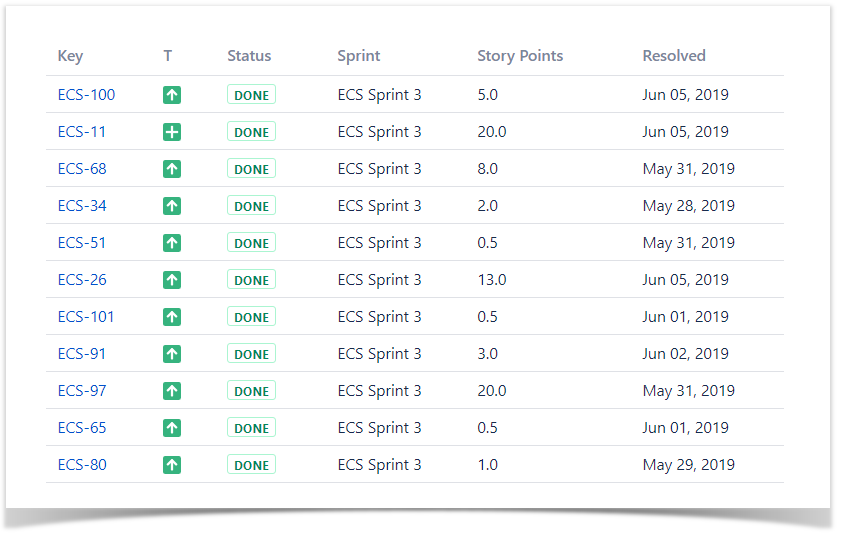
The Source Table:
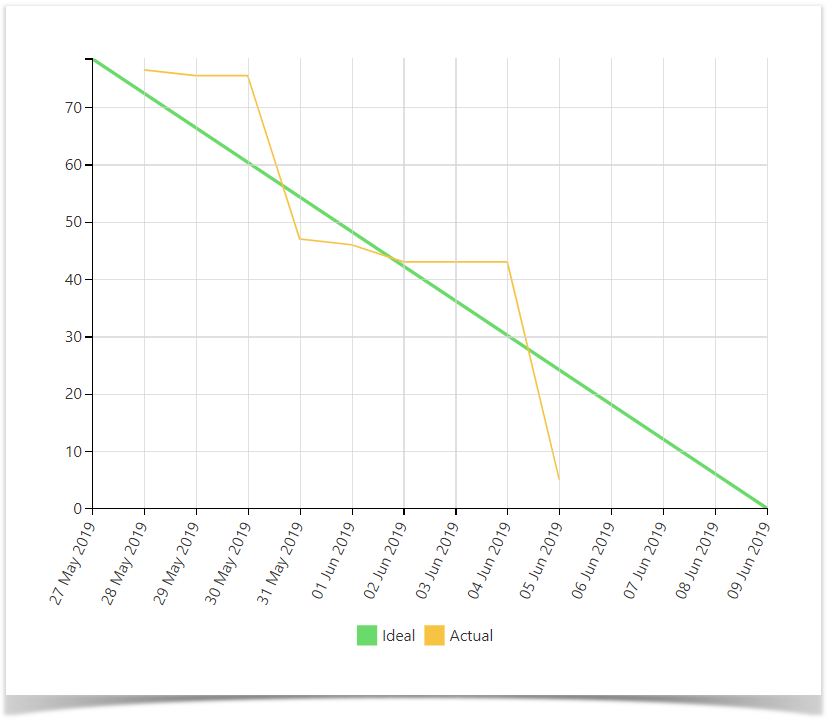
The Result:
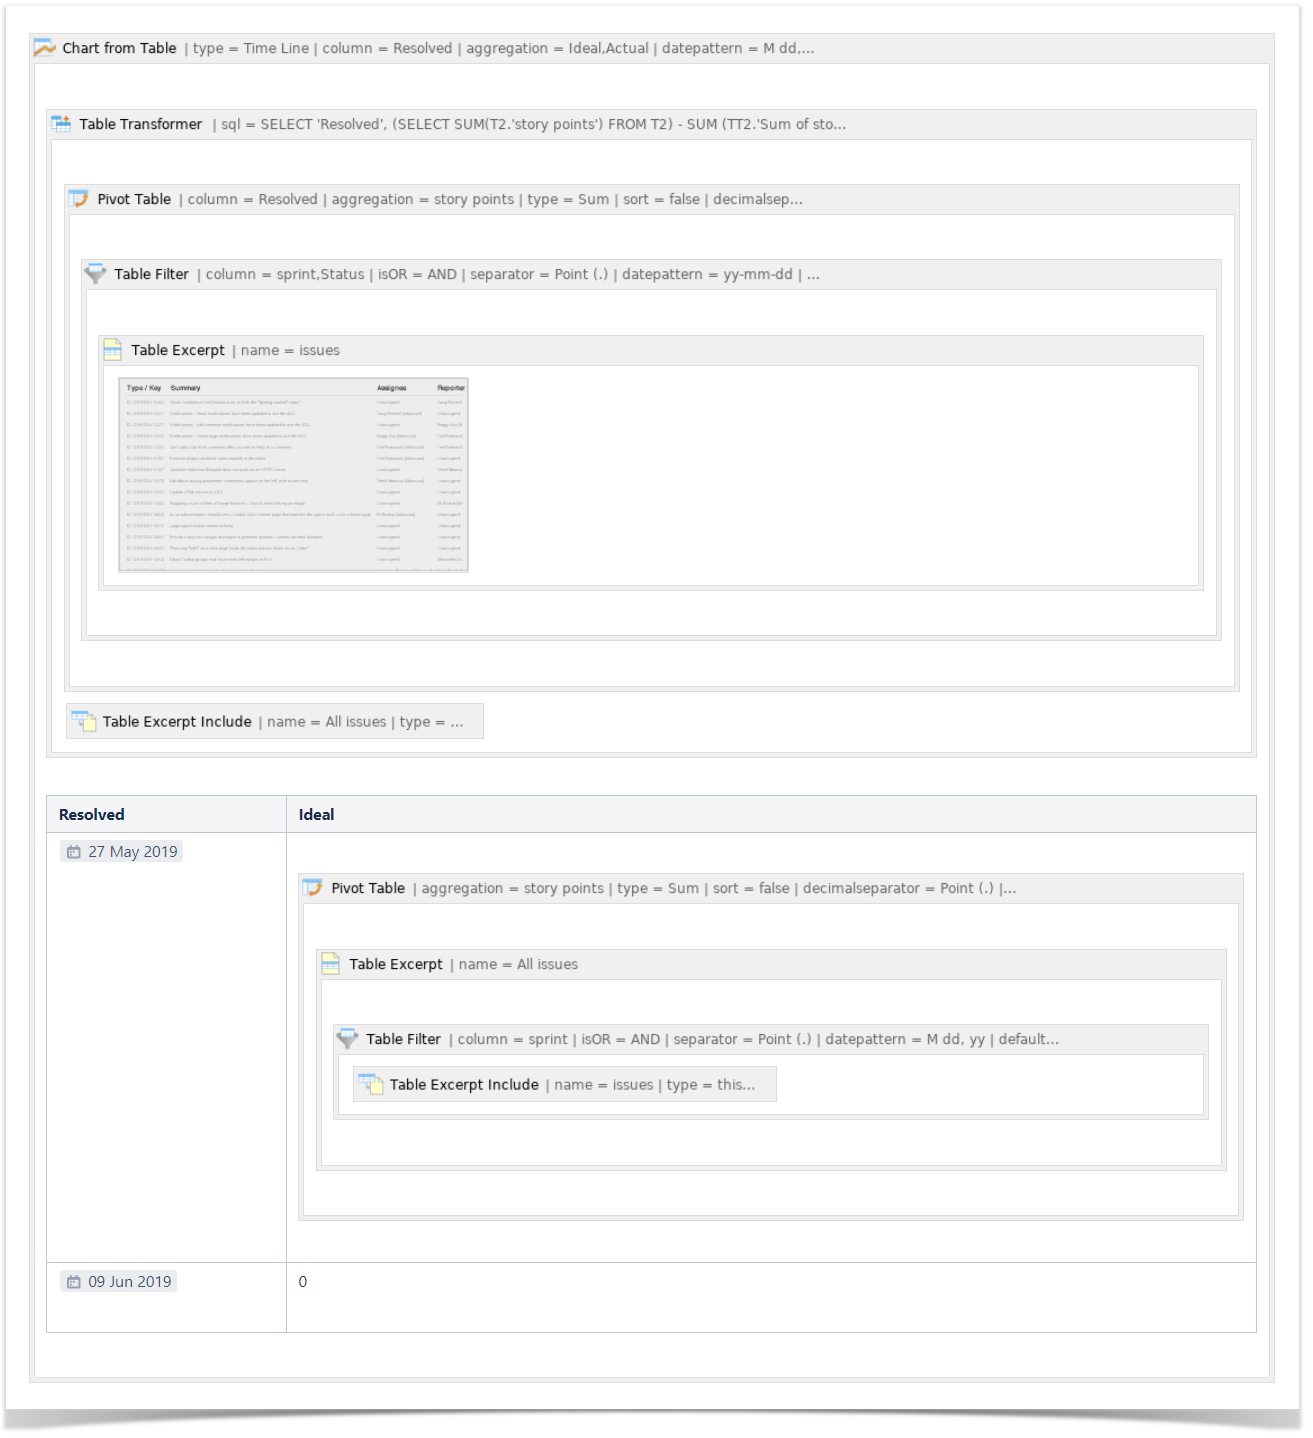
Macro combination (the chart is based on two transformed pivot tables):
Step 1. Configure Table1:
- Insert the Jira Issues macro.
- Wrap the Jira Issues macro in the Table Filter macro.
- Wrap the Table Filter macro in the Pivot Table macro.
- Insert the Jira issues macro with all the issues from the particular sprint (or use the Table Excerpt and Table Excerpt Include macros to reuse the filtered Jira Issues macro from Table2).
- Wrap the Pivot Table macro and the Jira Issues macro in the Table Transformer macro.
Step 2. Configure Table2:
- Insert the Jira Issues macro (or use one Jira issues macro for both tables with the help of the Table Excerpt and Table Excerpt Include macros).
- Wrap the Jira Issues macro in the Table Filter macro.
- Wrap the Table Filter macro in the Table Excerpt macro to reuse this table in Table1.
- Wrap the Table Filter macro in the Pivot Table macro.
- Place the Pivot Table macro in a cell of a manually created table containing start and end dates of a sprint.
Step 3. Wrap Table1 and Table2 in the Chart from Table macro.
Macro configuration:
Step 1. Configure Table1:
Table Filter:
| Filter Column | Status | Sprint |
|---|---|---|
| Filter Type | Dropdown | Dropdown |
| Filter Values | Done | ECS Sprint 3 |
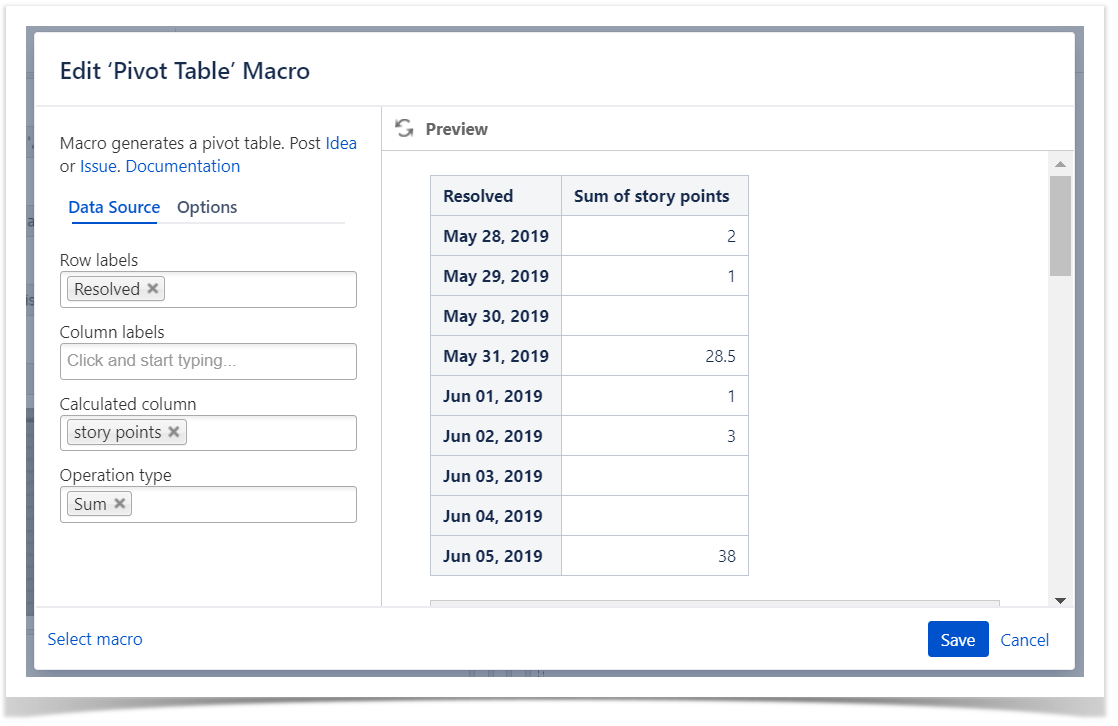
Pivot Table:
| Row Labels | Resolved |
|---|---|
| Column Labels | - |
| Calculated Column | Story points |
| Operation Type | Sum |
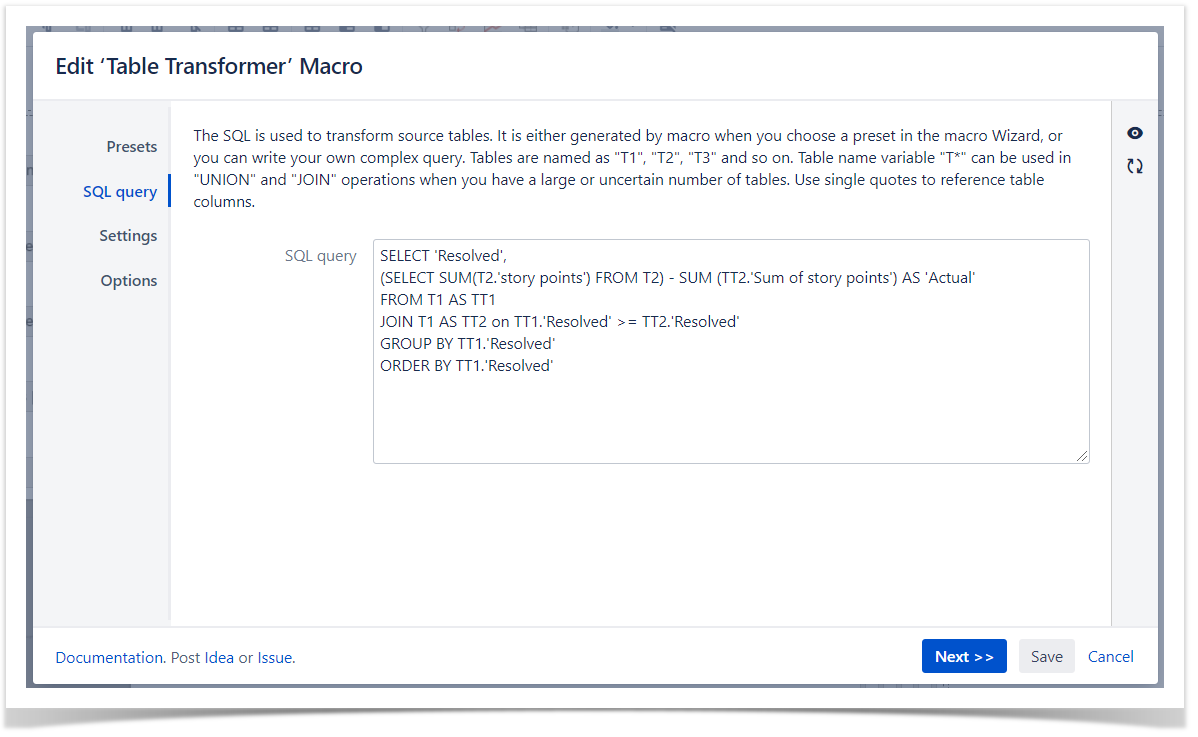
Table Transformer:
Use the following SQL query:
| Code Block | ||
|---|---|---|
| ||
SELECT 'Resolved', (SELECT SUM(T2.'story points') FROM T2) - SUM (TT2.'Sum of story points') AS 'Actual' FROM T1 AS TT1 JOIN T1 AS TT2 on TT1.'Resolved' >= TT2.'Resolved' GROUP BY TT1.'Resolved' ORDER BY TT1.'Resolved' |
| Handy Carousel |
|---|
|
Step 2. Configure Table2:
Table Filter:
| Filter Column | Sprint |
|---|---|
| Filter Type | Dropdown |
| Filter Values | ECS Sprint 3 |
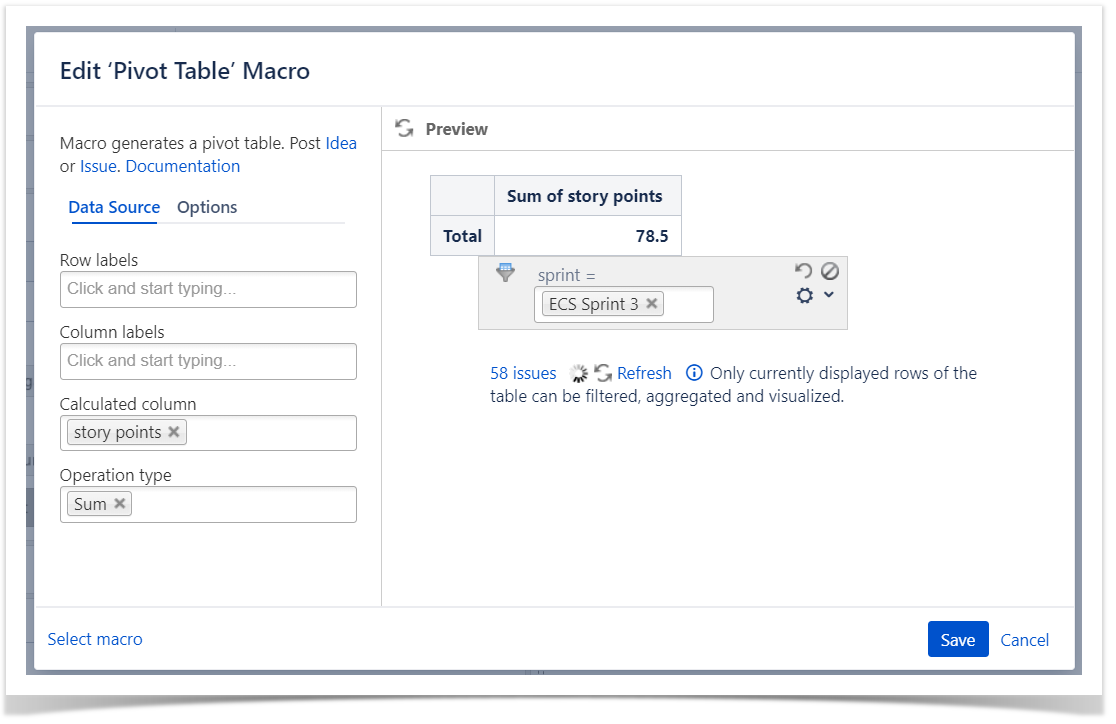
Pivot Table:
| Row Labels | - |
|---|---|
| Column Labels | - |
| Calculated Column | Story points |
| Operation Type | Sum |
Step 3. Wrap Table1 and Table2 in the Chart from Table macro.
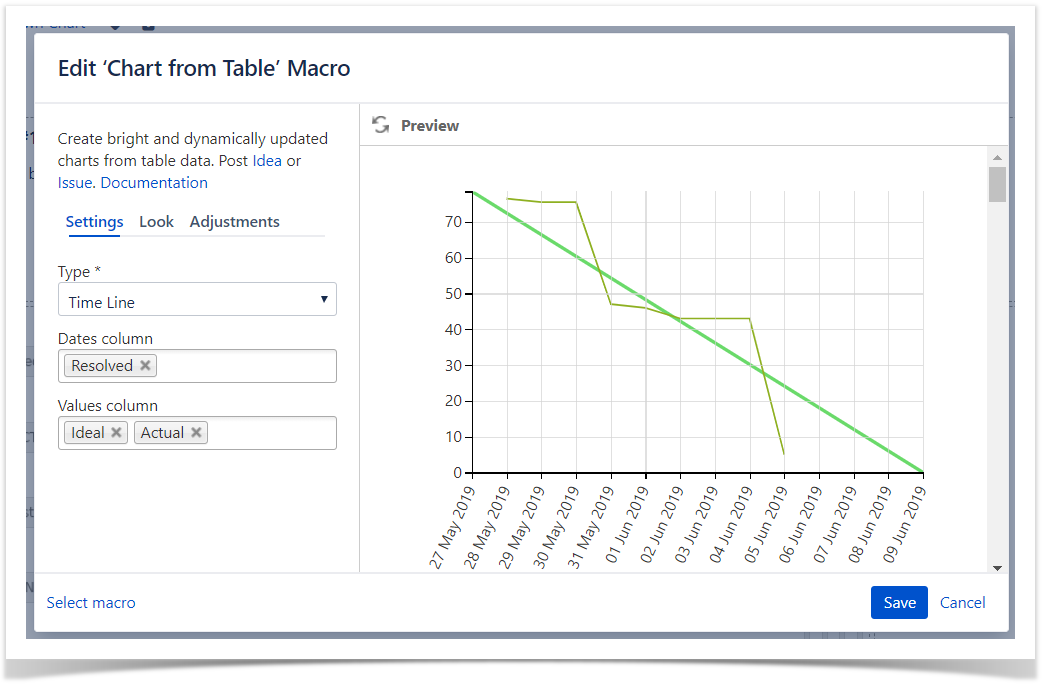
Chart from Table:
| Type | Time Line |
|---|---|
| Dates Column | Resolved |
| Values Column | Ideal, Actual |
| Excerpt Include | ||||||
|---|---|---|---|---|---|---|
|