| Info |
|---|
This feature is available only under a commercial or evaluation license. |
The Contributions graphs show you a single commiter performance over the last year. By contributions we understand the sum of:
| Talk | ||
|---|---|---|
|
- commits in all repos and branches made by a user,
- pull requests created by a user.
Viewing Your Personal Statistics
Unlike other Awesome Graphs stats, this graph is located right in the Stash user profile. To see your personal statistics, select My Activity from the menu in the upper-right corner of the Stash window.

Viewing Others' Statistics
To see other contributors' stats, click their names in the Contributors graph of any repository.
| Talk | ||
|---|---|---|
|

| Note | ||||||||
|---|---|---|---|---|---|---|---|---|
| ||||||||
Commiters who are not Stash users, don't have Stash profiles and there're no Contributions statistics for them. For a commit to be displayed by Awesome Graphs, the user's emails specified in Git and Stash account should match. If this is not the case, use the .mailmap feature provided in Git. Also, please, see this question in our FAQ.
|
Contributions Calendar
In a user profile you see the user's calendar. It comprises all days over the last year starting from the current date. Days when contributions were made are green. Days without contributions are grey.
| Talk | ||
|---|---|---|
|

Below the contributions calendar, you can see the total of all contributions and contributor's streaks, i.e. several days in a row when contributions were made.
You can hover a mouse over a day to see how many contributions were made on it.
| Talk | ||
|---|---|---|
|

To select the time period to show statistics for, do one of the following:
| Talk | ||
|---|---|---|
|
- to select one day, click its square in the calendar.
- to select a range of days, click the first day and drag to the last day of the range
- to select predefined values, choose a value from the drop-down menu below the user calendar

Contribution Activity
In the Contribution activity section, all user's commits and pull requests are shown as an activity stream.
| Talk | ||
|---|---|---|
|

| Talk | ||
|---|---|---|
|
If a contribution is connected to a JIRA issue, you can click the link to the issue to see the issue details and modify them.
free for first 50 commits. To get Commit Graphs for more than 50 commits, a commercial license is required. |
To view Commit Graph of the current repository, navigate to the Commits section on the sidebar. Commit Graph appears to the left of the 'Author' column.
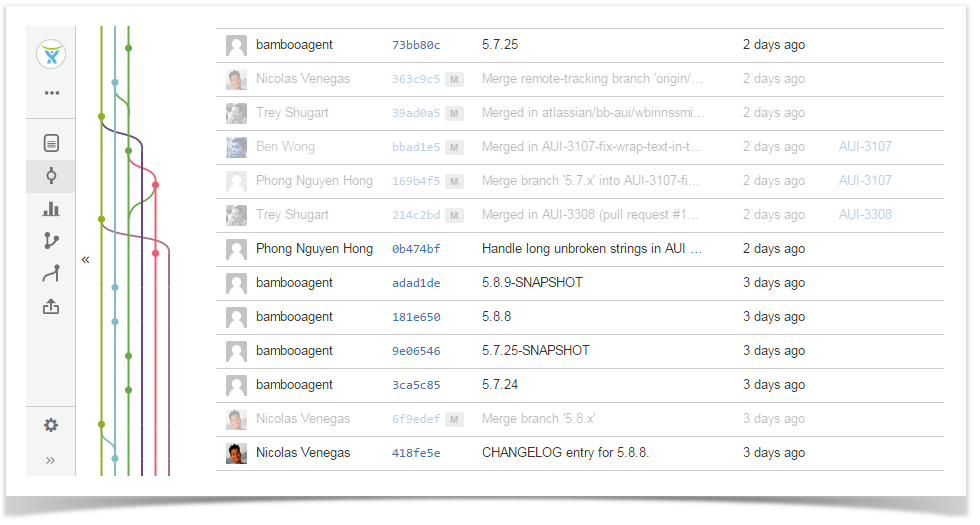
Use it to:
- visualize development flows (branches, merges, commits) of your Git repositories;
- see the merge history and the relationships between commits;
- make sense of your branches history.
Highlighting Ancestors of a Changeset
By default, all changesets are highlighted. You can click a point to highlight the ancestors of a certain changeset and see where it comes from.
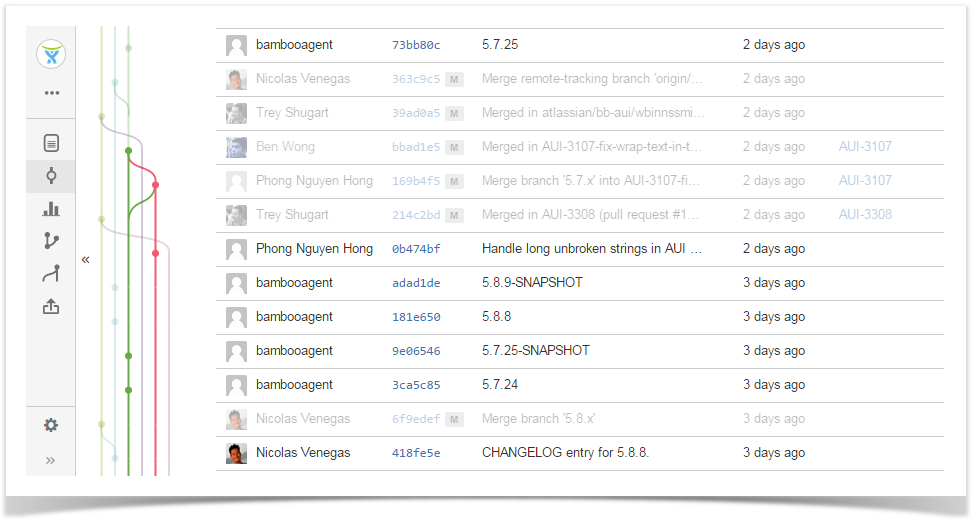
To have all changesets highlighted again, click the graph anywhere outside the points.
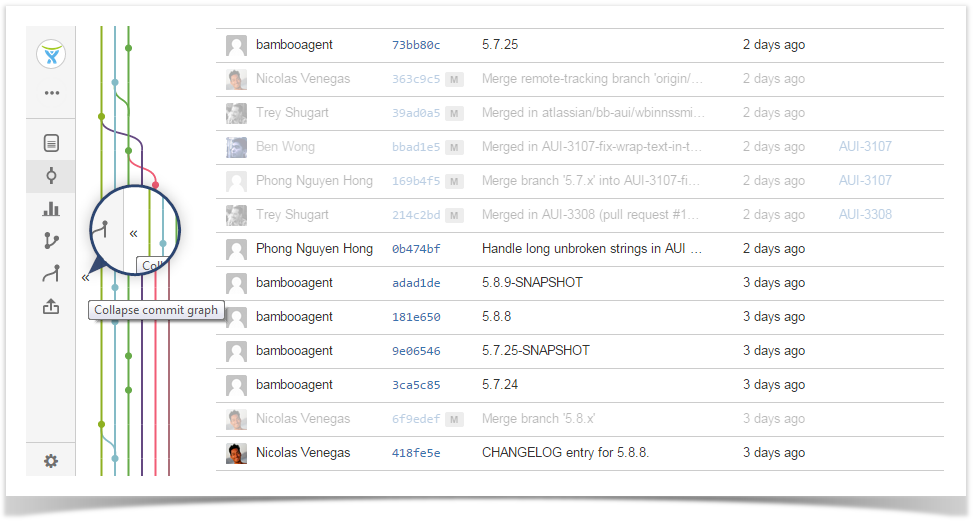
Collapsing and Expanding Commit Graph
It's possible to collapse and expand Commit Graph: just click the  button to the left of Commit Graph to hide it or
  to expand and view it again.
If you have any feedback or requests concerning this feature, please, let us know
...
.