New in this release
Added a capability to revert filters for all filter types.
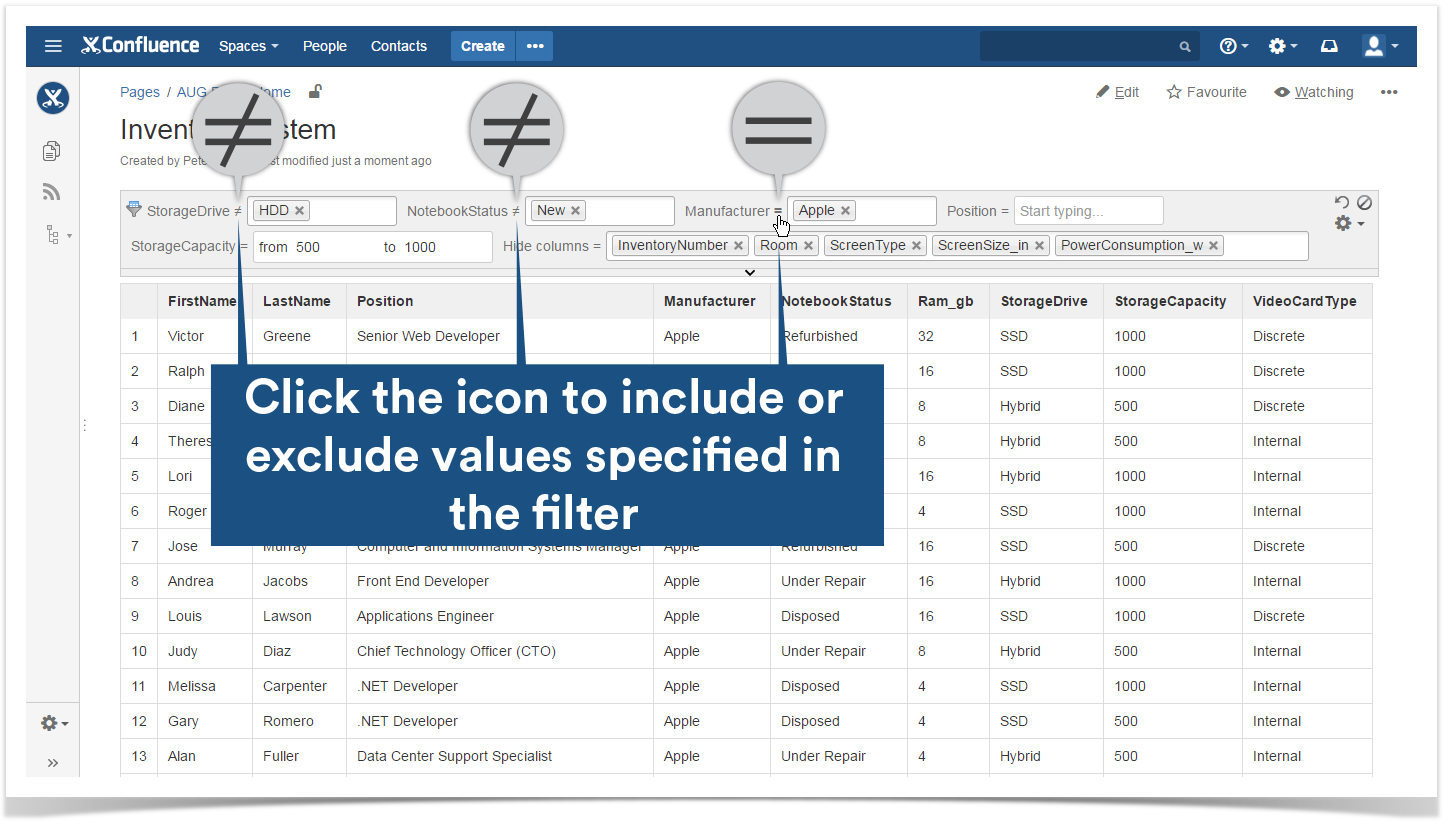
Now you can either exclude or include specific values during data filtration.
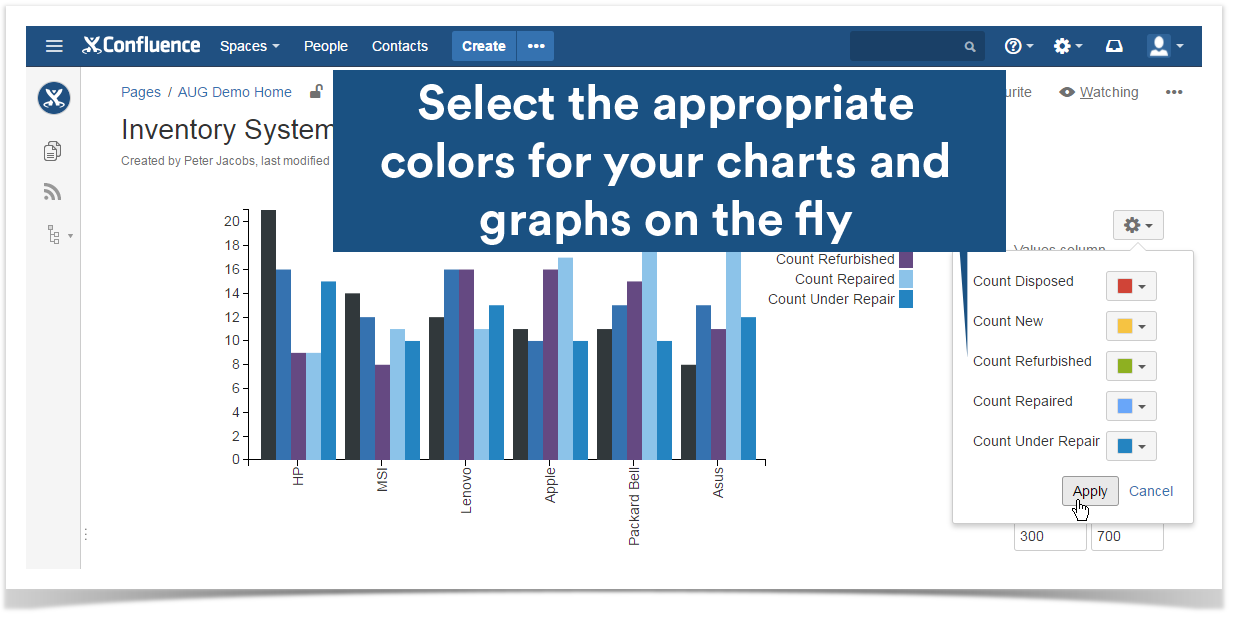
Added a capability to select colors for charts and graphs.
Now you can quickly and easily pick the appropriate color for your charts and graphs for better data perception.
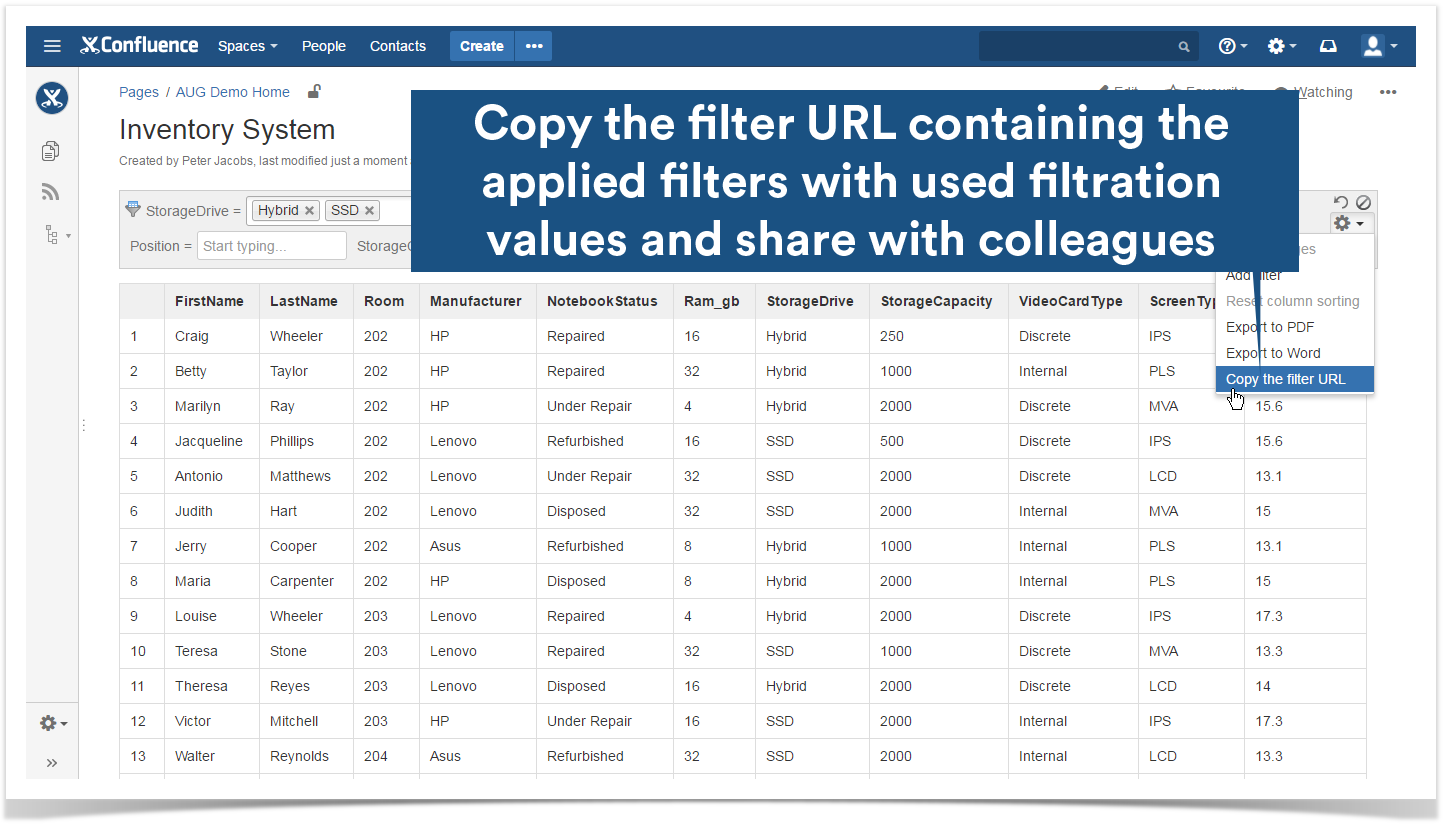
Added a capability to share links to specific filtration results.
Now you can copy the URL which will lead to the page with the necessary filtered results even when the filtration parameters were changed since then.
The new version of add-on also includes the following features:
- Added a capability to apply the logarithmic scale to the line and area charts.
- Added the mechanism determining the date format for the user depending on the used locale on his/her machine when using the default filter values.
- Added a capability to completely hide the table and show rows only during filtration.
Fixed in this release
- Resolved the issue with the incorrect sorting of the dd.mm.yy format when using the column sorting in the Table Filter macro.
- Resolved the issue with the disabled Disabled All Filters icon when using the Show First N Rows option.
- Resolved the issue with the incorrect positioning of the filtration pane when using the junction of the Chart from Table > Pivot Table > Table Filter macros.