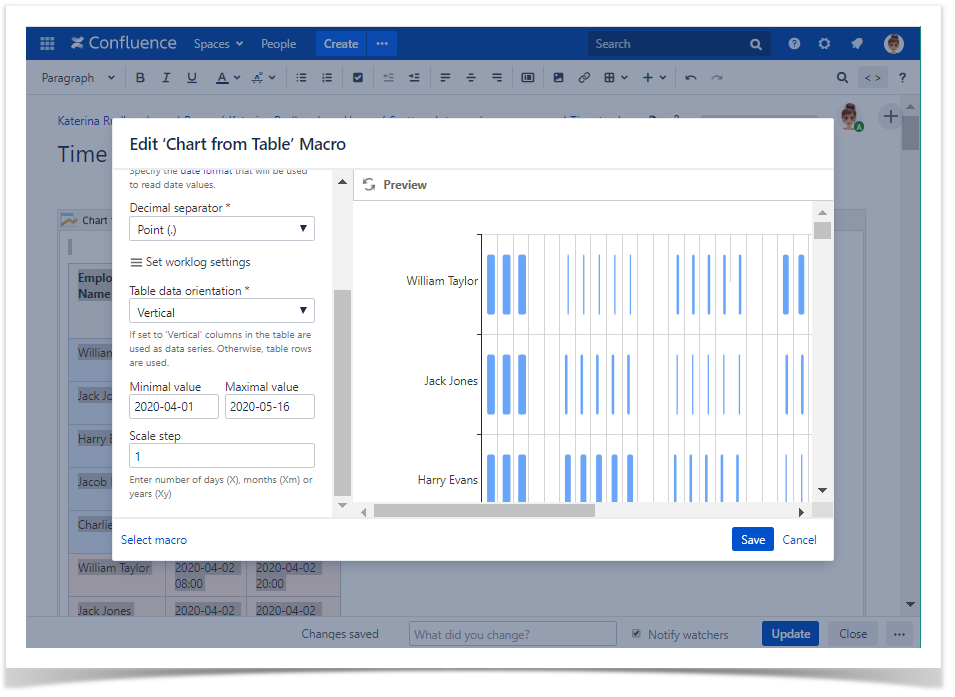
You can build a Contiguity or Barcode chart with the help of the Gantt chart type
Use Case:
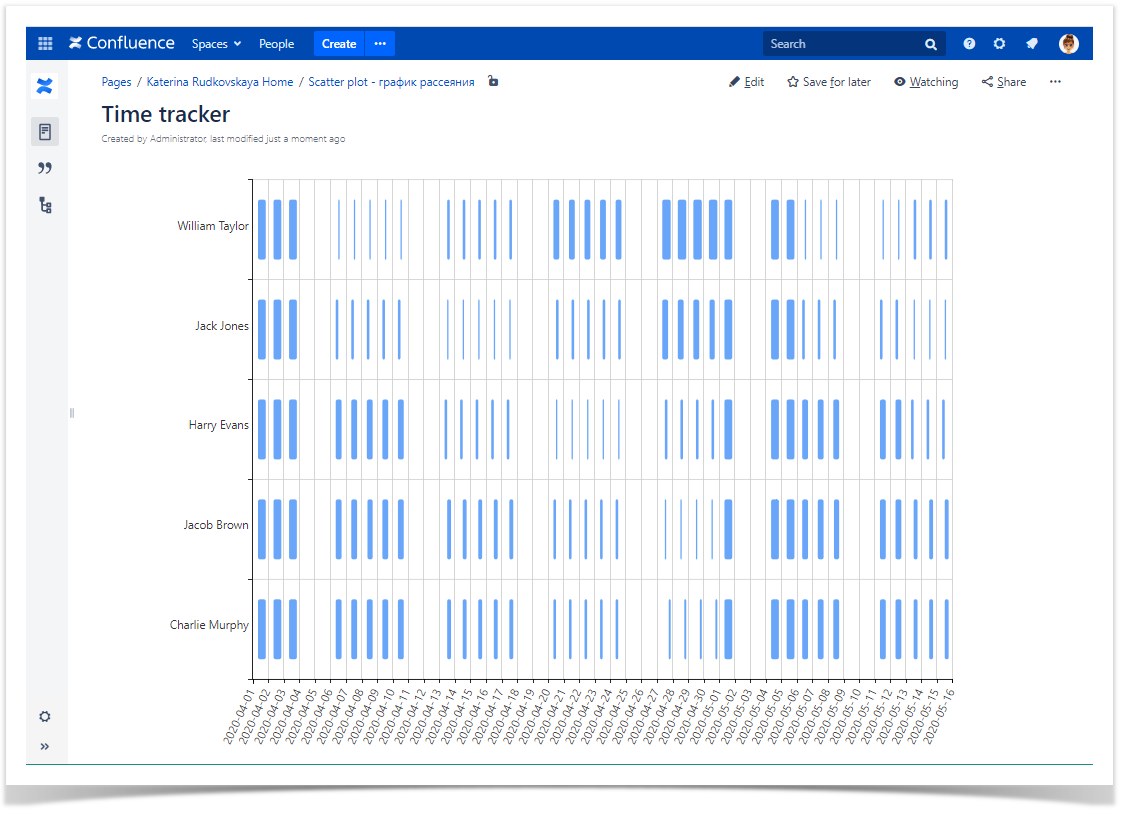
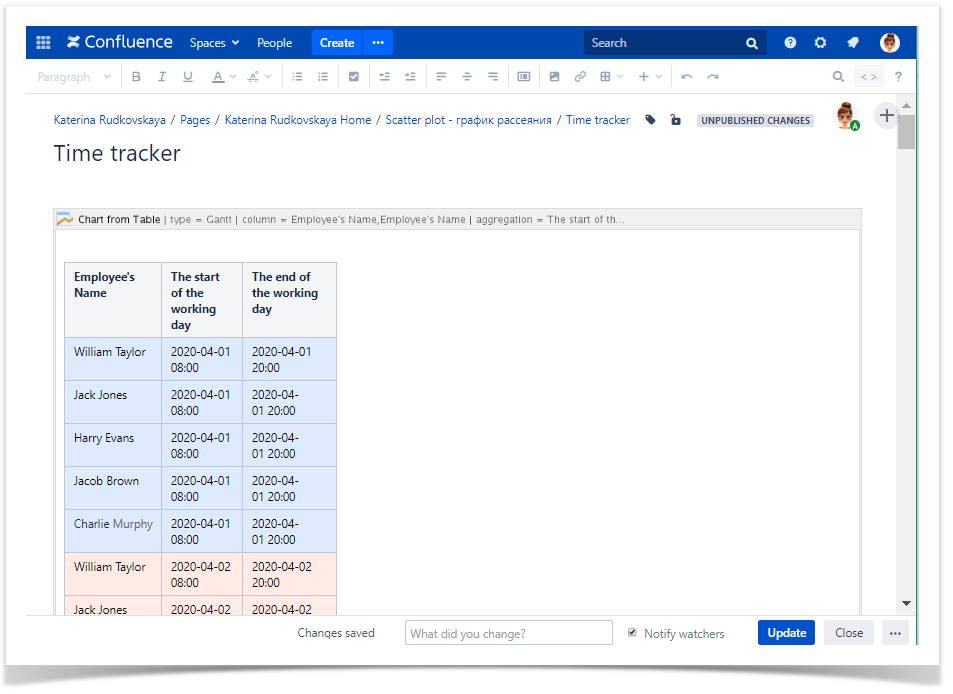
You have a table with columns containing names of employees, the start and the end of working hours for six weeks.
You are going to build a chart with time ranges of working hours shown according to an employee's name day by day.
Solution:
- Wrap the table with the Chart from Table macro.
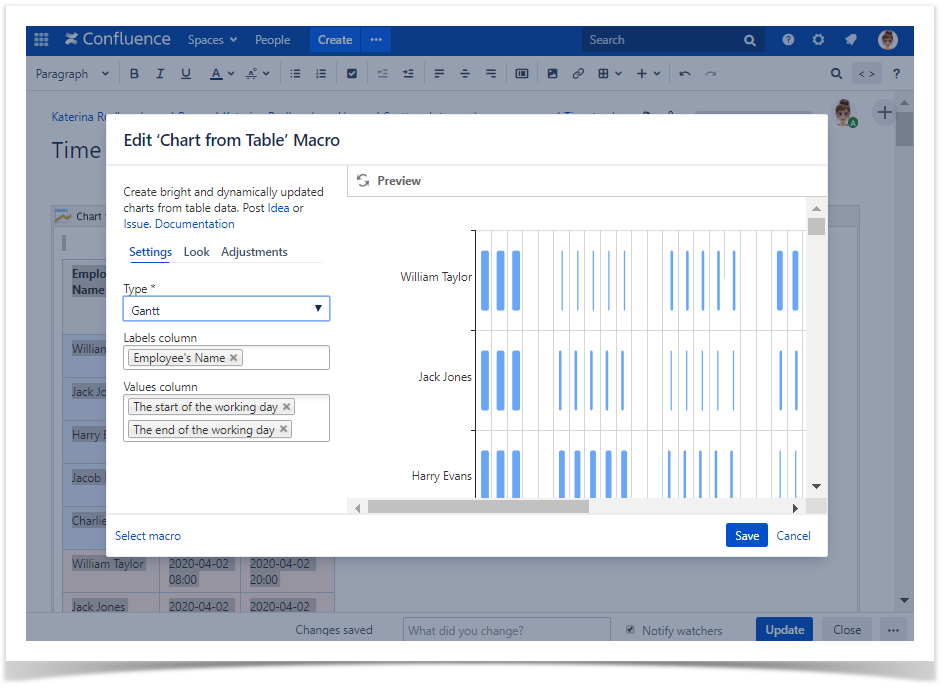
- Choose the Gantt Chart type.
- Set needed Labels, Values column(s) in the chart controls.
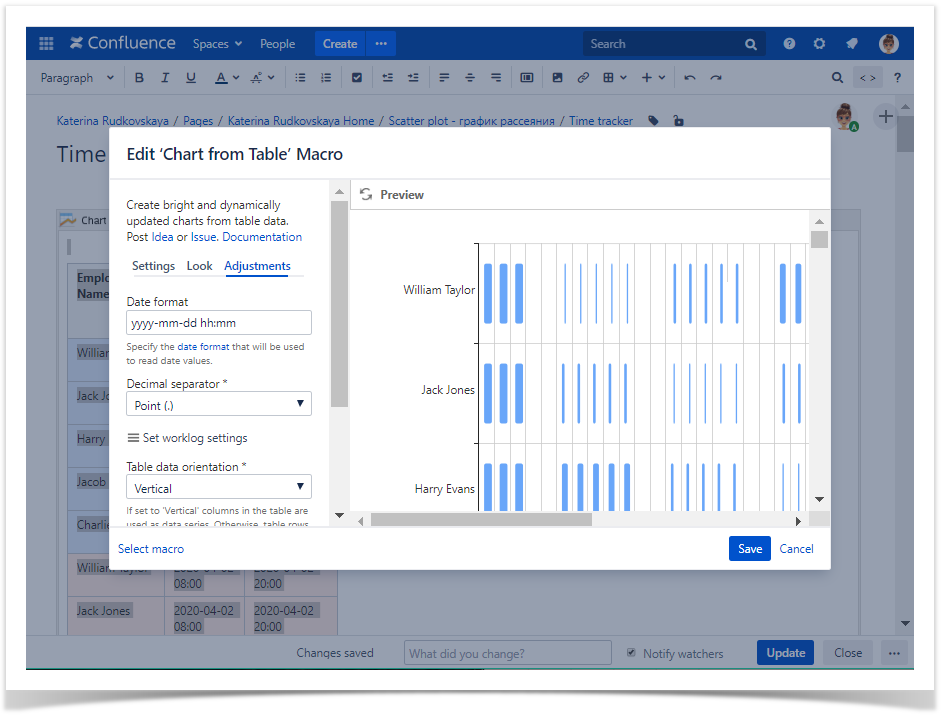
- Specify the correct Date format and other options if needed.
