New in this release
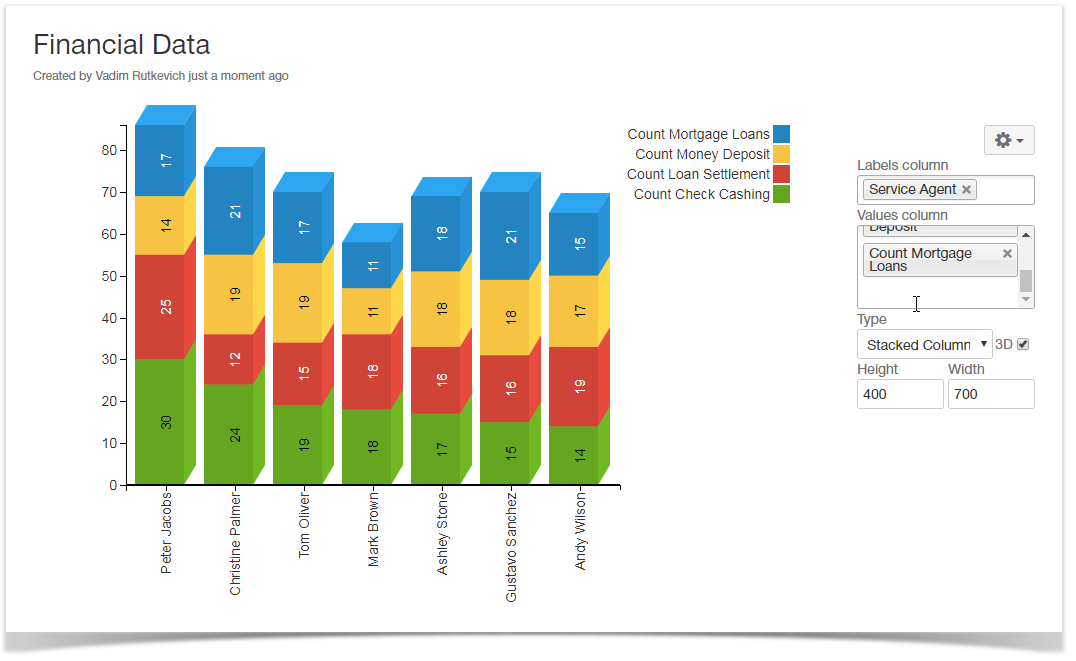
Added an option to build 3D pie, column and bar charts (including their stacked variants).
Now you can visualize your table data with new 3D charts.
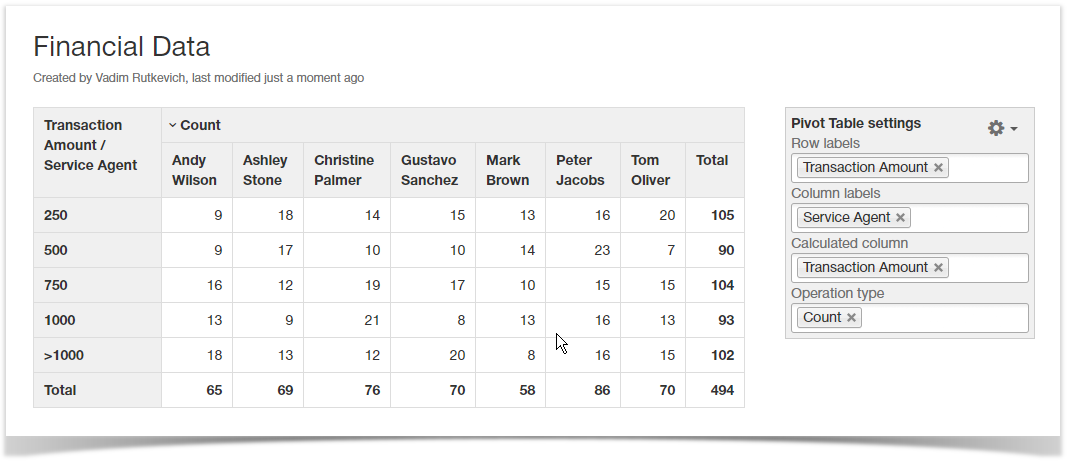
Added a capability to aggregate numerical data, worklogs and time periods against the specific value ranges.
Now you can instantly count entries within each pre-defined value range.
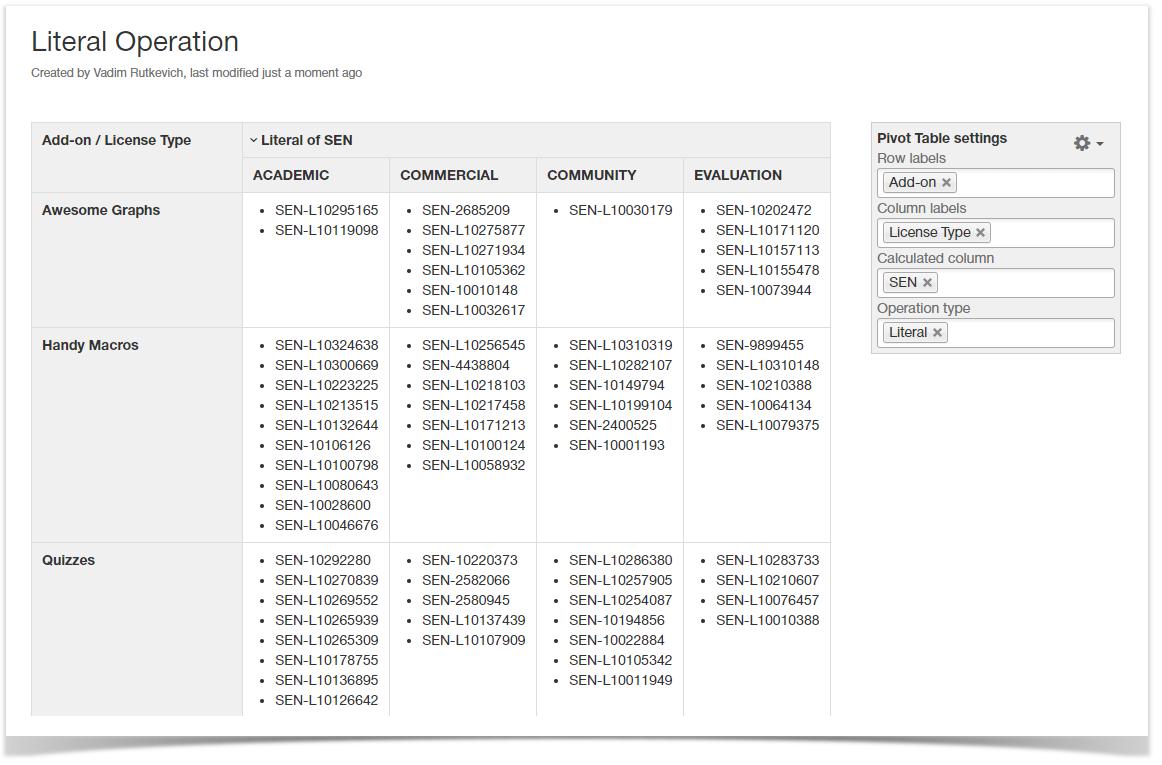
Added a new operation type 'Literal'.
Now you can find all the unique values within the defined range of values and aggregate them against the specific labels.
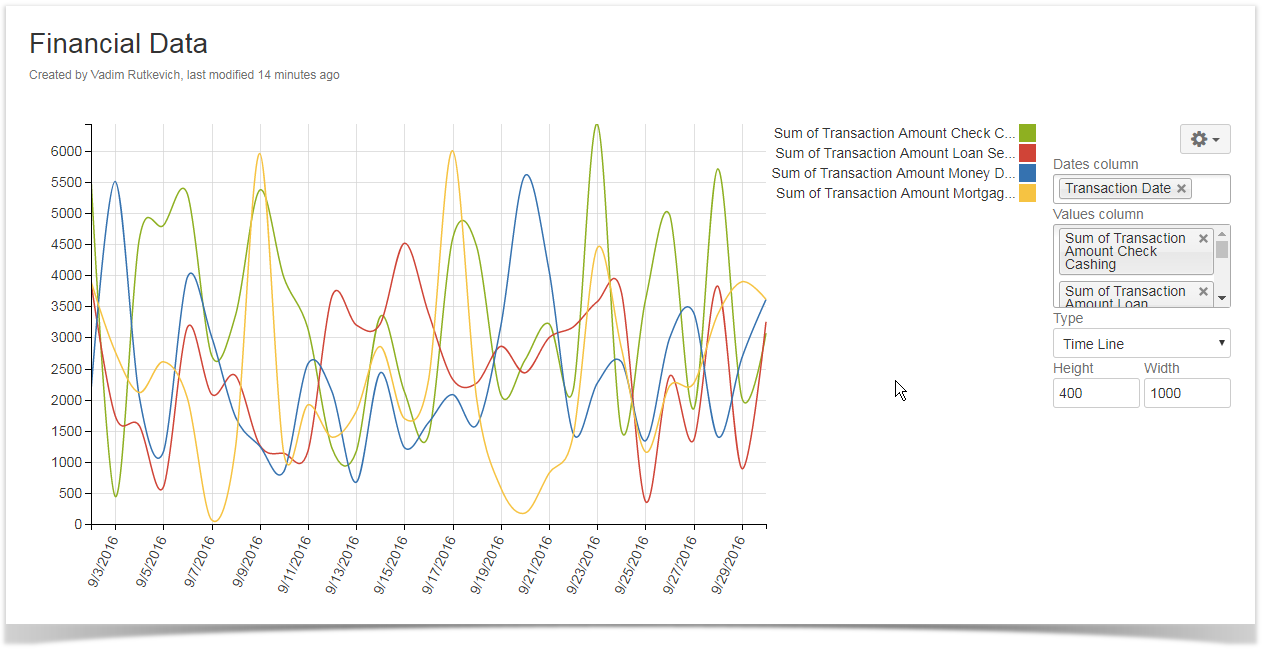
Added new interpolation methods for charts.
Now you can produce charts with smooth transitions between values on the chart.
The new version of add-on also includes the following features:
- Added a capability to display the task description in the Gantt chart.
- Added a capability to filter the table data placed within the Chart from Table macro with the consequence update of the chart after update of filtration criteria.
- Added a capability to set the date format for the Chart from Table macro in the page view mode.