StiltSoft is happy to announce the release of Awesome Graphs for Stash version x.x.x.
What's new
Branch Selection
Now, you can select a repository branch to plot graphs for.
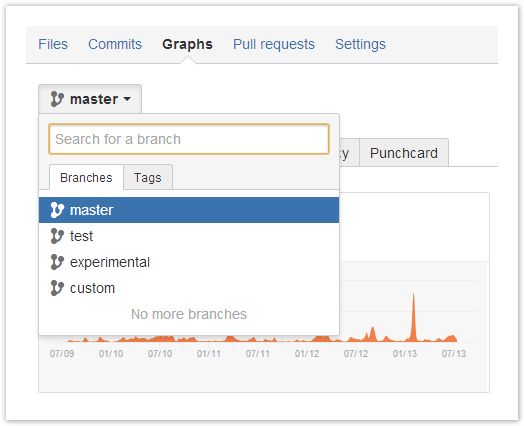
Choose any branch from the drop-down menu and Awesome Graphs will show you the analytics for it.
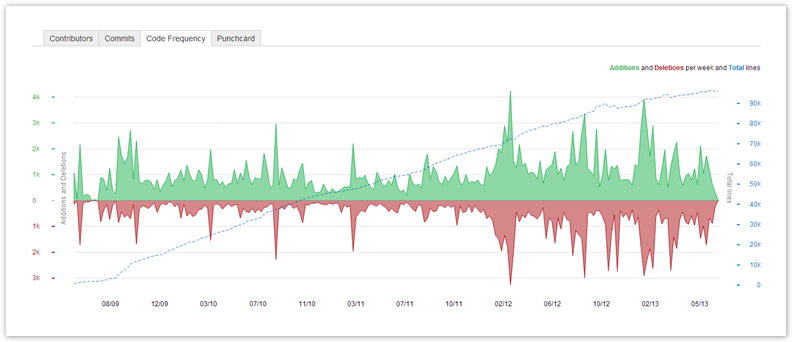
Code Frequency
This is a new graph that shows how many actual code lines were added and deleted over the lifetime of a project.