New in this release
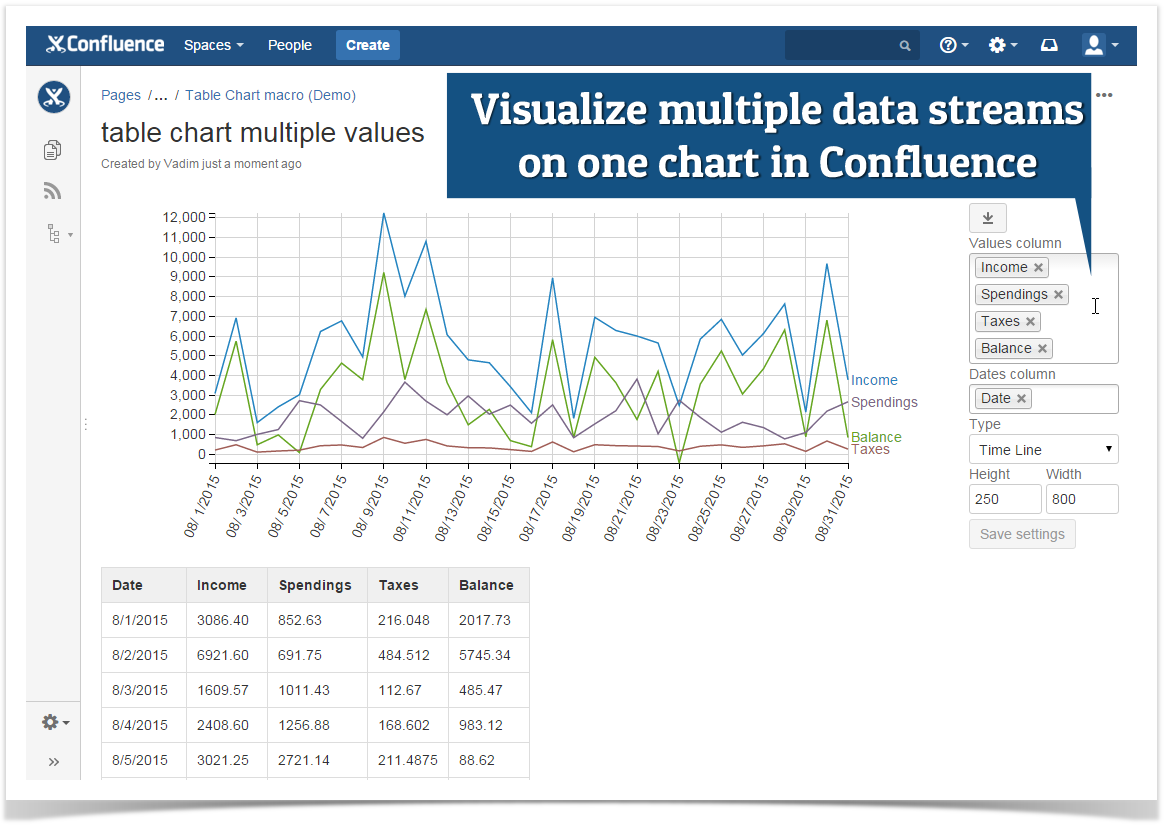
Added a capability to select multiple columns for chart generation.
Now you can select more than one column with numerical values for chart generation. So you can quickly and easily visualize all the necessary data flows and compare them on the one chart.
Added a capability to generate column and bar stacked charts.
Now you can easily get the overall picture of multiple data value types with stacked charts.

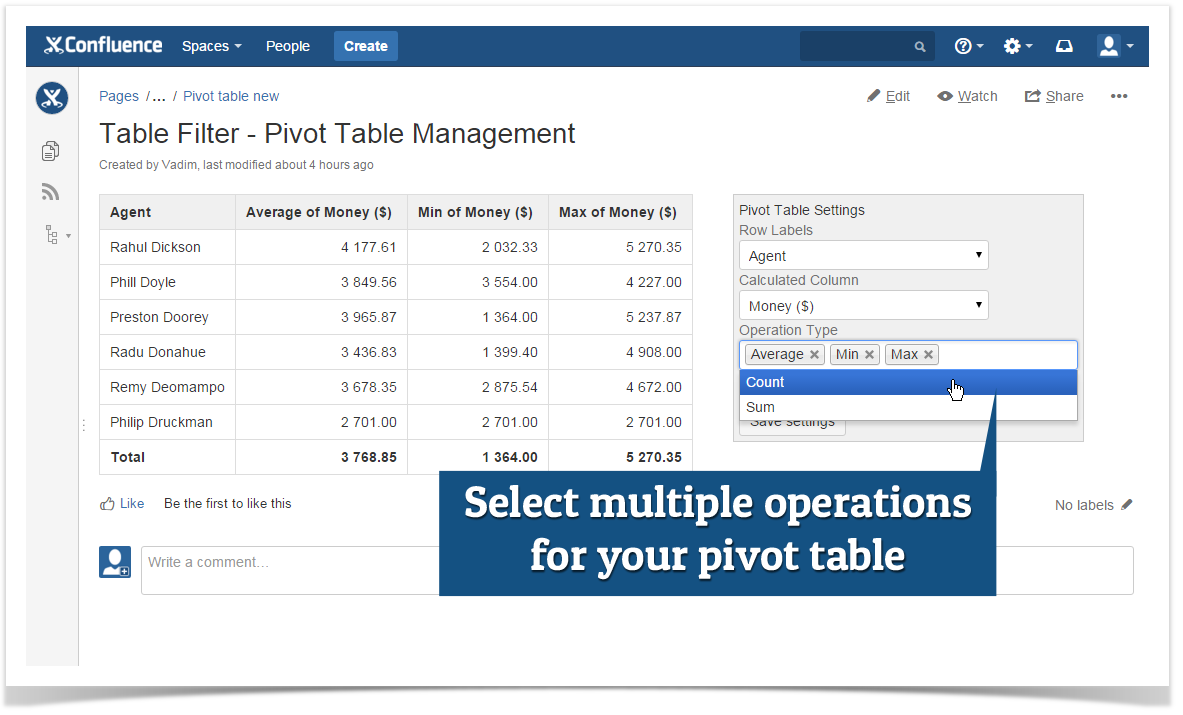
Added a capability to select multiple operations for pivot tables.
Now you can easily apply multiple operations to your aggregated data in Confluence.
The new version of add-on also includes the following features:
- Unified output of axis titles and optimized display of these titles depending on the allocated screen area.
- Added an option to show the source table for the pivot table.
- Added the highlighting of the data values on the pie chart when selecting a specific sector.
- Set the descending sorting order as default for pivot tables.
- Added automatic update of charts after sorting the table values.