Table Filter and Charts for Confluence add-on allows you to summarize your table data and produce its aggregated view in the form of a pivot table. You can select the column containing labels for summarization or aggregation and set the columns containing number values for calculation. Additionally, you can select the appropriate operation type (sum, count, minimal, maximal and average). While adjusting the macro parameters you can set the decimal and thousands separator, as well as specify the number of decimal places. You can modify settings of your pivot table and save modifications in the macro body while viewing the page. The Pivot Table macro also supports:
|
Starting from version 3.0.0 Table Filter add-on allows you to generate pivot tables from the data tables. A pivot table is such a kind of a table that allows you to get the summarized and aggregated data values from the master table.
The Pivot table macro allows you to perform the following operations:
- Count - counts the number of values pertaining to one label in the master table.
- Max - determines the maximal value per each label.
- Min - determines the minimal value per each label.
- Average - calculates the average values per each label.
- Sum - calculates the sum of values per each label.
Inserting Pivot table macro
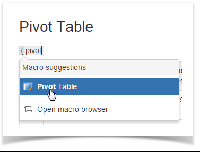
There exist three ways to insert the Pivot Table macro on the page.
| Macro Insertion | Instructions | Supported Data | |
|---|---|---|---|
| Inserting the macro through the action icon on the editor pane |
|
| |
| Manual entry of the {Pivot Table} query on the page |
|
| |
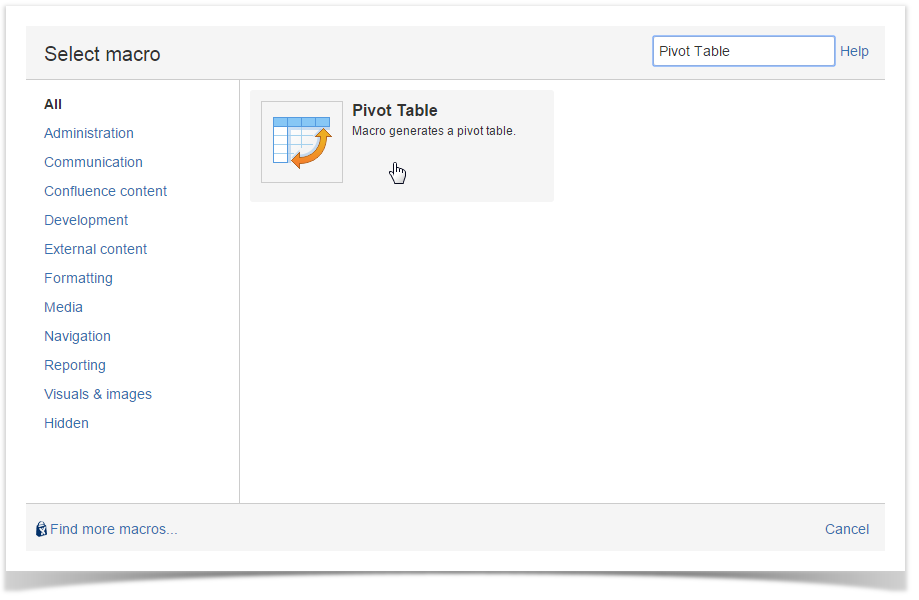
| Selection of the Pivot Table macro in the Select Macro form |
|
|
Before inserting the table into the Pivot Table macro ensure the following things:
|
Selecting Data Series
On the Confluence page opened in the edit mode, click the Pivot table macro.
Click Edit.
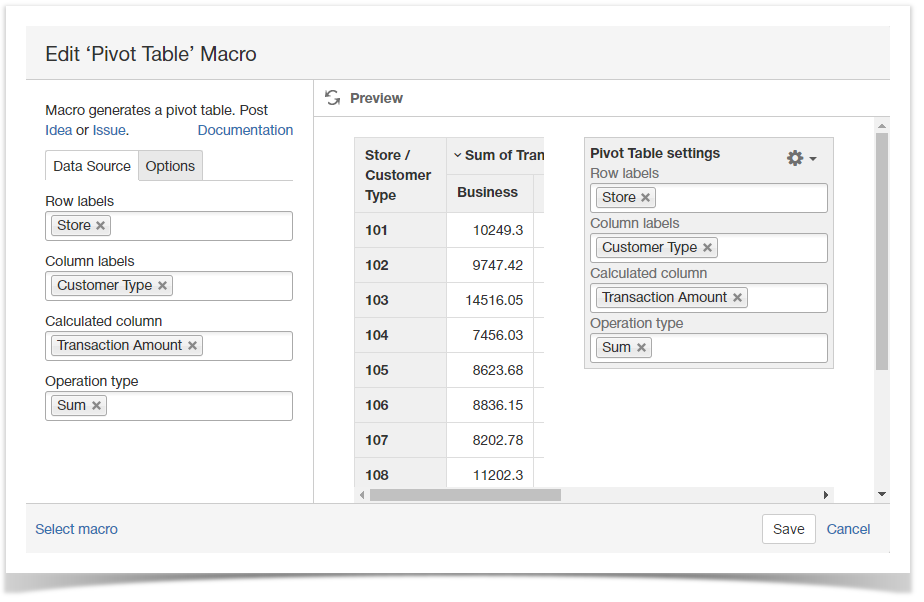
In the Edit Pivot table Macro form, define parameters of the macro, as follows:
- Row labels - select one or multiple table columns that will be positioned horizontally in the pivot table.
- Column labels - select one or multiple table columns that will be positioned vertically in the pivot table.
- Calculated Column - select one or multiple columns that will be calculated or aggregated according to the selected operation type.
- Operation Type - select one or multiple operations you want to perform on the calculated data in the pivot table. The following operations are available:
- Count - counts number of entries in the selected column.
- Sum - sums the number values in the selected column.
- Average - counts the average values over the values in the selected column.
- Min - finds the minimal value in the selected column.
- Max - finds the maximal value in the selected column.
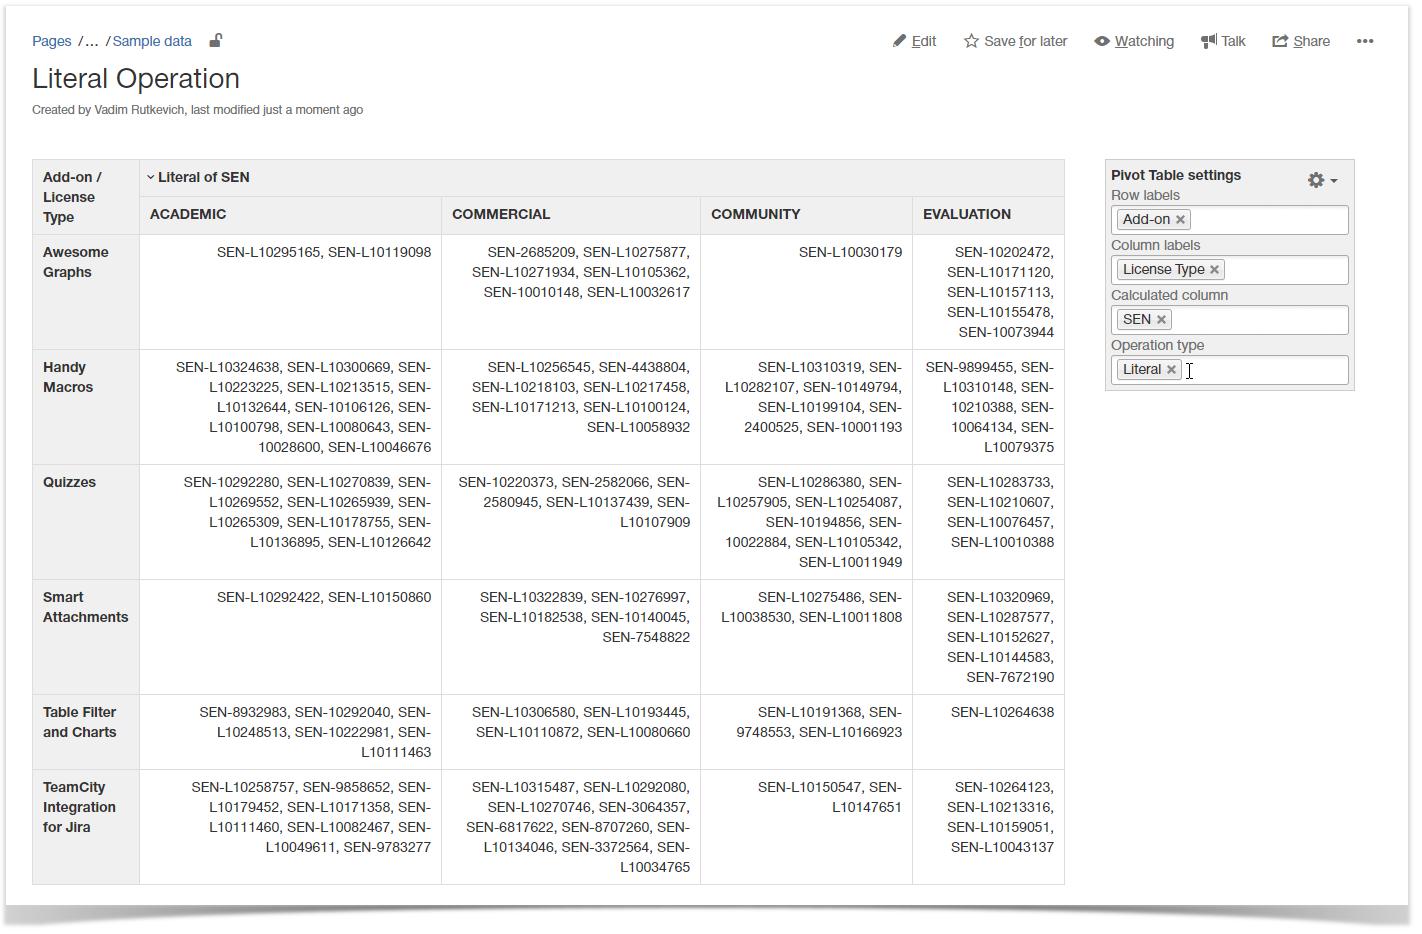
- Literal - outputs the list of unique values matching the selected criteria.
- Click Save.
- Save the page.
Creation of multidimensional pivot tables is available since Table Filter and Charts 3.8.0. |
Configuring parameters of the macro
On the Confluence page opened in the edit mode, click the Pivot table macro.
Click Edit.
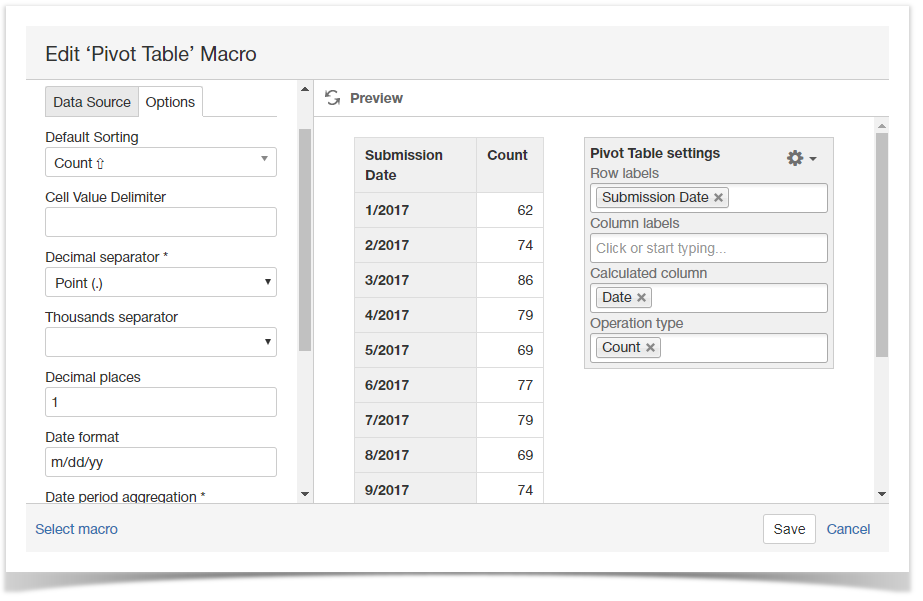
- Switch to the Options tab and adjust the parameters of the pivot table, as follows:
- Default Sorting - select the appropriate sorting order for the columns of your pivot table.
- Cell Value Delimiter - specify the correct cell value delimiter used in the cells of the source table (if applicable).
- Decimal separator - select the appropriate decimal separator used in numerical values of the source table.
- Thousands separator - select the thousands separator for improving look of numerical values.
- Decimal places - enter the number of decimal places to show in the pivot table.
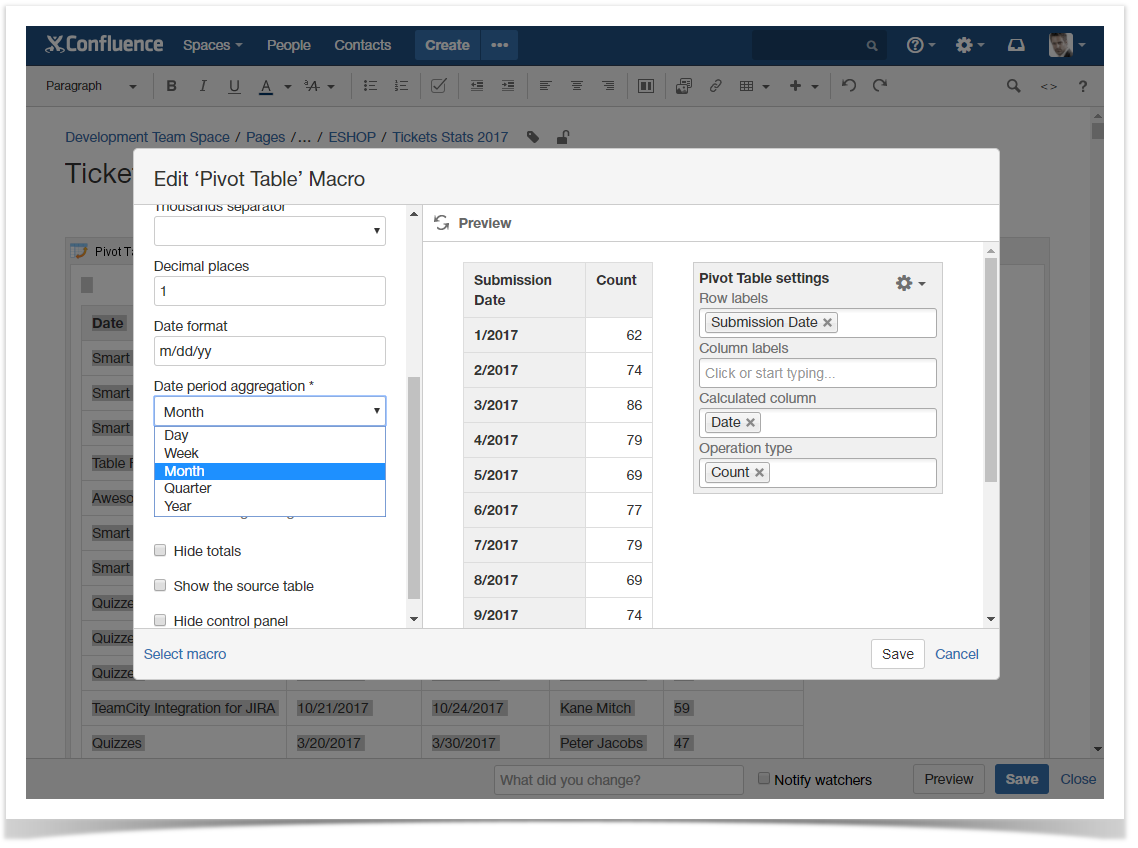
- Date format - specify the correct date format so the macro can properly treat the dates during aggregation.
- Date period aggregation - select the appropriate time period for data aggregation, as follows:
- Day
- Week
- Month
- Quarter
- Year
- Number range aggregation - define the range of numbers against which numeric values will be aggregated. The range for aggregation can be specified in the following formats:
- Inclusive: [100;250;500]
- Exclusive:
- [100;250;500] - включает границы, т.е. до 100 включительно, более 100 и до 250 включительно и т.д.
- (100;250;500) - исключает границы, т.е. менее 100, от 100 вкл до 250 искл и т.д.
- Show data labels as - select the appropriate view to display data values, as follows:
- Number
- Percentage
- Number (Percentage)
- Percentage (Number)
- Set worklog settings - click the button to define the following parameters:
- Days in week - define the number of business days in one week.
- Hours in day - define the number of business hours in one day.
- Time format - select the appropriate worklog time format (where 'm' stands for minute, 'h' for hours, 'd' for day, and 'w' for week).
- Days in week - define the number of business days in one week.
- Hide totals - select this option to hide the columns and rows showing total values in the pivot table.
- Show the source table - select this option to show the source table under the pivot table.
- Hide control panel - select this option to hide the control panel in the page view mode.
- Click Save.
Please consider the following while configuring parameters of the Pivot Table macro:
|
From 3.8.2 version, the Pivot Table macro supports icons for summarization and aggregation. You can use this feature when working with the JIRA Issues macro, |
Using the Pivot table
Once you have defined settings of the Pivot table macro and saved the page, you get a pivot table with summarized data.
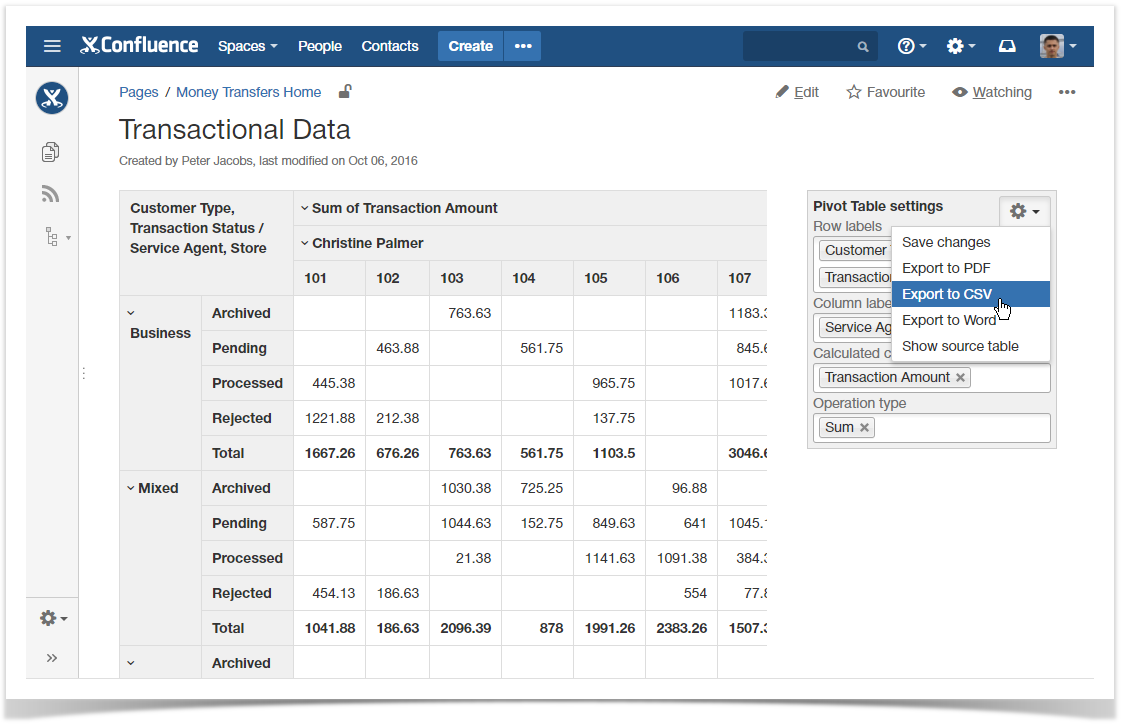
The generated pivot table may be compromised of two or more columns. The number of columns in the final pivot table depends mainly on the number of columns selected in the row and column labels, and calculated columns.
You can quickly update the data series used for calculation as well as update sets of columns selected in row and column labels.
If you deal with the multidimensional pivot tables, you can collapse specific horizontal and vertical levels of the pivot table by clicking the collapse  icon. To expand the collapsed level of the table, click
  icon. Starting from 3.10.0, the add-on preserves the collapsed/expanded state for each level of a pivot table after your manipulations on its data.
The Total row shows the calculated value throughout the pivot table and for specific levels of the pivot table.
To update the data series for summarization or aggregation:
- To the right side of your pivot table, locate the Pivot Table control panel.
- Update one or multiple parameters, as follows:
- Row labels - update the set of table columns that will be positioned horizontally in the pivot table.
- Column labels - update the set of table columns that will be positioned vertically in the pivot table.
- Calculated Column - select one or multiple columns that will be calculated or aggregated according to the selected operation type.
- Operation Type - select one or multiple operations you want to perform on the calculated data in the pivot table.
To save new parameters in the macro body:
- Click the Cogwheel
 icon.
icon. - Select Save settings.
To export the pivot table to PDF or Word:
- Click the Cogwheel
 icon.
icon. - Select Export to PDF or Export to Word correspondingly.
To export the pivot table to CSV:
- Click the Cogwheel
 icon.
icon. - Select Save changes.
For the details on CSV export, please see this page.
To show the source table:
- Click the Cogwheel
 icon.
icon. - Select Show source table.
To save changes in the pivot table:
- Click the Cogwheel
 icon.
icon. - Select Save changes.
Generating a Pivot Table on Worklogs or Time Intervals
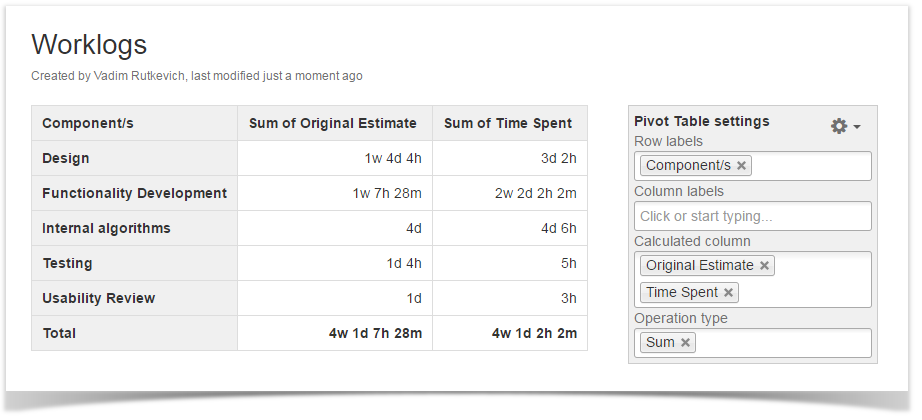
Starting from 3.9.0 version, the Pivot Table macro supports summarization of worklogs and time intervals.
- Insert the Pivot Table macro on the page.
- Place the table with time intervals or the JIRA issue macro with worklogs into the Pivot Table macro.
- Save the page.
- Define parameters of the Pivot Table macro on the control panel:
- Row Labels - select the appropriate table column for aggregation.
- Calculated Column - select the column with worklogs or time intervals for calculation.
- Operation Type - select the required operation types for execution on worklogs or time intervals.
- Save the changes.

Generating a Pivot Table on Delimited Values in Table Cells
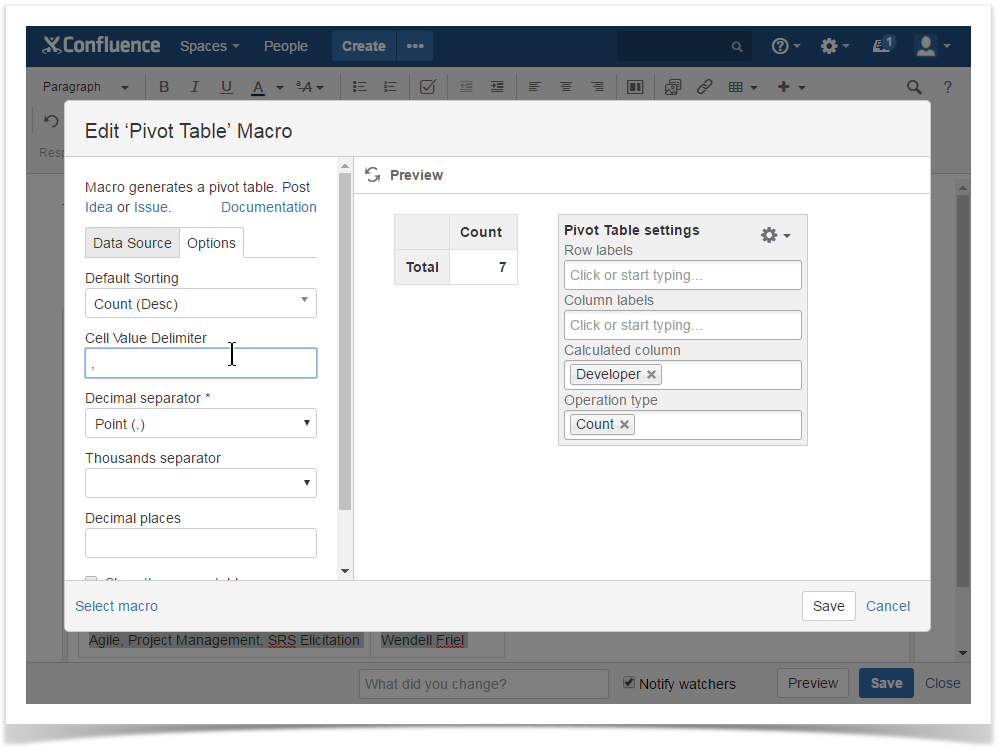
- Open the table with multiple values in each table cell.
- Place the table into the Pivot Table macro.
- Select the Pivot Table macro and click Edit.
- Switch to the Options tab.
- Locate the Cell Value Delimiter box and enter the delimiter used to separate multiple data values in cells.
- Save the macro and the page.
- Define parameters of the Pivot Table macro on the control panel:
- Row Labels - select the table column with cells containing multiple delimited values.
- Calculated Column - select the column for calculation.
- Operation Type - select the Count operation type.
- Save the changes.

Aggregating Data against Time Periods
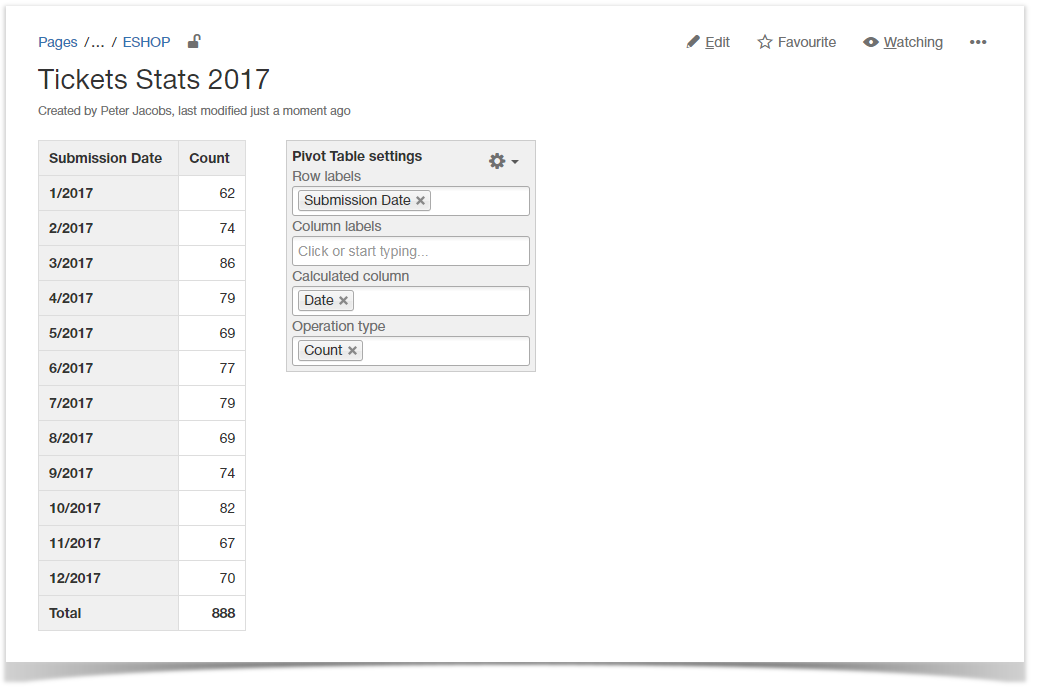
When you deal with specific dates, sometimes you may need to aggregate this data against the larger time periods (such as weeks, months, quarters, or years).
- Open the table data for aggregation.
- Place the table into the Pivot Table macro.
- Select the Pivot Table macro and click Edit.
- Switch to the Options tab.
- Locate the Date format box and enter the correct date format used in your source table.
- Locate the Date period aggregation option and select the time period for aggregation.
- Save the macro and the page.
- Define parameters of the Pivot Table macro on the control panel:
- Row Labels - select the table column with dates for aggregation.
- Calculated Column - select the column for calculation.
- Operation Type - select the appropriate operation type.
- Save the changes.
Using the Literal operation for grouping values
- Open the table data for aggregation.
- Place the table into the Pivot Table macro.
- Save the macro and the page.
- Define parameters of the Pivot Table macro on the control panel:
- Row labels - select the table column with labels (text values) for aggregation.
- Column labels - select the table column with labels (text values) for aggregation.
- Calculated Column - select the column with labels (text values, icons, emoticons, statuses) for aggregation.
- Operation Type - select 'Literal' as an operation type.
- Save the changes.
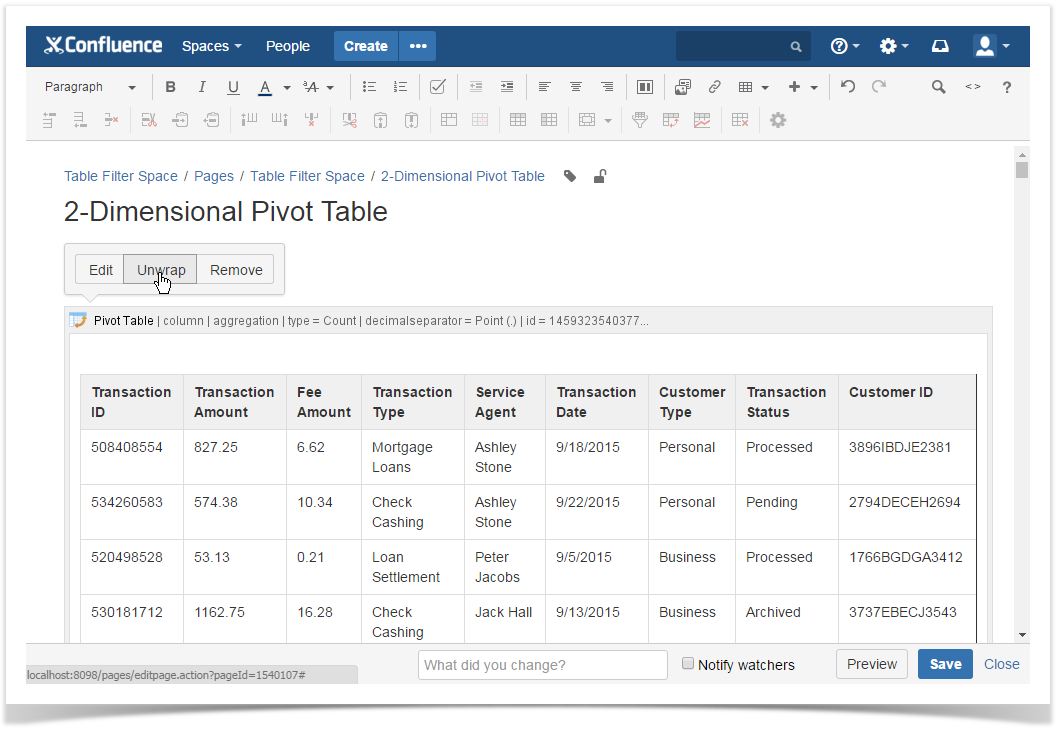
Removing Pivot Table macro for Tables
- Switch Confluence page to the edit mode.
- Select the Pivot Table macro with the table or macro outputting the table.
- Click Unwrap.
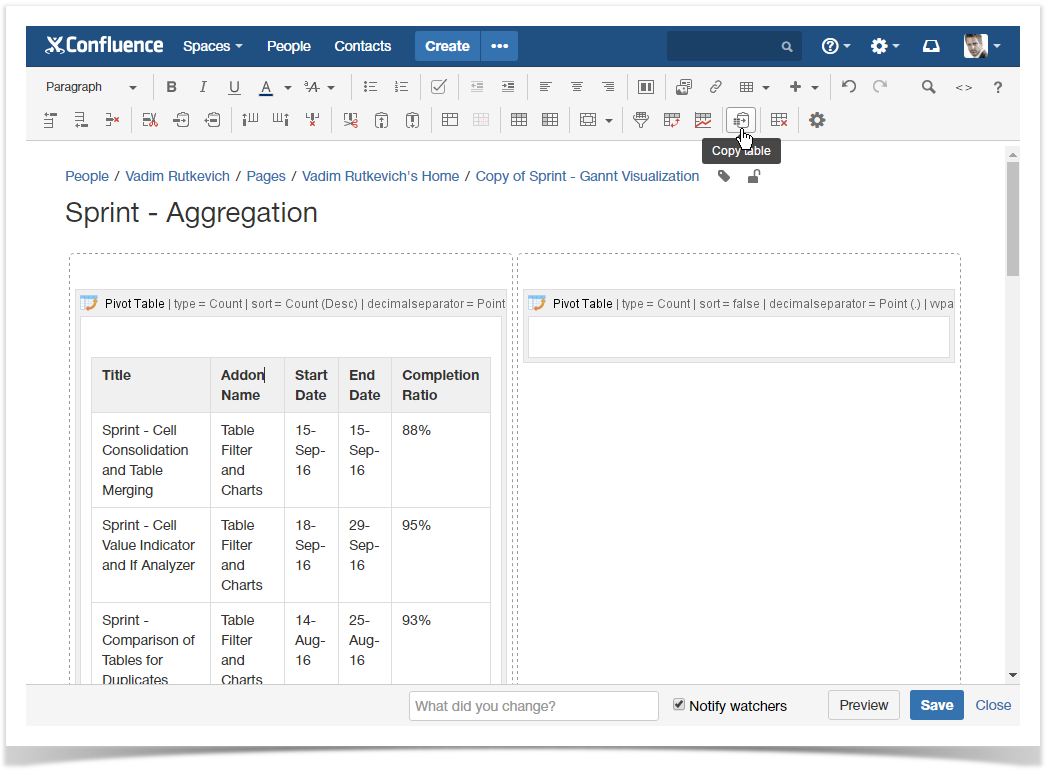
Copying a table into Pivot Table macro
- Switch Confluence page to the edit mode.
- Position the mouse pointer into any cell of the table you want to copy.
- Click the Copy Table
 icon on the editor pane.
 - Paste the table into the Pivot Table macro on the same or on a new page.
You can also use the Table Excerpt and Table Excerpt Include macros for building multiple pivot tables on the basis of a single source table. |

 icon.
icon.