• Table Filter, Charts & Spreadsheets for Confluence
  • Table Filter, Charts & Spreadsheets for Confluence
  • Need Help
  • FAQ
  • Migration
  • Book Live Demo
  • Start Free Trial
  • Suggest Feature
  • For monday.com
  • Cloud
    • Cloud
    • DC/Server
  • Table Filter, Charts & Spreadsheets for Confluence
  • How to work with built-in and third-party macros
  • Current: Awesome Graphs' Export to CSV
PDF

Download PDF

Download page Awesome Graphs' Export to CSV.

Awesome Graphs' Export to CSV

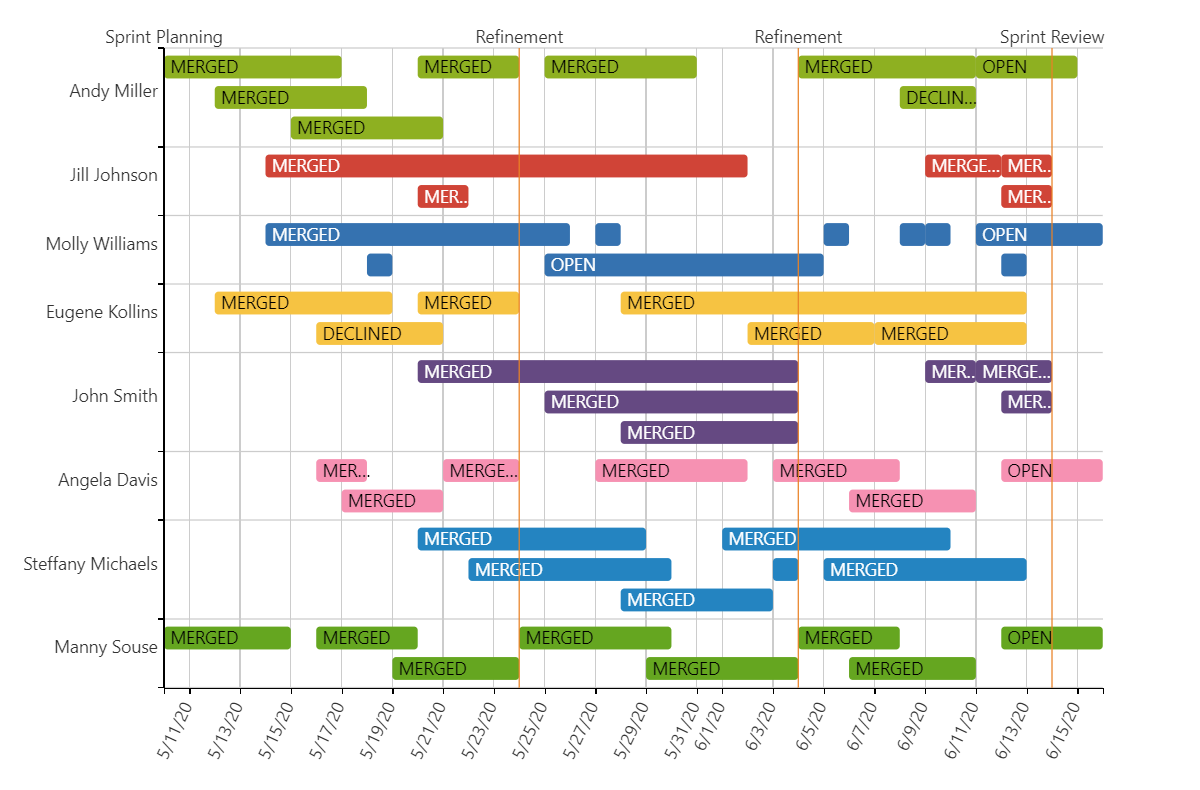
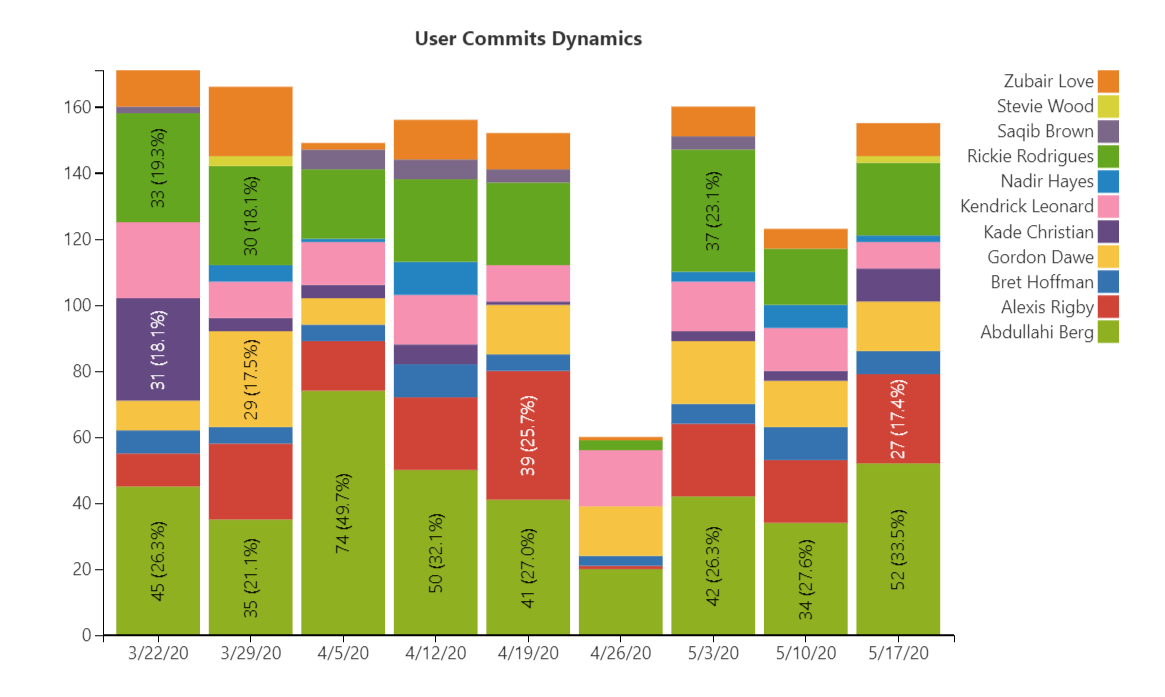
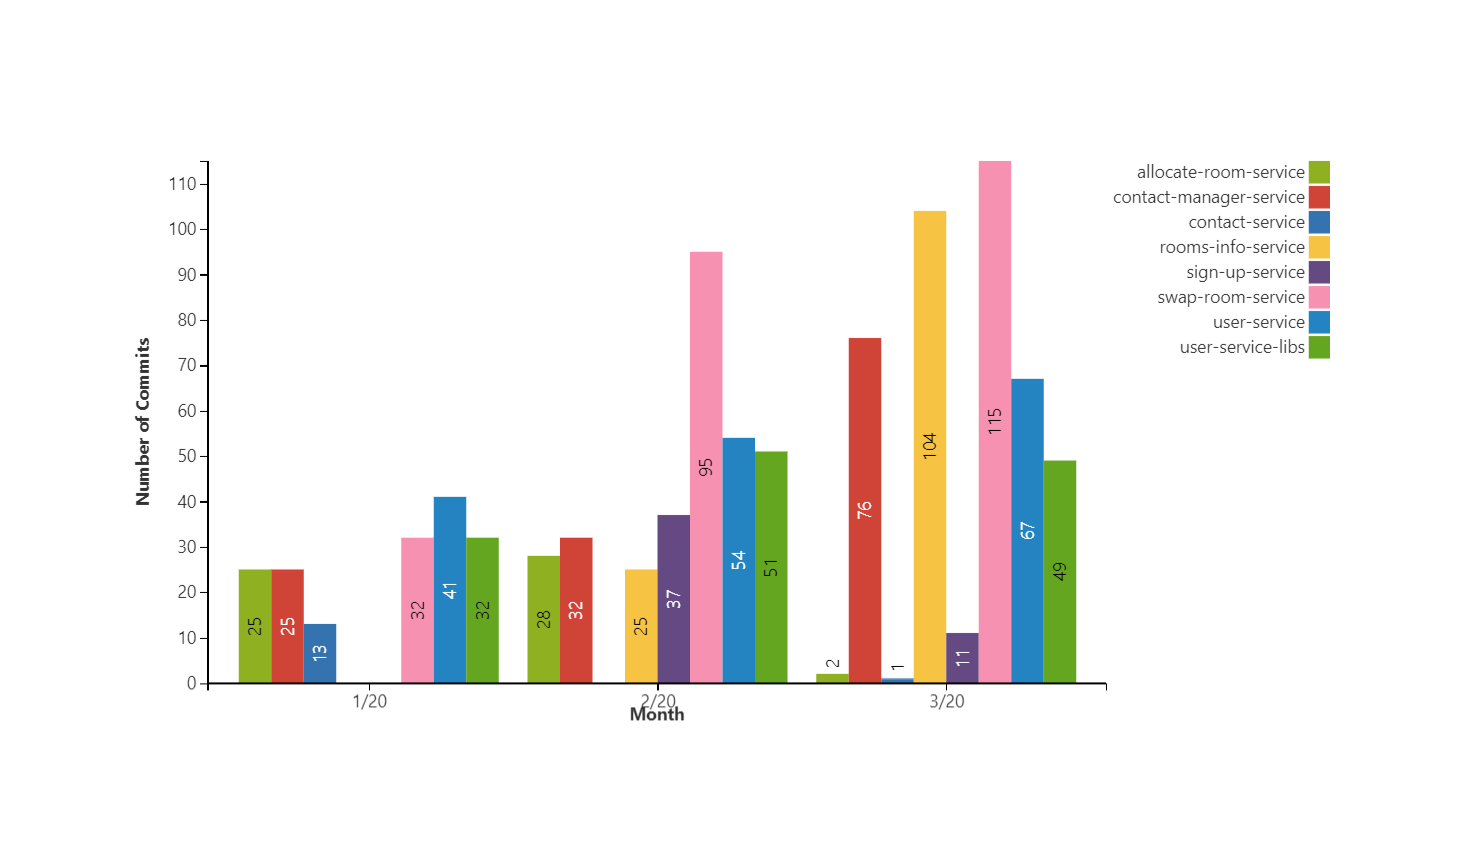
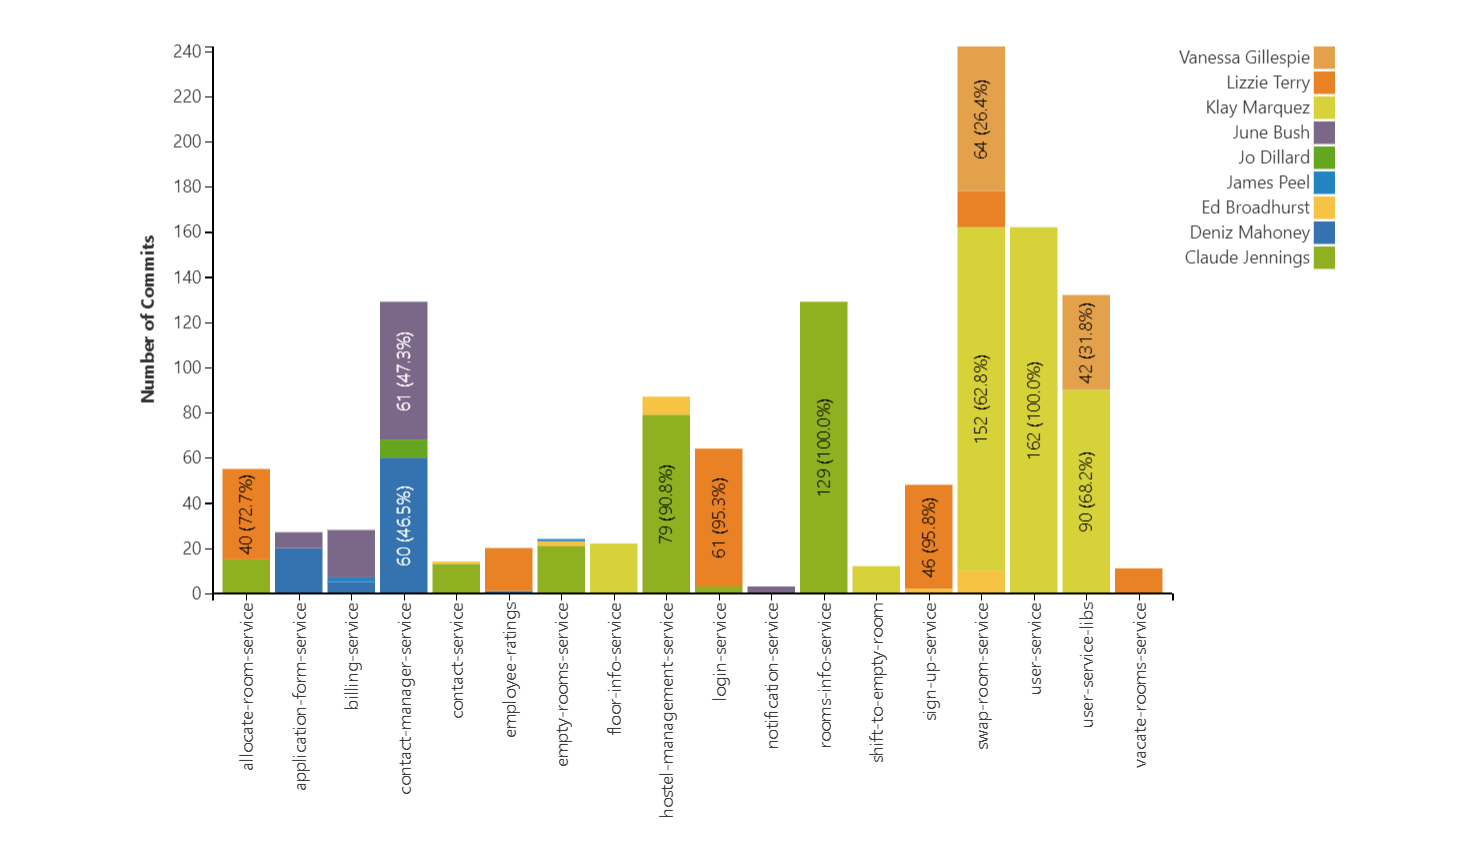
Awesome Graphs for Bitbucket gives you the capability to export raw data with the statistics across all projects and repositories to a CSV file by using the Export to CSV feature. As a result, you will get the list of the commits or pull requests made during the selected time span with their details.

The resulting CSV file can be further exported into Confluence and transformed into a table using Table Filter, Charts & Spreadsheets' Table from CSV macro .

  • Average Pull Request Cycle Time Dynamics

    Dmitry Trofimov
  • Building the Code Frequency Graph to See the Project Dynamics

    Dmitry Trofimov
  • Lines of Code by User Chart

    Dmitry Trofimov
  • Pull Request Activities Charts

    Dmitry Trofimov
  • Pull Request Cycle Time Distribution

    Dmitry Trofimov
  • Pull Requests Gantt Chart

    Dmitry Trofimov
  • User Commits Dynamics Chart

    Dmitry Trofimov
  • Visualizing the Activity of the Teams by Month on the Project Level

    Dmitry Trofimov
  • Visualizing the Distribution of Contributors on the Project Level

    Dmitry Trofimov


Table Filter, Charts & Spreadsheets for Confluence Logo
Privacy Policy / Stiltsoft Europe App License Agreement / Stiltsoft website / Privacy and Data collection Policy
Copyright © 2025 Stiltsoft Europe • Powered by Scroll Viewport and Atlassian Confluence

Cookie Notice

This website uses cookies for analytics, personalization and advertising. By continuing to browse, you agree to our use of cookies.
Learn more

OK Don't track me.