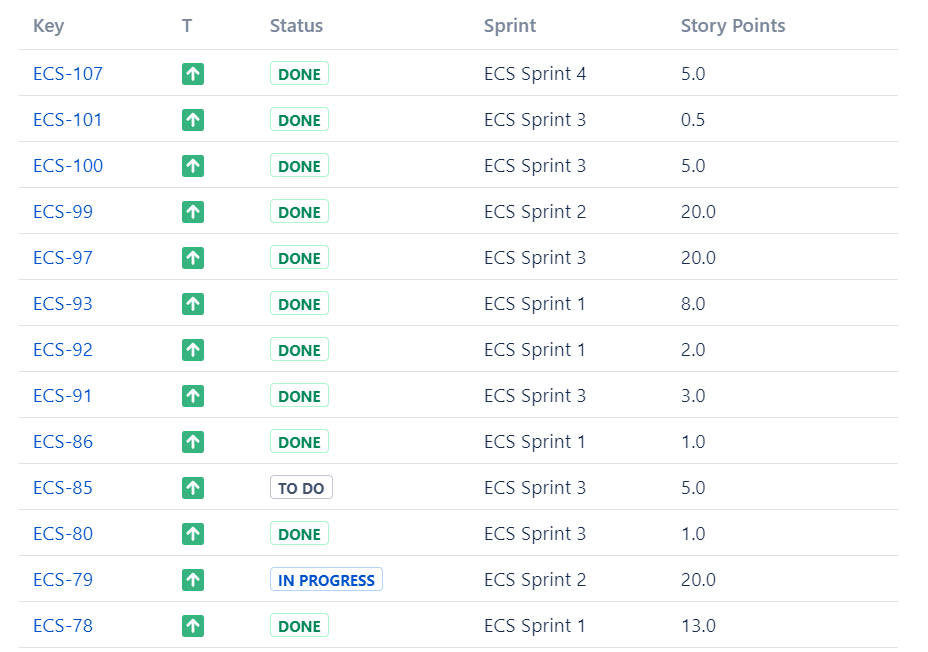
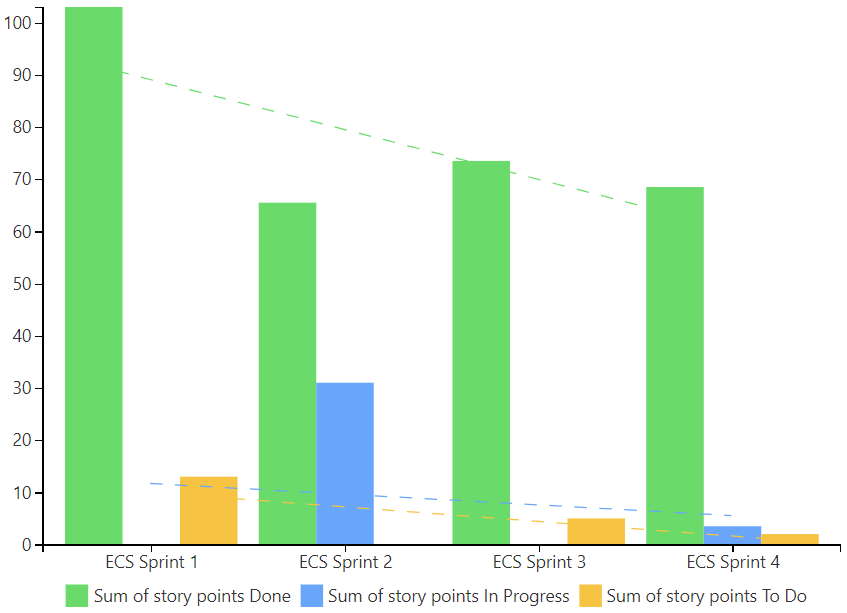
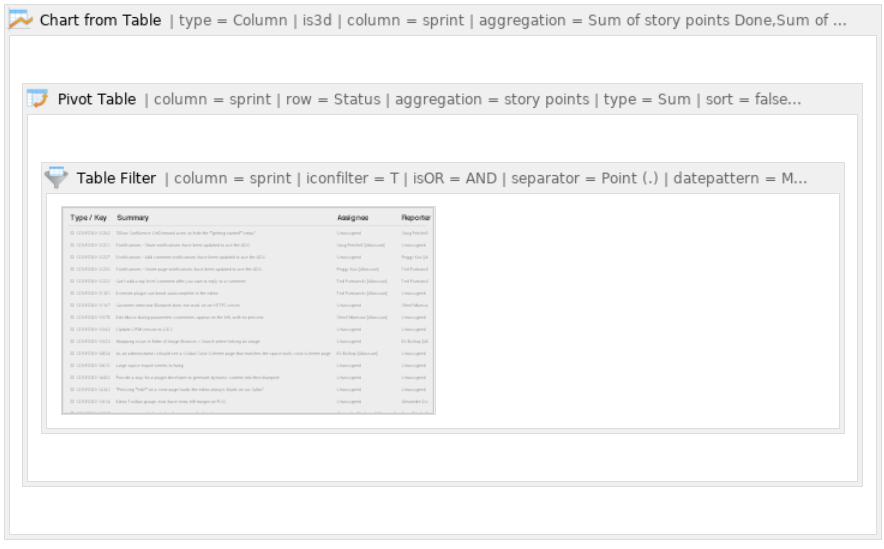
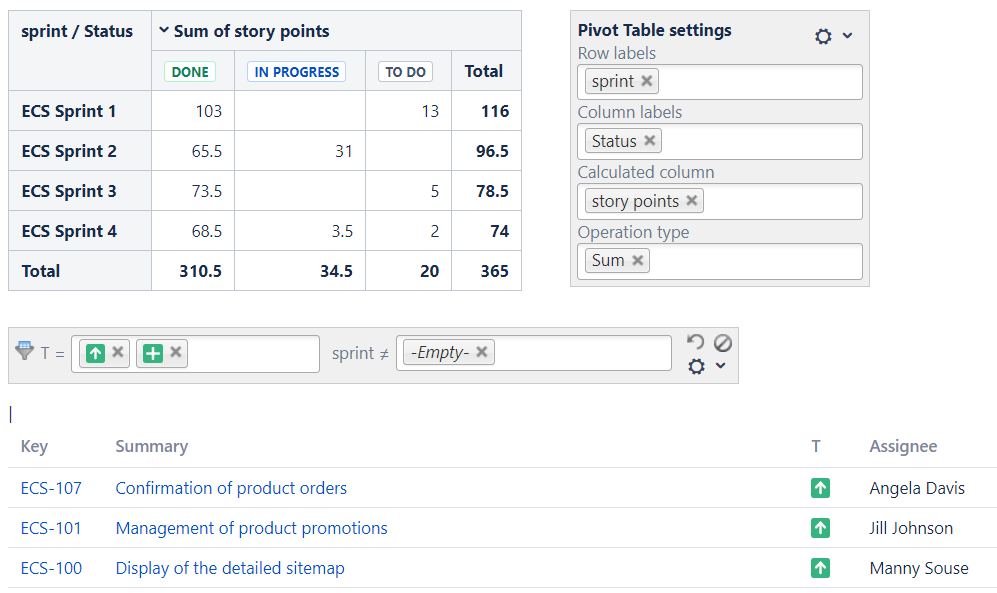
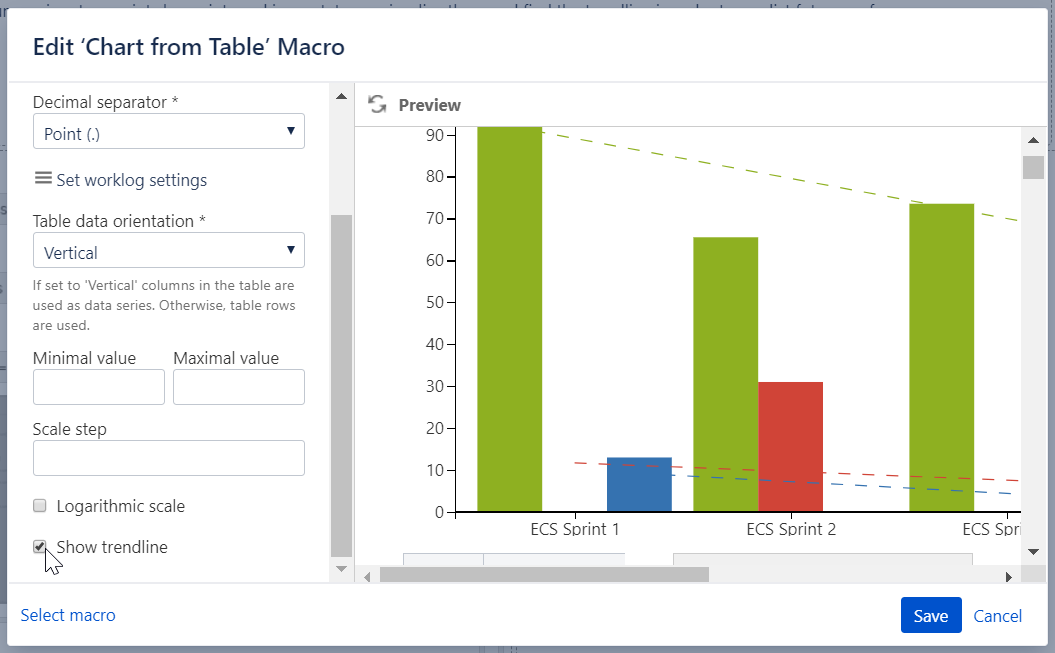
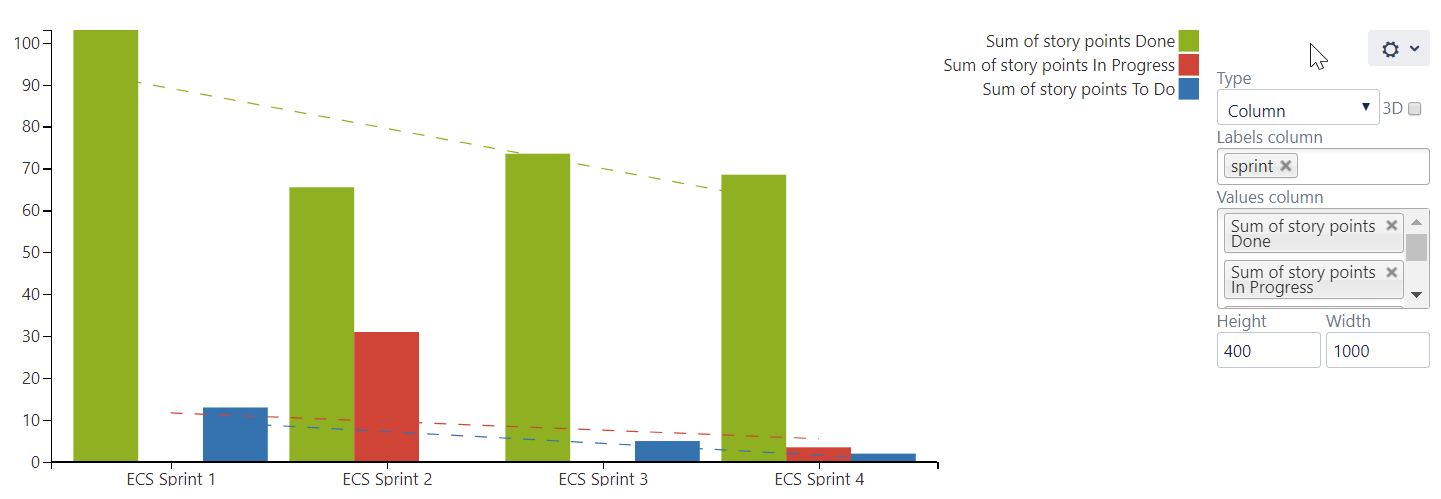
Table Filter, Charts & Spreadsheets for Confluence User guide Data sources Jira Issues Current: Visualizing Story Points Performance PDF Download PDF Download page Visualizing Story Points Performance. Current page All pages Visualizing Story Points Performance Overview The Source Table: The Result: Macro combination:Insert the Jira Issues macro.Wrap the Jira Issues macro in the Table Filter macro.Wrap the Table Filter macro in the Pivot Table macro.Wrap the Pivot Table macro in the Chart from Table macro. Macro configuration:Table Filter: Filter ColumnTSprintFilter TypeVisualDropdownFilter ValuesImprovement, New FeatureReversed filter: '-empty-'Pivot Table: Row LabelsSprintColumn LabelsStatusCalculated ColumnStory pointsOperation TypeSumChart from Table: TypeColumnLabels ColumnSprintValues ColumnSum of story points Done, Sum of story points In Progress, Sum of story points To DoAdditional parameters:Set the Show trendline option. ×