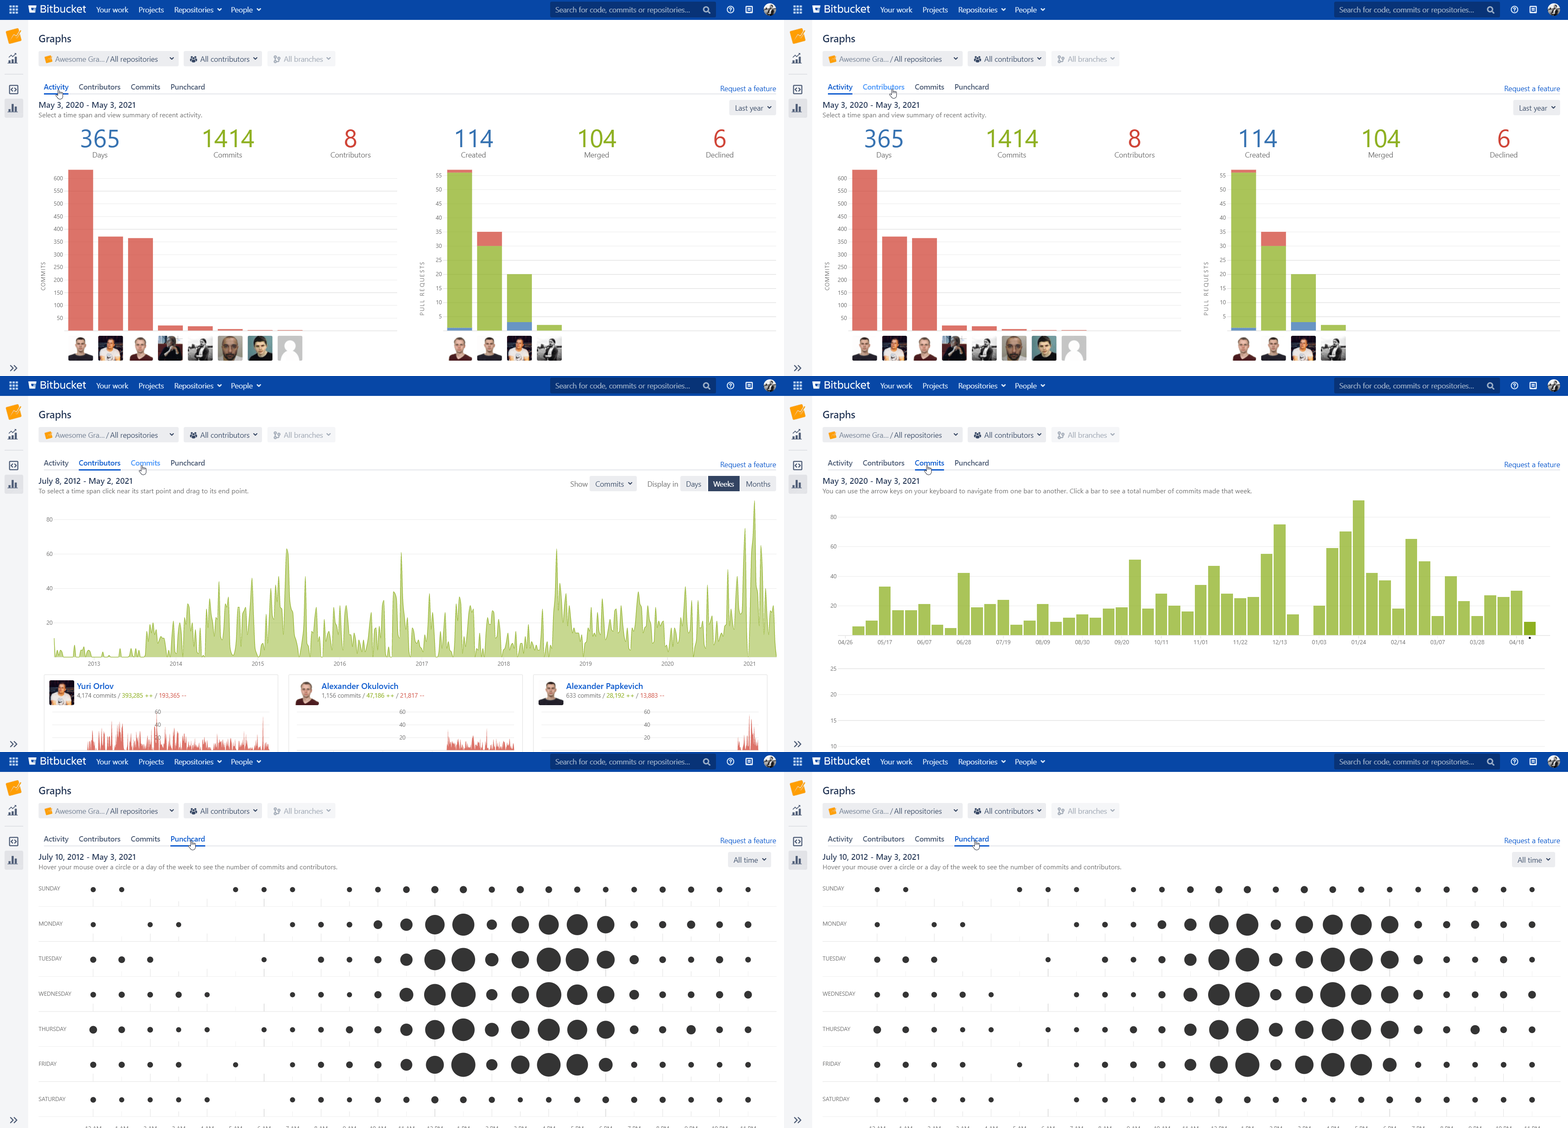
The Awesome Graphs for Bitbucket app provides you with a set of commit and pull request graphs and reports to analyze activity in your repositories and projects. The Activity, Contributors, and Punchcard graphs are also available on the global level.Here's the list of commits graphs and reports available at the moment:
To access the graphs, you need to go to the project or repository in Bitbucket you'd like to examine and click on the Graphs icon in the navigation bar.
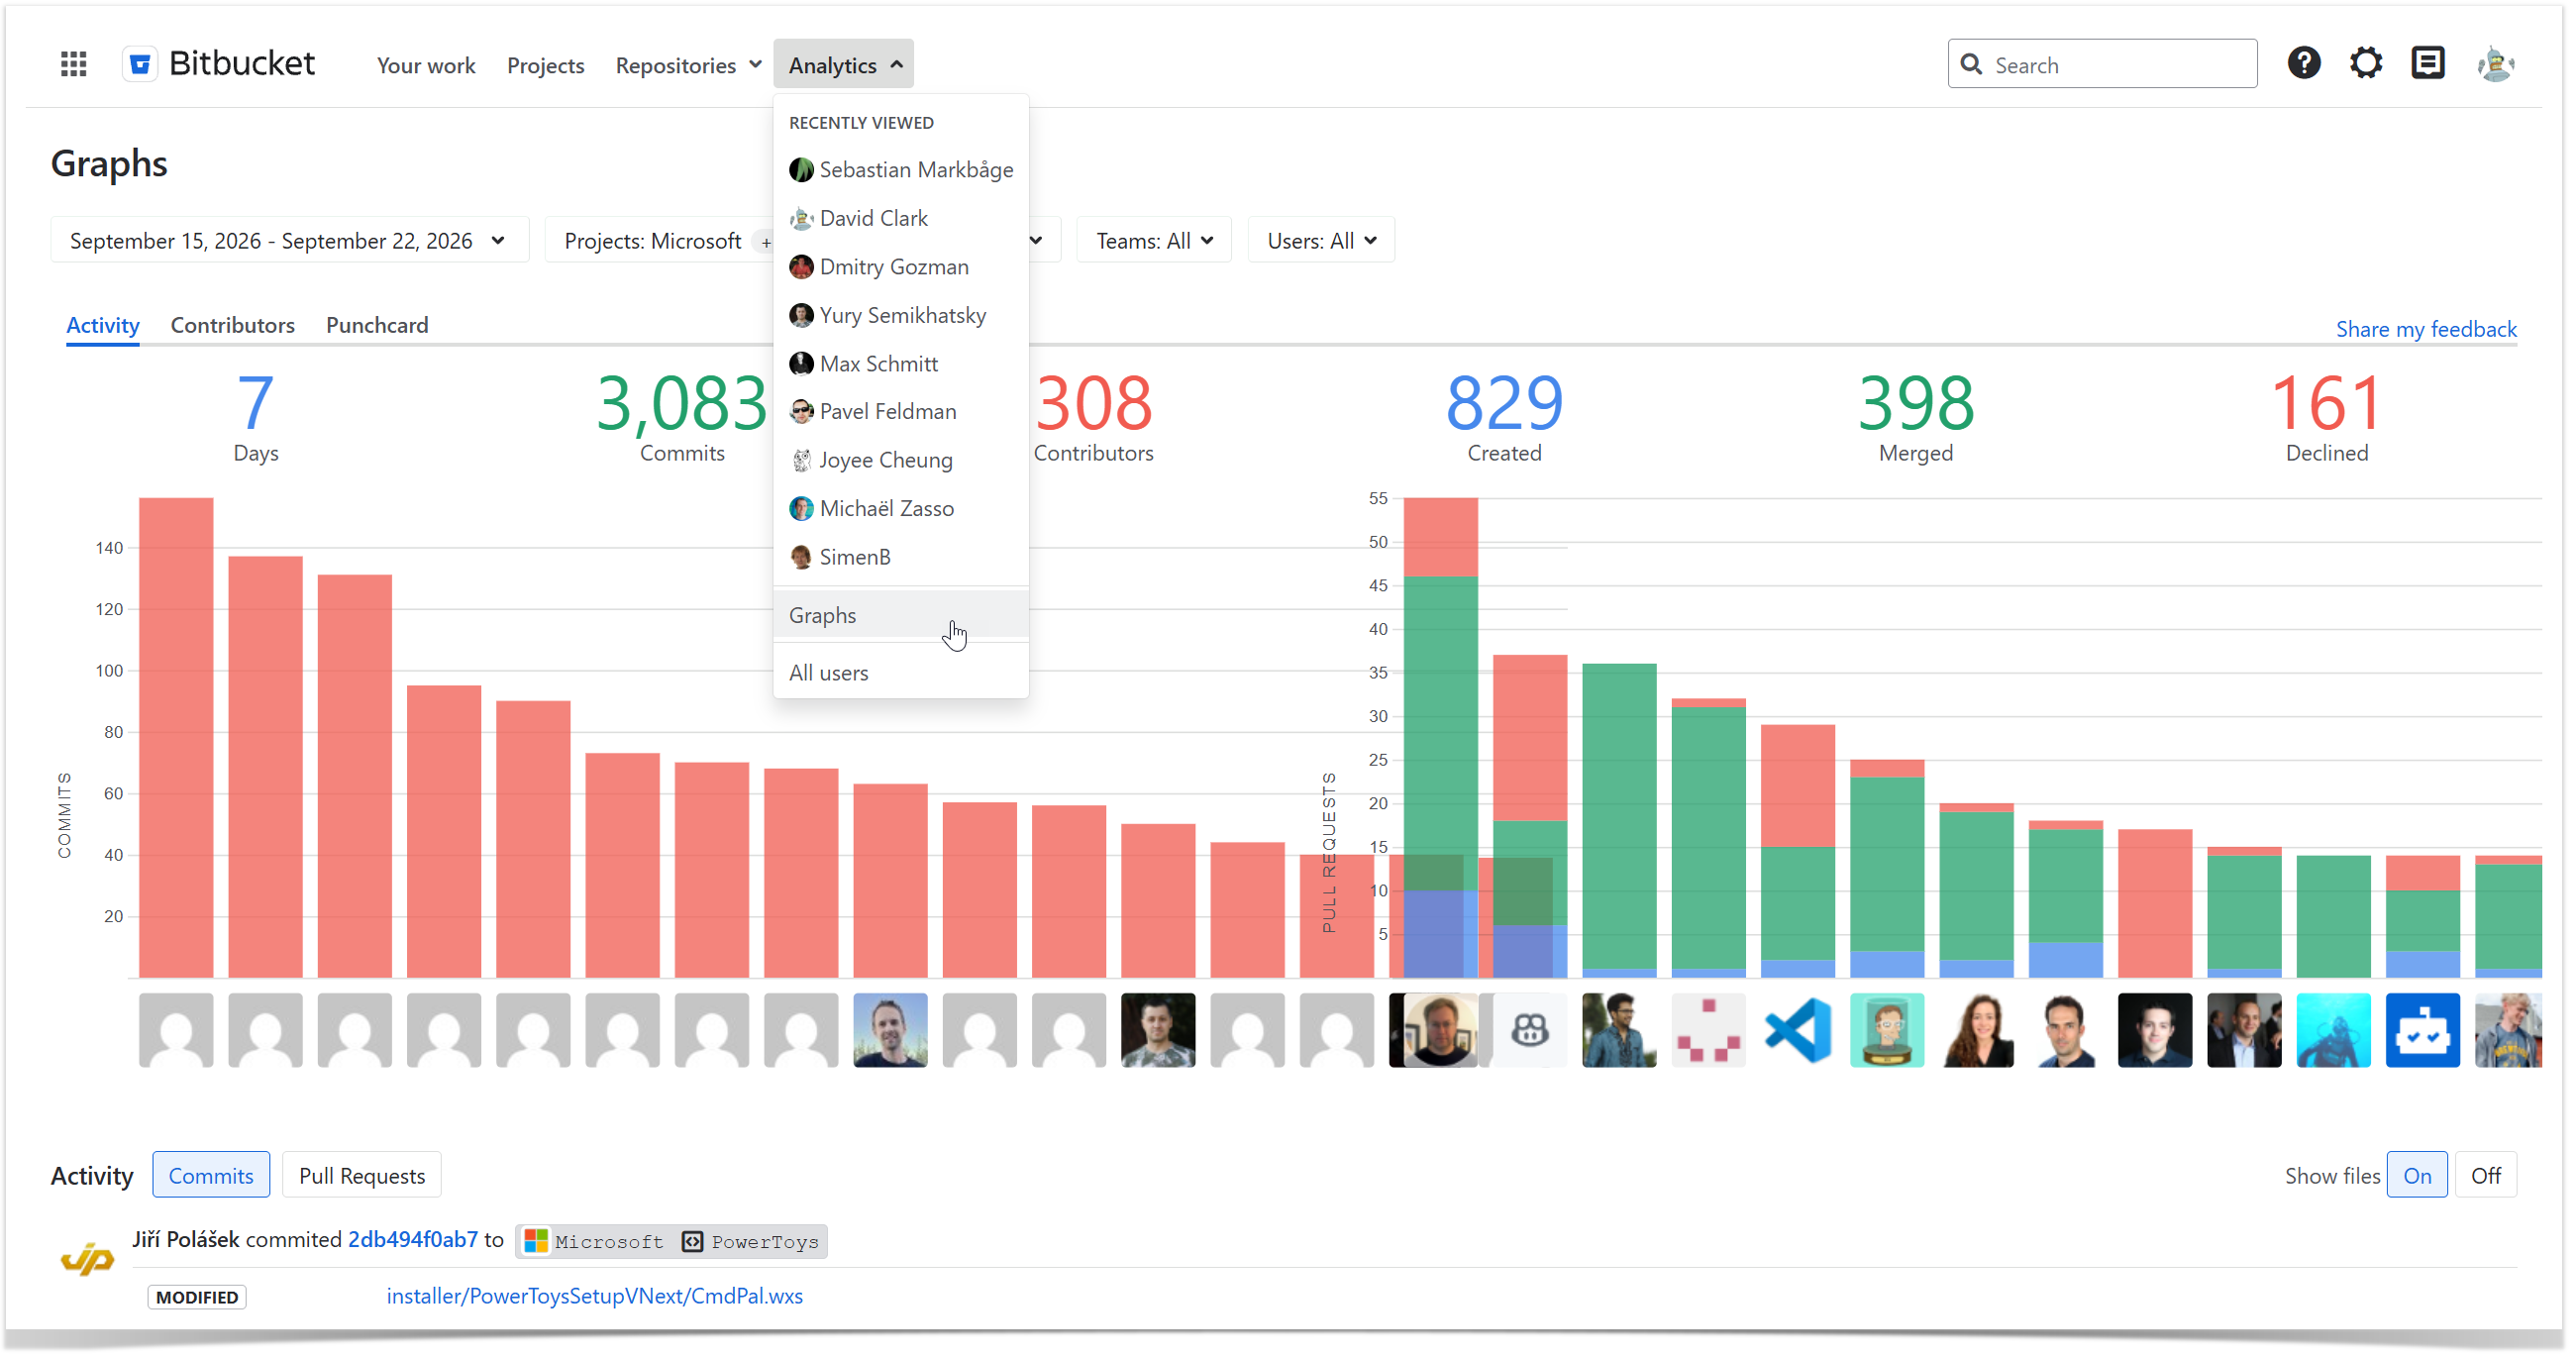
To access the global graphs, click Analytics in the Bitbucket header, then select Graphs.
How to switch between the graphs
You can switch between the available graphs by clicking on the respective tab in the top tabs bar.
How to get to the Reports page
To access the reports, you need to go to the project or repository in Bitbucket you'd like to examine and click on the Reports icon in the navigation bar.
Cookie Notice
This website uses cookies for analytics, personalization and advertising. By continuing to browse, you agree to our use of cookies. Learn more