| Excerpt | ||
|---|---|---|
| ||
Multiple useful options for better data visualization |
New in this release in the Chart from Table macro
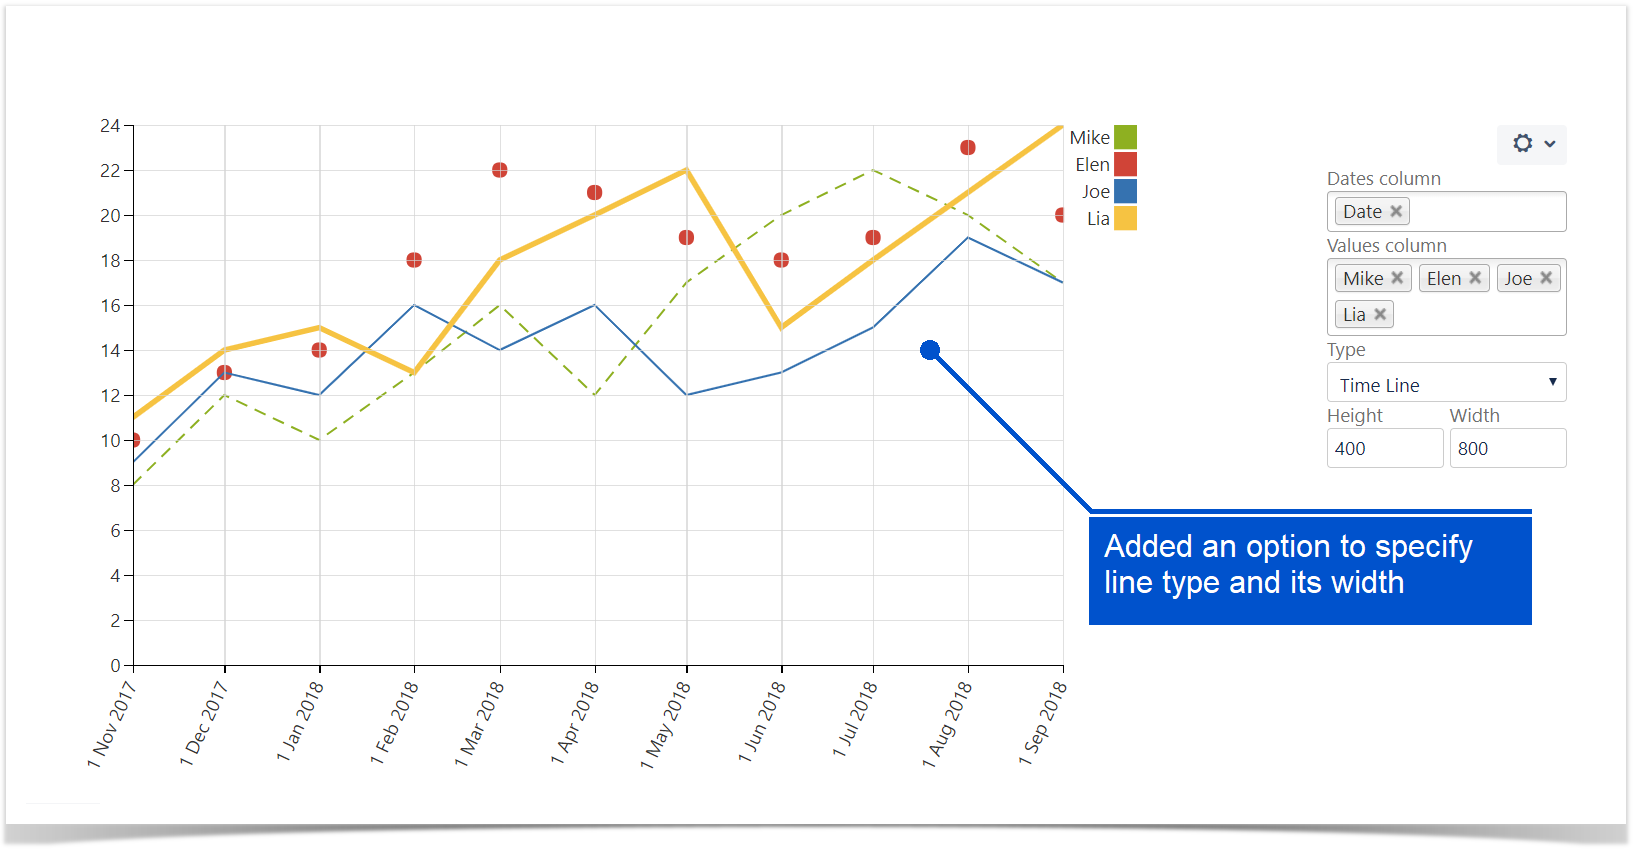
- Added an option to define an interpolation type individually for each line when using line charts.
- Added an option to select line type (solid, dash, dot) and its width when using line charts.
- Added an ability to show descriptions of milestones and events when you hove over the milestone (event) in Gantt charts.
- Added an option to choose a way to show data labels (percents and/or values or none) when using pie/donut charts.
New in this release in the Table Excerpt Include macro
- Added an option to show a copy of a source table.
| Disable Content Rating |
|---|