| Excerpt | ||
|---|---|---|
| ||
|

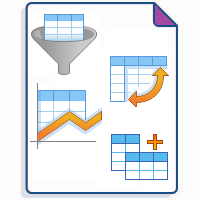
Pivot Table is one of the macros bundled in the the Table Filter and , Charts for Confluence& Spreadsheets app. The macro allows you to summarize your table data and produce its aggregated view in the form of a pivot table. You can select the appropriate operation types as follows:
Add Pivot Table on the page
| Section | ||||||||||||||||||||
|---|---|---|---|---|---|---|---|---|---|---|---|---|---|---|---|---|---|---|---|---|
|

| Section | ||||||||||||||||||||
|---|---|---|---|---|---|---|---|---|---|---|---|---|---|---|---|---|---|---|---|---|
|
| Section | ||||||||||||||||||||
|---|---|---|---|---|---|---|---|---|---|---|---|---|---|---|---|---|---|---|---|---|
|
Find the answer to your question among the related FAQ
| Section | |||||||
|---|---|---|---|---|---|---|---|
|
| Section | |||||||
|---|---|---|---|---|---|---|---|
|
| Section | |||||||
|---|---|---|---|---|---|---|---|
|
| Section | |||||||
|---|---|---|---|---|---|---|---|
|
| Section | |||||||
|---|---|---|---|---|---|---|---|
|