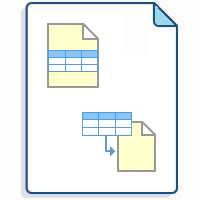
Pivot Table is one of the macros bundled in the Table Filter and Charts for Confluence app. The macro allows you to summarize your table data and produce its aggregated view in the form of a pivot table. You can select the appropriate operation types as follows:
Add Pivot Table on the page
Step 1. Add the macro to your table. Choose the handy way to do this:

Step 2. Select columns for calculation and aggregation:
Read more:
Step 3. Select the appropriate operation type:
Find the answer to your question among the related FAQ
![]()
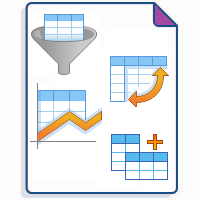
Build various charts based on your table
- Gantt chart type
- 2023-04-03_07-34-14_Pie and Donut chart types
- Bubble Pie chart type
- Column, Stacked Column, Bar, Stacked Bar chart types
- Line, Area, Stacked Area chart types
- Time Line, Time Area, Stacked Time Area chart types
- Radar (Spider) chart type
- Contiguity / Barcode chart (use case)
- Scatter plot (use case)
- Punchcard (use case)
- Comparison of Chart macro against Chart from Table macro