| Name
|
Size
|
Creator |
Creation Date
|
Last Modification Date
|
Labels |
Attached To |
|
PNG File show source table view.png |
64 kB |
Natalie Paramonova |
Jun 24, 2019 15:00 |
Jun 24, 2019 15:00 |
|
Page: Evaluating Calculated Planned and Spent Time Per Assignee
|
|
PNG File show source table view.png |
64 kB |
Natalie Paramonova |
Jun 24, 2019 15:03 |
Jun 24, 2019 15:03 |
|
Page: Visualizing of the Amount of Planned and Spent Time Within the Project
|
|
PNG File show source table view.png |
64 kB |
Natalie Paramonova |
Jun 25, 2019 07:18 |
Jun 25, 2019 07:18 |
|
Page: Creating a Dashboard Based on One Table
|
|
PNG File show source table view.png |
64 kB |
Natalie Paramonova |
Jun 25, 2019 07:13 |
Jun 25, 2019 07:13 |
|
Page: Building a Burnup Chart
|
|
PNG File show source table view.png |
64 kB |
Natalie Paramonova |
Jun 25, 2019 07:16 |
Jun 25, 2019 07:16 |
|
Page: Building a Gantt Chart
|
|
PNG File show source table view.png |
64 kB |
Natalie Paramonova |
Jun 25, 2019 07:11 |
Jun 25, 2019 07:11 |
|
Page: Visualizing of Completed Story Points by Teams
|
|
PNG File show source table view.png |
64 kB |
Natalie Paramonova |
Jun 24, 2019 13:16 |
Jun 24, 2019 13:16 |
|
Page: Using Table Filter and Charts in Combination with the Jira Issues Macro
|
|
PNG File show source table view.png |
64 kB |
Natalie Paramonova |
Jun 24, 2019 15:10 |
Jun 24, 2019 15:10 |
|
Page: Comparison of Graphs of Open and Resolved Tasks
|
|
PNG File show source table view.png |
64 kB |
Natalie Paramonova |
Jun 24, 2019 14:57 |
Jun 24, 2019 14:57 |
|
Page: Aggregating Issues by Assignee
|
|
PNG File formulas (source).png |
64 kB |
Natalie Paramonova |
Mar 27, 2019 14:12 |
Mar 27, 2019 14:12 |
|
Page: Custom Transformation - use cases with advanced SQL queries
|
|
PNG File image2015-7-31 11:45:2.png |
64 kB |
Vadim Rutkevich |
Sep 10, 2016 08:05 |
Sep 10, 2016 08:34 |
|
Page: Managing Filtration Parameters
|
|
PNG File image2015-7-31 11:45:2.png |
64 kB |
Vadim Rutkevich |
Mar 30, 2016 08:37 |
Mar 30, 2016 08:37 |
|
Page: Managing Look of the Table and Filtration Pane
|
|
PNG File image2015-7-31 11:45:2.png |
64 kB |
Vadim Rutkevich |
Jul 31, 2015 08:45 |
Jul 31, 2015 08:45 |
|
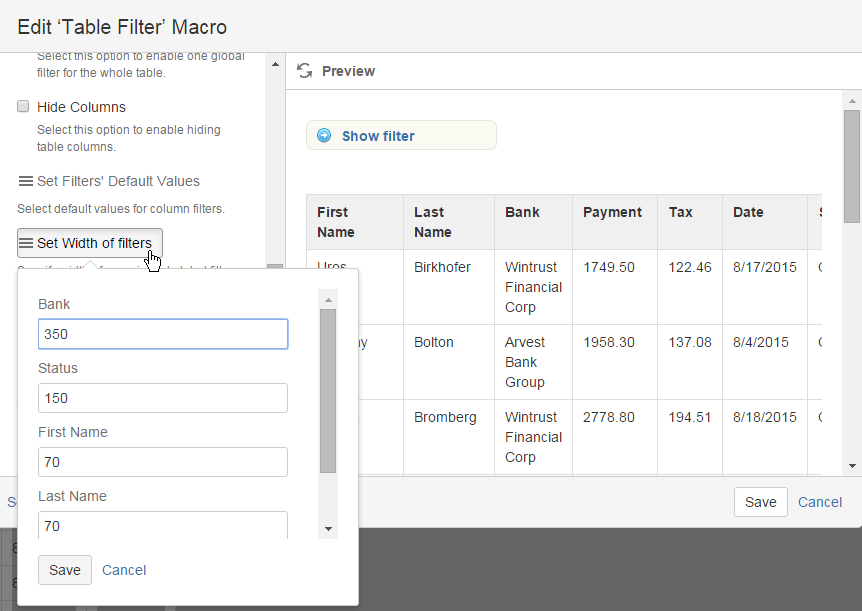
Page: How to use Table filter macro
|
|
PNG File image2015-12-29 13:23:40.png |
64 kB |
Vadim Rutkevich |
Dec 29, 2015 10:23 |
Dec 29, 2015 10:23 |
|
Page: Managing Filters in the Page View Mode
|
|
PNG File image2017-4-17 15:59:27.png |
64 kB |
Vadim Rutkevich |
Apr 17, 2017 12:59 |
Apr 17, 2017 12:59 |
|
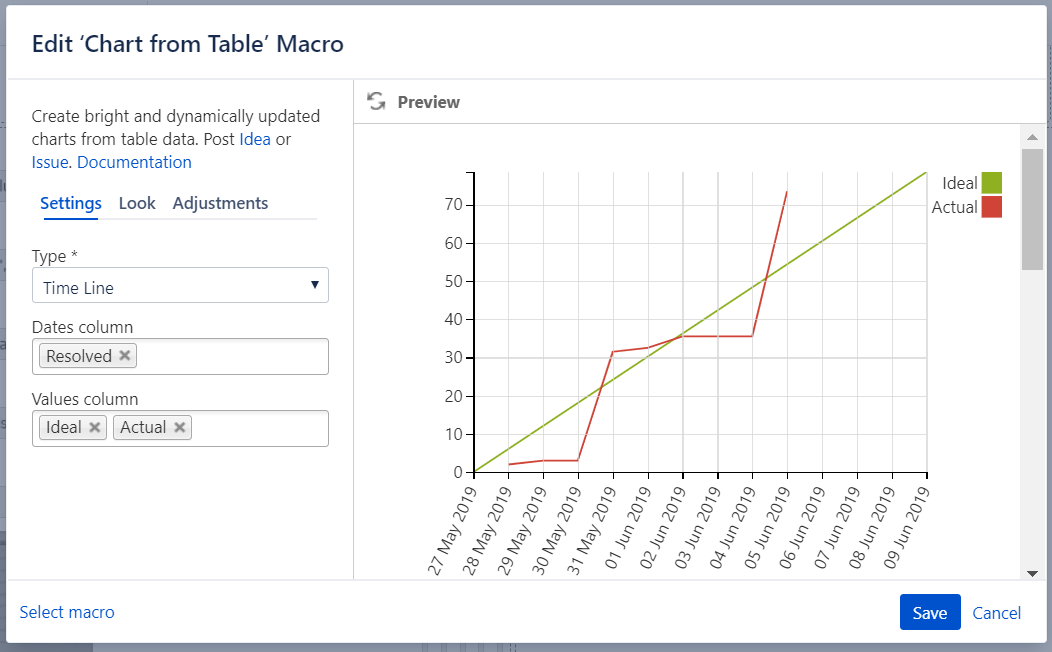
Page: How to use Chart from Table macro
|
|
PNG File image2015-10-16 17:5:56.png |
64 kB |
Vadim Rutkevich |
Oct 16, 2015 14:35 |
Oct 16, 2015 14:44 |
|
Page: Filtering tables generated by other add-ons and macros
|
|
PNG File image2015-10-16 17:5:56.png |
64 kB |
Vadim Rutkevich |
Oct 16, 2015 14:05 |
Oct 16, 2015 14:05 |
|
Page: Managing Look of the Table and Filtration Pane
|
|
PNG File image2015-10-16 17:5:56.png |
64 kB |
Vadim Rutkevich |
Sep 10, 2016 08:05 |
Sep 10, 2016 08:34 |
|
Page: Managing Filtration Parameters
|
|
PNG File image2015-10-16 17:5:56.png |
64 kB |
Vadim Rutkevich |
Sep 10, 2016 10:23 |
Sep 10, 2016 11:07 |
|
Page: Exporting Table Data
|
|
PNG File burnup_3.png |
63 kB |
Natalie Paramonova |
Jul 05, 2019 09:28 |
Jul 05, 2019 09:28 |
|
Page: Building a Burndown Chart
|