| Name
|
Size
|
Creator |
Creation Date
|
Last Modification Date
|
Labels |
Attached To |
|
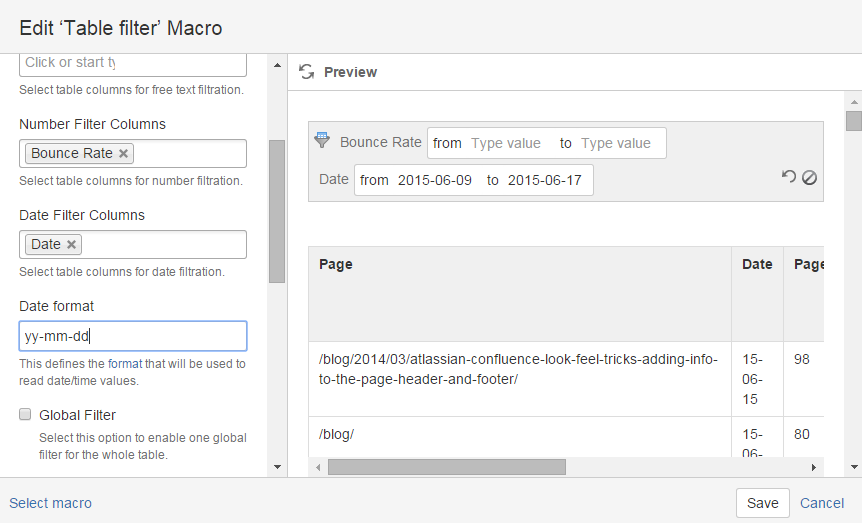
PNG File image2015-6-3 8:53:40.png |
60 kB |
Vadim Rutkevich |
Jun 03, 2015 05:53 |
Jun 03, 2015 05:53 |
|
Page: How to use Table filter macro
|
|
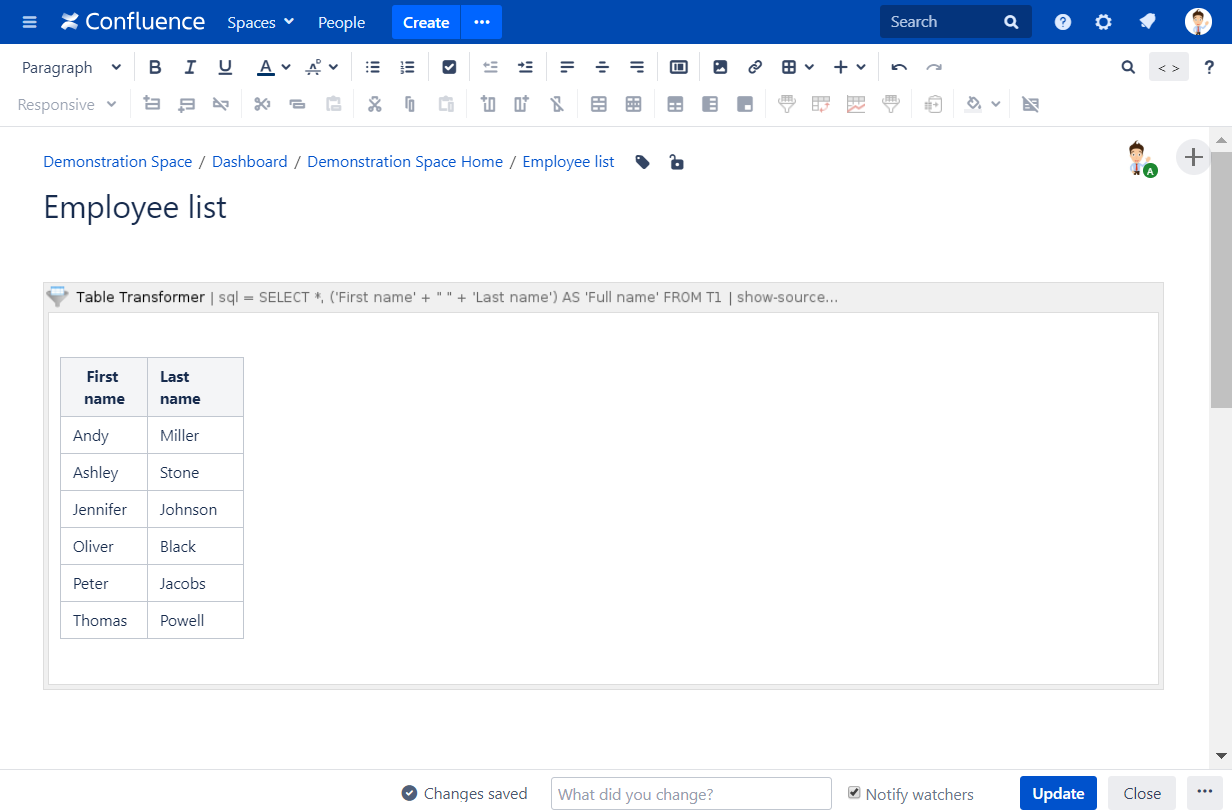
PNG File join text (source).png |
60 kB |
Natalie Paramonova |
Mar 27, 2019 14:13 |
Mar 27, 2019 14:13 |
|
Page: Custom Transformation - use cases with advanced SQL queries
|
|
PNG File project time_4.png |
60 kB |
Natalie Paramonova |
Jun 24, 2019 15:06 |
Jun 24, 2019 15:06 |
|
Page: Visualizing the Issues Distribution by Sprints or Releases
|
|
PNG File project time_4.png |
60 kB |
Natalie Paramonova |
Jun 24, 2019 15:00 |
Jun 24, 2019 15:00 |
|
Page: Evaluating Calculated Planned and Spent Time Per Assignee
|
|
PNG File project time_4.png |
60 kB |
Natalie Paramonova |
Jun 25, 2019 07:11 |
Jun 25, 2019 07:11 |
|
Page: Visualizing of Completed Story Points by Teams
|
|
PNG File project time_4.png |
60 kB |
Natalie Paramonova |
Jun 24, 2019 15:10 |
Jun 24, 2019 15:10 |
|
Page: Comparison of Graphs of Open and Resolved Tasks
|
|
PNG File project time_4.png |
60 kB |
Natalie Paramonova |
Jul 05, 2019 09:28 |
Jul 05, 2019 09:28 |
|
Page: Building a Burndown Chart
|
|
PNG File project time_4.png |
60 kB |
Natalie Paramonova |
Jun 24, 2019 15:16 |
Jun 24, 2019 15:16 |
|
Page: Visualizing Story Points Performance
|
|
PNG File project time_4.png |
60 kB |
Natalie Paramonova |
Jun 24, 2019 15:03 |
Jun 24, 2019 15:03 |
|
Page: Visualizing of the Amount of Planned and Spent Time Within the Project
|
|
PNG File project time_4.png |
60 kB |
Natalie Paramonova |
Jun 24, 2019 14:57 |
Jun 24, 2019 14:57 |
|
Page: Aggregating Issues by Assignee
|
|
PNG File project time_4.png |
60 kB |
Natalie Paramonova |
Jun 25, 2019 07:13 |
Jun 25, 2019 07:13 |
|
Page: Building a Burnup Chart
|
|
PNG File project time_4.png |
60 kB |
Natalie Paramonova |
Jun 25, 2019 07:18 |
Jun 25, 2019 07:18 |
|
Page: Creating a Dashboard Based on One Table
|
|
PNG File project time_4.png |
60 kB |
Natalie Paramonova |
Jun 24, 2019 15:23 |
Jun 24, 2019 15:23 |
|
Page: Calculating Velocity
|
|
PNG File project time_4.png |
60 kB |
Natalie Paramonova |
Jun 25, 2019 07:16 |
Jun 25, 2019 07:16 |
|
Page: Building a Gantt Chart
|
|
PNG File project time_4.png |
60 kB |
Natalie Paramonova |
Jun 21, 2019 13:25 |
Jun 21, 2019 13:25 |
|
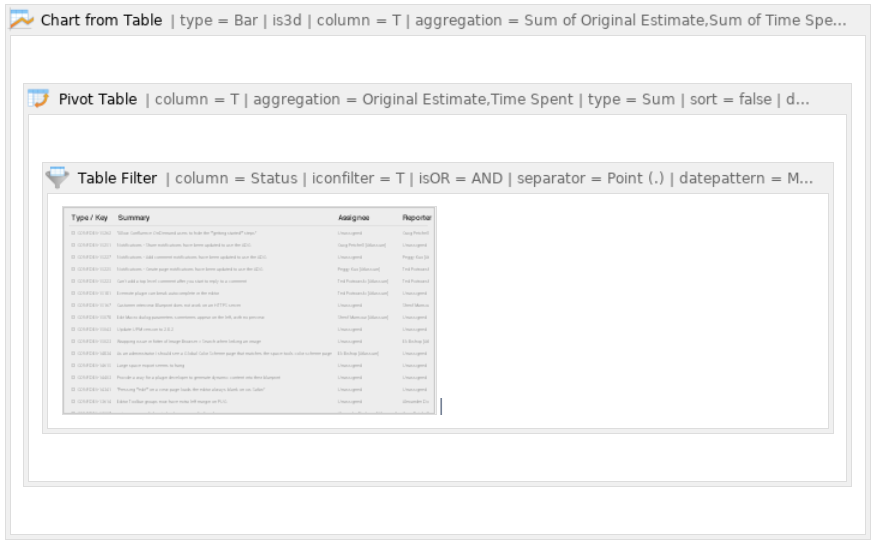
Page: Using Table Filter and Charts in Combination with the Jira Issues Macro
|
|
PNG File image2015-10-16 17:9:46.png |
59 kB |
Vadim Rutkevich |
Oct 16, 2015 14:09 |
Oct 16, 2015 14:09 |
|
Page: Managing Look of the Table and Filtration Pane
|
|
PNG File image2015-10-16 17:9:46.png |
59 kB |
Vadim Rutkevich |
Sep 10, 2016 08:05 |
Sep 10, 2016 08:34 |
|
Page: Managing Filtration Parameters
|
|
PNG File image2015-10-16 17:9:46.png |
59 kB |
Vadim Rutkevich |
Sep 10, 2016 10:23 |
Sep 10, 2016 11:07 |
|
Page: Exporting Table Data
|
|
PNG File image2015-10-16 17:9:46.png |
59 kB |
Vadim Rutkevich |
Oct 16, 2015 14:35 |
Oct 16, 2015 14:44 |
|
Page: Filtering tables generated by other add-ons and macros
|
|
PNG File 2019-07-12_10h28_54.png |
59 kB |
Natalie Paramonova |
Jul 12, 2019 07:38 |
Jul 12, 2019 07:38 |
|
Page: Custom Transformation - use cases with advanced SQL queries
|