| Name
|
Size
|
Creator |
Creation Date
|
Last Modification Date
|
Labels |
Attached To |
|
PNG File velocity_5.png |
56 kB |
Natalie Paramonova |
Jun 25, 2019 07:13 |
Jun 25, 2019 07:13 |
|
Page: Building a Burnup Chart
|
|
PNG File velocity_5.png |
56 kB |
Natalie Paramonova |
Jun 25, 2019 07:16 |
Jun 25, 2019 07:16 |
|
Page: Building a Gantt Chart
|
|
PNG File velocity_5.png |
56 kB |
Natalie Paramonova |
Jun 25, 2019 07:11 |
Jun 25, 2019 07:11 |
|
Page: Visualizing of Completed Story Points by Teams
|
|
PNG File velocity_5.png |
56 kB |
Natalie Paramonova |
Jun 24, 2019 15:23 |
Jun 24, 2019 15:23 |
|
Page: Calculating Velocity
|
|
PNG File velocity_5.png |
56 kB |
Natalie Paramonova |
Jun 24, 2019 07:41 |
Jun 24, 2019 07:41 |
|
Page: Using Table Filter and Charts in Combination with the Jira Issues Macro
|
|
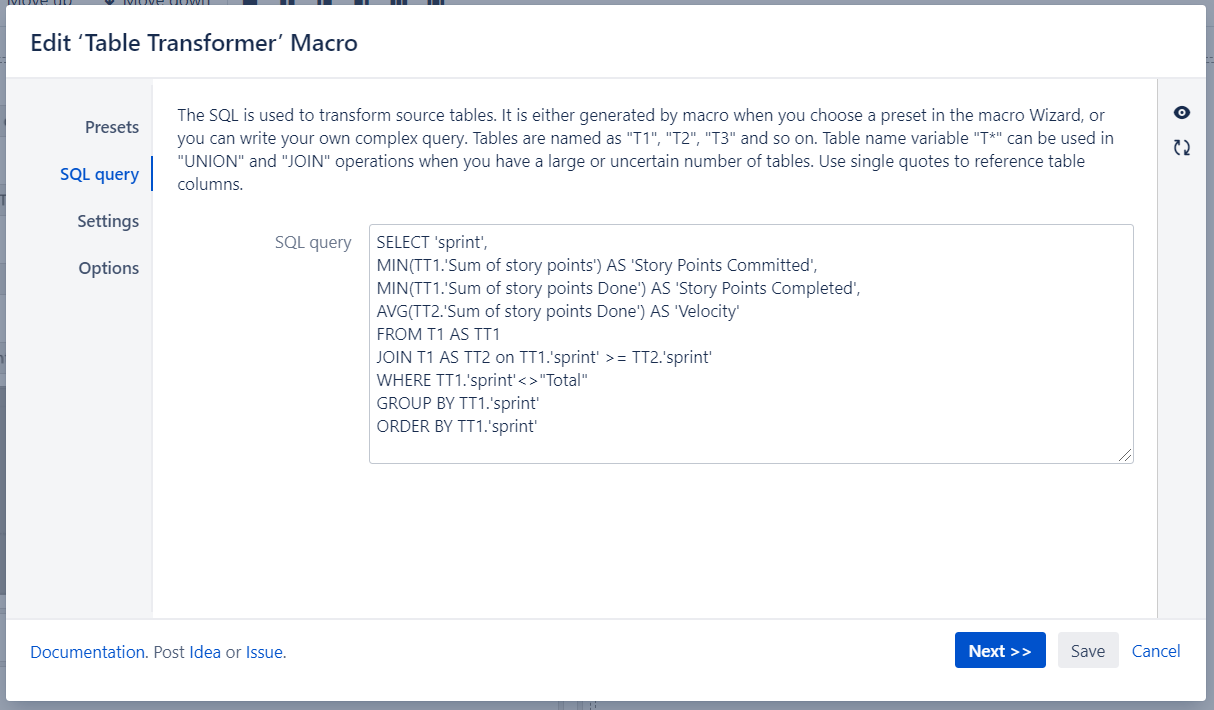
PNG File 2019-07-11_19h39_15.png |
56 kB |
Natalie Paramonova |
Jul 11, 2019 16:41 |
Jul 11, 2019 16:41 |
|
Page: Custom Transformation - use cases with advanced SQL queries
|
|
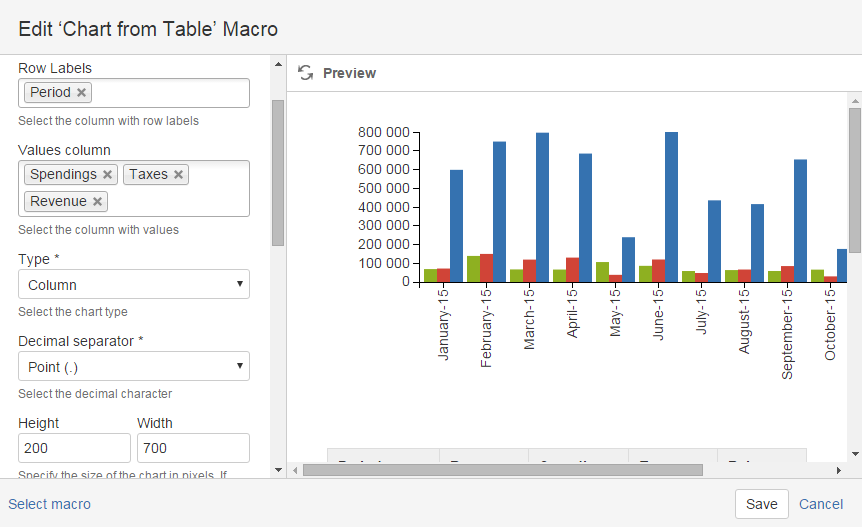
PNG File image2016-2-26 9:45:19.png |
56 kB |
Vadim Rutkevich |
Feb 26, 2016 06:45 |
Feb 26, 2016 06:45 |
|
Page: How to use Chart from Table macro
|
|
PNG File burndown_4.png |
56 kB |
Natalie Paramonova |
Jul 05, 2019 10:04 |
Jul 05, 2019 10:04 |
|
Page: Building a Burndown Chart
|
|
PNG File image2018-3-26_14-21-21.png |
56 kB |
Vadim Rutkevich |
Mar 26, 2018 11:21 |
Mar 26, 2018 11:21 |
|
Page: Managing Look of the Table and Filtration Pane
|
|
PNG File gantt.png |
55 kB |
Natalie Paramonova |
Jun 25, 2019 09:03 |
Jun 25, 2019 09:03 |
|
Page: Building a Gantt Chart
|
|
PNG File image2016-9-21 14:59:0.png |
55 kB |
Vadim Rutkevich |
Sep 21, 2016 11:59 |
Sep 21, 2016 11:59 |
|
Page: Managing Visual Filters
|
|
PNG File image2015-6-3 10:5:25.png |
55 kB |
Vadim Rutkevich |
Jun 03, 2015 07:05 |
Jun 03, 2015 07:05 |
|
Page: How to use Table filter macro
|
|
PNG File image2018-3-7_17-10-31.png |
55 kB |
Vadim Rutkevich |
Mar 07, 2018 14:10 |
Mar 07, 2018 14:10 |
|
Page: Table Filter and Charts 4.1.0
|
|
PNG File default_values.png |
55 kB |
Unknown User (ikornev) |
Nov 19, 2013 14:50 |
Nov 19, 2013 14:50 |
|
Page: How to use Table filter macro
|
|
PNG File aggregating by assignee_6.png |
55 kB |
Natalie Paramonova |
Jul 05, 2019 09:28 |
Jul 05, 2019 09:28 |
|
Page: Building a Burndown Chart
|
|
PNG File aggregating by assignee_6.png |
55 kB |
Natalie Paramonova |
Jun 24, 2019 15:10 |
Jun 24, 2019 15:10 |
|
Page: Comparison of Graphs of Open and Resolved Tasks
|
|
PNG File aggregating by assignee_6.png |
55 kB |
Natalie Paramonova |
Jun 24, 2019 15:16 |
Jun 24, 2019 15:16 |
|
Page: Visualizing Story Points Performance
|
|
PNG File aggregating by assignee_6.png |
55 kB |
Natalie Paramonova |
Jun 24, 2019 15:03 |
Jun 24, 2019 15:03 |
|
Page: Visualizing of the Amount of Planned and Spent Time Within the Project
|
|
PNG File aggregating by assignee_6.png |
55 kB |
Natalie Paramonova |
Jun 24, 2019 15:06 |
Jun 24, 2019 15:06 |
|
Page: Visualizing the Issues Distribution by Sprints or Releases
|
|
PNG File aggregating by assignee_6.png |
55 kB |
Natalie Paramonova |
Jun 24, 2019 15:00 |
Jun 24, 2019 15:00 |
|
Page: Evaluating Calculated Planned and Spent Time Per Assignee
|