| Name
|
Size
|
Creator |
Creation Date
|
Last Modification Date
|
Labels |
Attached To |
|
PNG File time project.png |
52 kB |
Natalie Paramonova |
Jun 25, 2019 08:54 |
Jun 25, 2019 08:54 |
|
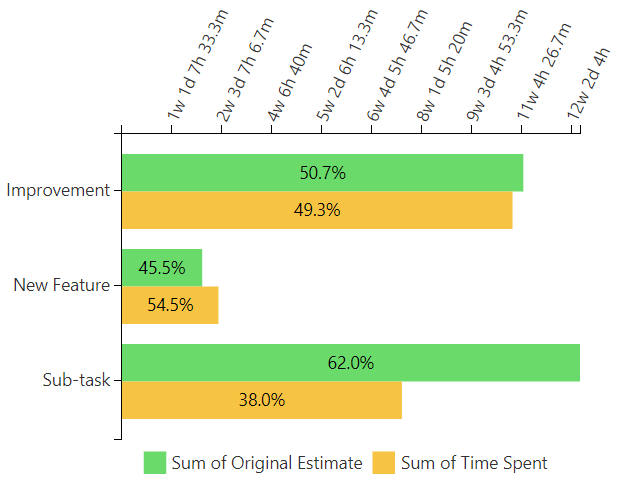
Page: Visualizing of the Amount of Planned and Spent Time Within the Project
|
|
PNG File evaluating.png |
31 kB |
Natalie Paramonova |
Jun 25, 2019 08:53 |
Jun 25, 2019 08:53 |
|
Page: Evaluating Calculated Planned and Spent Time Per Assignee
|
|
PNG File aggregating.png |
50 kB |
Natalie Paramonova |
Jun 25, 2019 08:49 |
Jun 25, 2019 08:49 |
|
Page: Aggregating Issues by Assignee
|
|
PNG File gantt_4.png |
48 kB |
Natalie Paramonova |
Jun 25, 2019 08:15 |
Jun 25, 2019 08:15 |
|
Page: Building a Gantt Chart
|
|
PNG File burnup_1.png |
42 kB |
Natalie Paramonova |
Jun 25, 2019 08:14 |
Jun 25, 2019 08:14 |
|
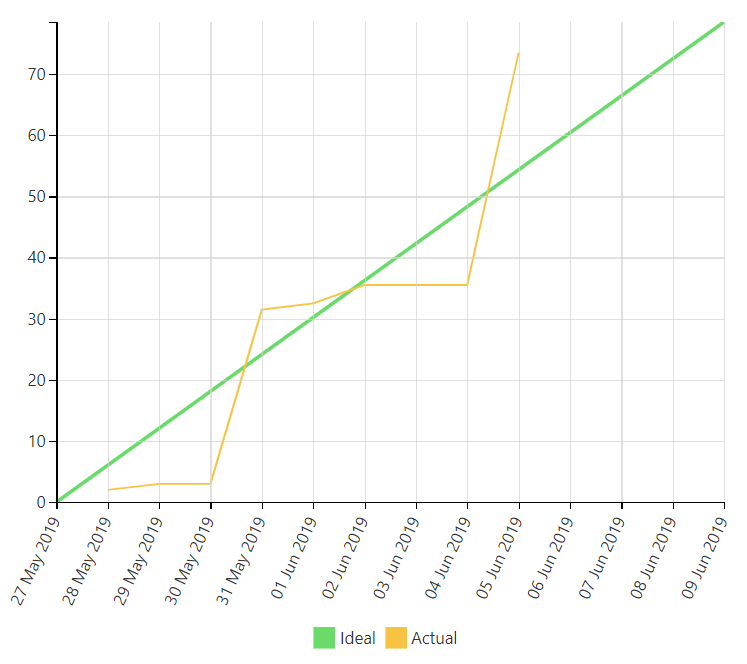
Page: Building a Burnup Chart
|
|
PNG File teams performance_2.png |
22 kB |
Natalie Paramonova |
Jun 25, 2019 08:14 |
Jun 25, 2019 08:14 |
|
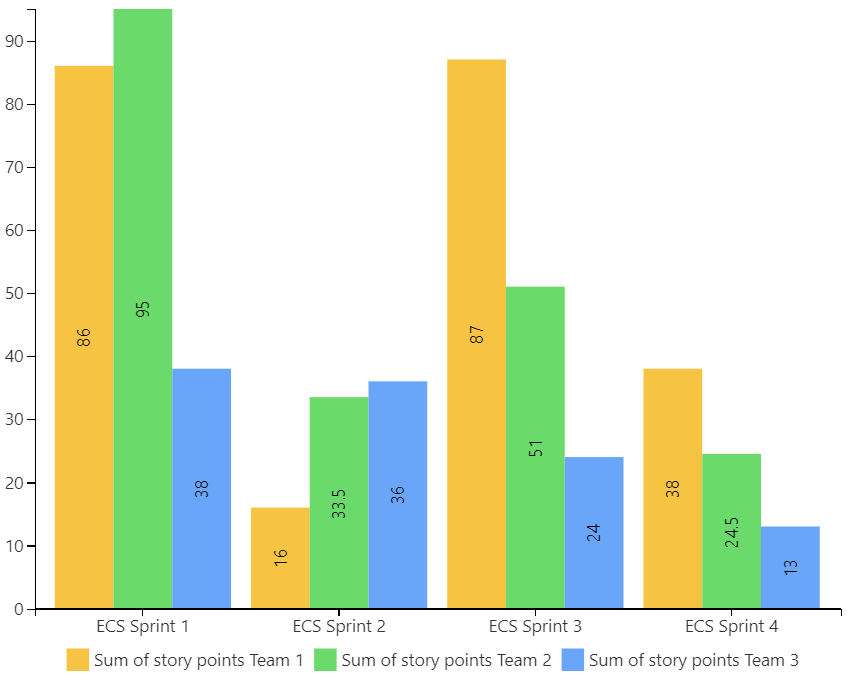
Page: Visualizing of Completed Story Points by Teams
|
|
PNG File velocity_2.png |
25 kB |
Natalie Paramonova |
Jun 25, 2019 08:13 |
Jun 25, 2019 08:13 |
|
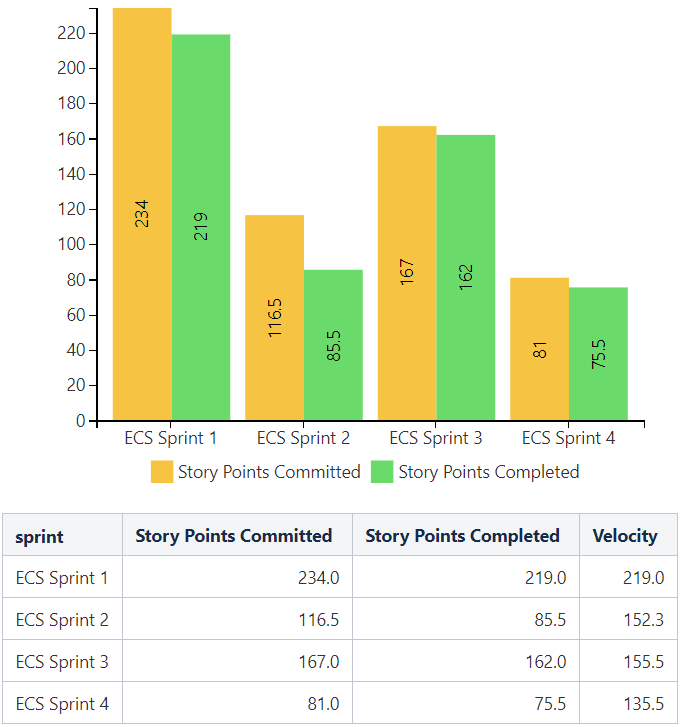
Page: Calculating Velocity
|
|
PNG File story points_3.png |
25 kB |
Natalie Paramonova |
Jun 25, 2019 08:13 |
Jun 25, 2019 08:13 |
|
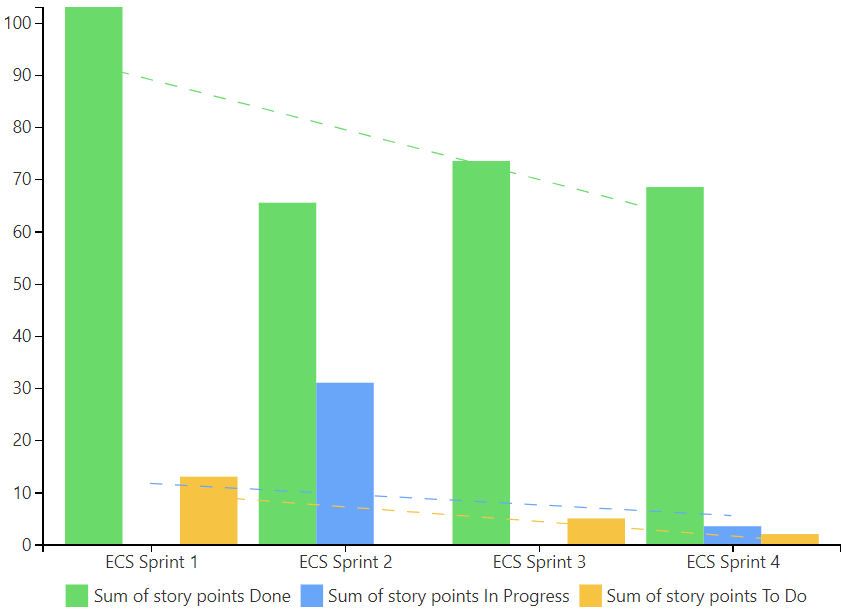
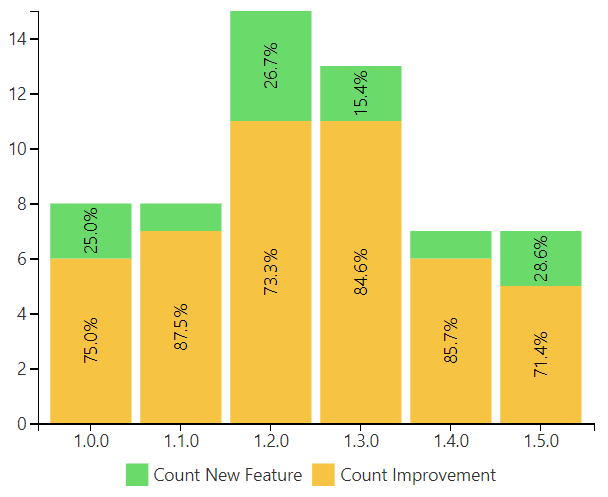
Page: Visualizing Story Points Performance
|
|
PNG File created-resolved_2.png |
29 kB |
Natalie Paramonova |
Jun 25, 2019 08:12 |
Jun 25, 2019 08:12 |
|
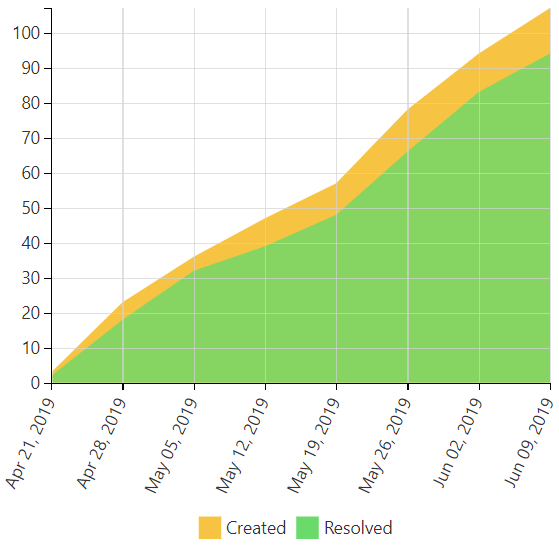
Page: Comparison of Graphs of Open and Resolved Tasks
|
|
PNG File release distribution_2.png |
15 kB |
Natalie Paramonova |
Jun 25, 2019 08:11 |
Jun 25, 2019 08:11 |
|
Page: Visualizing the Issues Distribution by Sprints or Releases
|
|
PNG File project time_1.png |
22 kB |
Natalie Paramonova |
Jun 25, 2019 08:11 |
Jun 25, 2019 08:11 |
|
Page: Visualizing of the Amount of Planned and Spent Time Within the Project
|
|
PNG File velocity_4.png |
53 kB |
Natalie Paramonova |
Jun 25, 2019 07:18 |
Jun 25, 2019 07:18 |
|
Page: Creating a Dashboard Based on One Table
|
|
PNG File teams performance_4.png |
94 kB |
Natalie Paramonova |
Jun 25, 2019 07:18 |
Jun 25, 2019 07:18 |
|
Page: Creating a Dashboard Based on One Table
|
|
PNG File velocity_6.png |
51 kB |
Natalie Paramonova |
Jun 25, 2019 07:18 |
Jun 25, 2019 07:18 |
|
Page: Creating a Dashboard Based on One Table
|
|
PNG File story points_5.png |
46 kB |
Natalie Paramonova |
Jun 25, 2019 07:18 |
Jun 25, 2019 07:18 |
|
Page: Creating a Dashboard Based on One Table
|
|
PNG File story points_2.png |
45 kB |
Natalie Paramonova |
Jun 25, 2019 07:18 |
Jun 25, 2019 07:18 |
|
Page: Creating a Dashboard Based on One Table
|
|
PNG File velocity_5.png |
56 kB |
Natalie Paramonova |
Jun 25, 2019 07:18 |
Jun 25, 2019 07:18 |
|
Page: Creating a Dashboard Based on One Table
|
|
PNG File velocity_3.png |
75 kB |
Natalie Paramonova |
Jun 25, 2019 07:18 |
Jun 25, 2019 07:18 |
|
Page: Creating a Dashboard Based on One Table
|
|
PNG File velocity_7.png |
39 kB |
Natalie Paramonova |
Jun 25, 2019 07:18 |
Jun 25, 2019 07:18 |
|
Page: Creating a Dashboard Based on One Table
|
|
PNG File aligning.png |
68 kB |
Natalie Paramonova |
Jun 25, 2019 07:18 |
Jun 25, 2019 07:18 |
|
Page: Creating a Dashboard Based on One Table
|