| Name
|
Size
|
Creator |
Creation Date
|
Last Modification Date
|
Labels |
Attached To |
|
PNG File teams performance_2.png |
20 kB |
Natalie Paramonova |
Jun 25, 2019 07:16 |
Jun 25, 2019 07:16 |
|
Page: Building a Gantt Chart
|
|
PNG File teams performance_2.png |
20 kB |
Natalie Paramonova |
Jun 25, 2019 07:13 |
Jun 25, 2019 07:13 |
|
Page: Building a Burnup Chart
|
|
PNG File teams performance_2.png |
20 kB |
Natalie Paramonova |
Jun 24, 2019 15:16 |
Jun 24, 2019 15:16 |
|
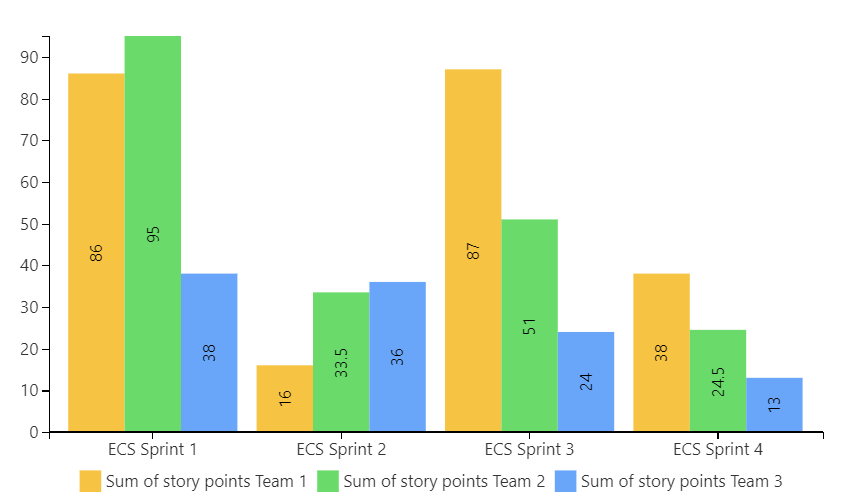
Page: Visualizing Story Points Performance
|
|
PNG File image2015-10-28 12:50:2.png |
20 kB |
Vadim Rutkevich |
Oct 28, 2015 09:50 |
Oct 28, 2015 09:50 |
|
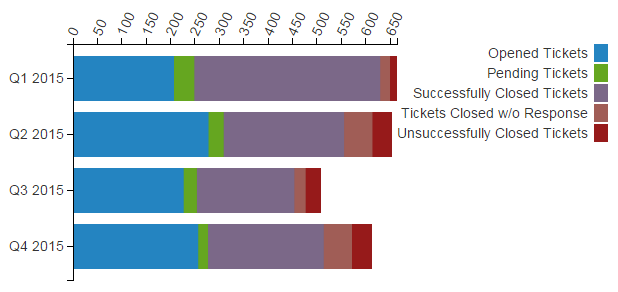
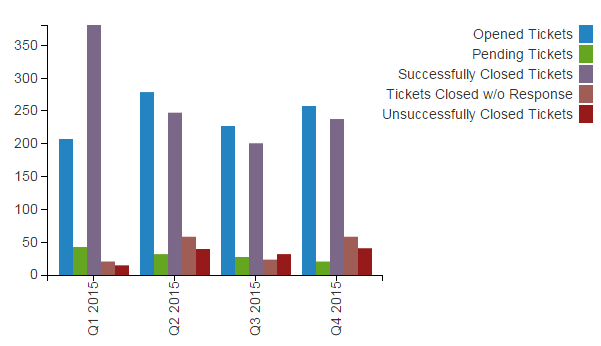
Page: How to use Chart from Table macro
|
|
PNG File image2016-2-22 13:52:37.png |
20 kB |
Vadim Rutkevich |
Feb 22, 2016 10:52 |
Feb 22, 2016 10:52 |
|
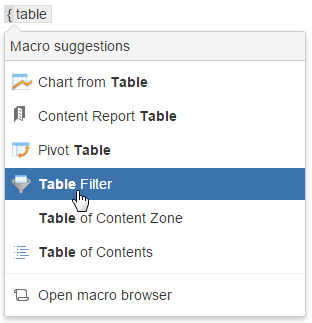
Page: How to use Table filter macro
|
|
PNG File image2015-10-28 17:59:7.png |
20 kB |
Vadim Rutkevich |
Oct 28, 2015 14:59 |
Oct 28, 2015 14:59 |
|
Page: How to use Chart from Table macro
|
|
PNG File image2015-10-28 17:59:45.png |
19 kB |
Vadim Rutkevich |
Oct 28, 2015 14:59 |
Oct 28, 2015 14:59 |
|
Page: How to use Chart from Table macro
|
|
PNG File release distribution_2.png |
17 kB |
Natalie Paramonova |
Jun 25, 2019 07:16 |
Jun 25, 2019 07:16 |
|
Page: Building a Gantt Chart
|
|
PNG File release distribution_2.png |
17 kB |
Natalie Paramonova |
Jun 24, 2019 15:16 |
Jun 24, 2019 15:16 |
|
Page: Visualizing Story Points Performance
|
|
PNG File release distribution_2.png |
17 kB |
Natalie Paramonova |
Jul 05, 2019 09:28 |
Jul 05, 2019 09:28 |
|
Page: Building a Burndown Chart
|
|
PNG File release distribution_2.png |
17 kB |
Natalie Paramonova |
Jun 24, 2019 15:23 |
Jun 24, 2019 15:23 |
|
Page: Calculating Velocity
|
|
PNG File release distribution_2.png |
17 kB |
Natalie Paramonova |
Jun 24, 2019 15:10 |
Jun 24, 2019 15:10 |
|
Page: Comparison of Graphs of Open and Resolved Tasks
|
|
PNG File release distribution_2.png |
17 kB |
Natalie Paramonova |
Jun 24, 2019 15:00 |
Jun 24, 2019 15:00 |
|
Page: Evaluating Calculated Planned and Spent Time Per Assignee
|
|
PNG File release distribution_2.png |
17 kB |
Natalie Paramonova |
Jun 24, 2019 15:03 |
Jun 24, 2019 15:03 |
|
Page: Visualizing of the Amount of Planned and Spent Time Within the Project
|
|
PNG File release distribution_2.png |
17 kB |
Natalie Paramonova |
Jun 25, 2019 07:18 |
Jun 25, 2019 07:18 |
|
Page: Creating a Dashboard Based on One Table
|
|
PNG File release distribution_2.png |
17 kB |
Natalie Paramonova |
Jun 25, 2019 07:11 |
Jun 25, 2019 07:11 |
|
Page: Visualizing of Completed Story Points by Teams
|
|
PNG File release distribution_2.png |
17 kB |
Natalie Paramonova |
Jun 25, 2019 07:13 |
Jun 25, 2019 07:13 |
|
Page: Building a Burnup Chart
|
|
PNG File release distribution_2.png |
17 kB |
Natalie Paramonova |
Jun 24, 2019 14:57 |
Jun 24, 2019 14:57 |
|
Page: Aggregating Issues by Assignee
|
|
PNG File release distribution_2.png |
17 kB |
Natalie Paramonova |
Jun 24, 2019 13:38 |
Jun 24, 2019 13:38 |
|
Page: Using Table Filter and Charts in Combination with the Jira Issues Macro
|
|
PNG File image2015-10-12 15:5:12.png |
17 kB |
Vadim Rutkevich |
Oct 16, 2015 14:35 |
Oct 16, 2015 14:44 |
|
Page: Filtering tables generated by other add-ons and macros
|