| Name
|
Size
|
Creator |
Creation Date
|
Last Modification Date
|
Labels |
Attached To |
|
PNG File image2016-9-10 9:42:49.png |
95 kB |
Vadim Rutkevich |
Sep 10, 2016 06:42 |
Sep 10, 2016 06:42 |
|
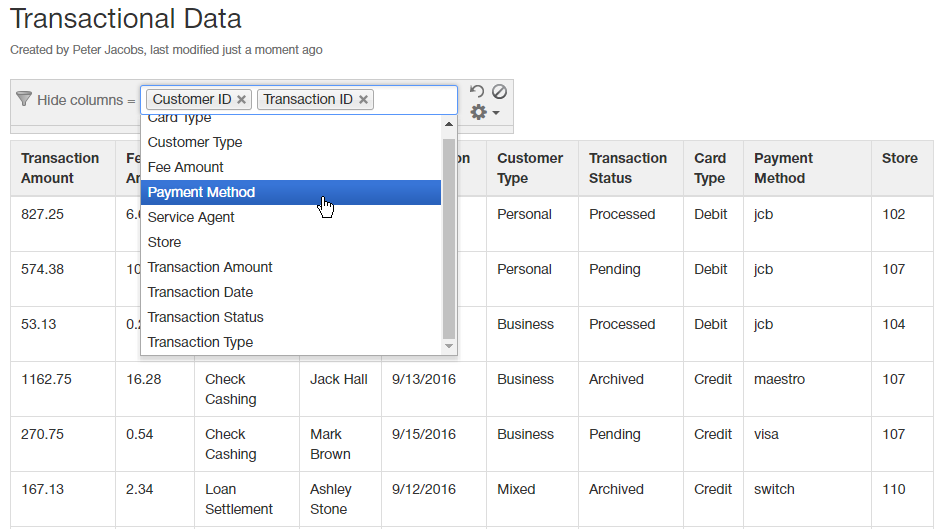
Page: Managing Filters in the Page View Mode
|
|
PNG File image2016-9-10 12:13:24.png |
95 kB |
Vadim Rutkevich |
Sep 10, 2016 09:13 |
Sep 10, 2016 09:13 |
|
Page: Managing Filtration Parameters
|
|
PNG File image2015-7-2 7:4:22.png |
95 kB |
Vadim Rutkevich |
Jul 02, 2015 04:04 |
Jul 02, 2015 04:04 |
|
Page: How to work with multiple macros at once
|
|
PNG File image2015-7-2 7:5:30.png |
95 kB |
Vadim Rutkevich |
Jul 02, 2015 04:05 |
Jul 02, 2015 04:05 |
|
Page: How to work with multiple macros at once
|
|
PNG File velocity2_1.png |
95 kB |
Natalie Paramonova |
Jul 16, 2019 09:31 |
Jul 16, 2019 09:31 |
|
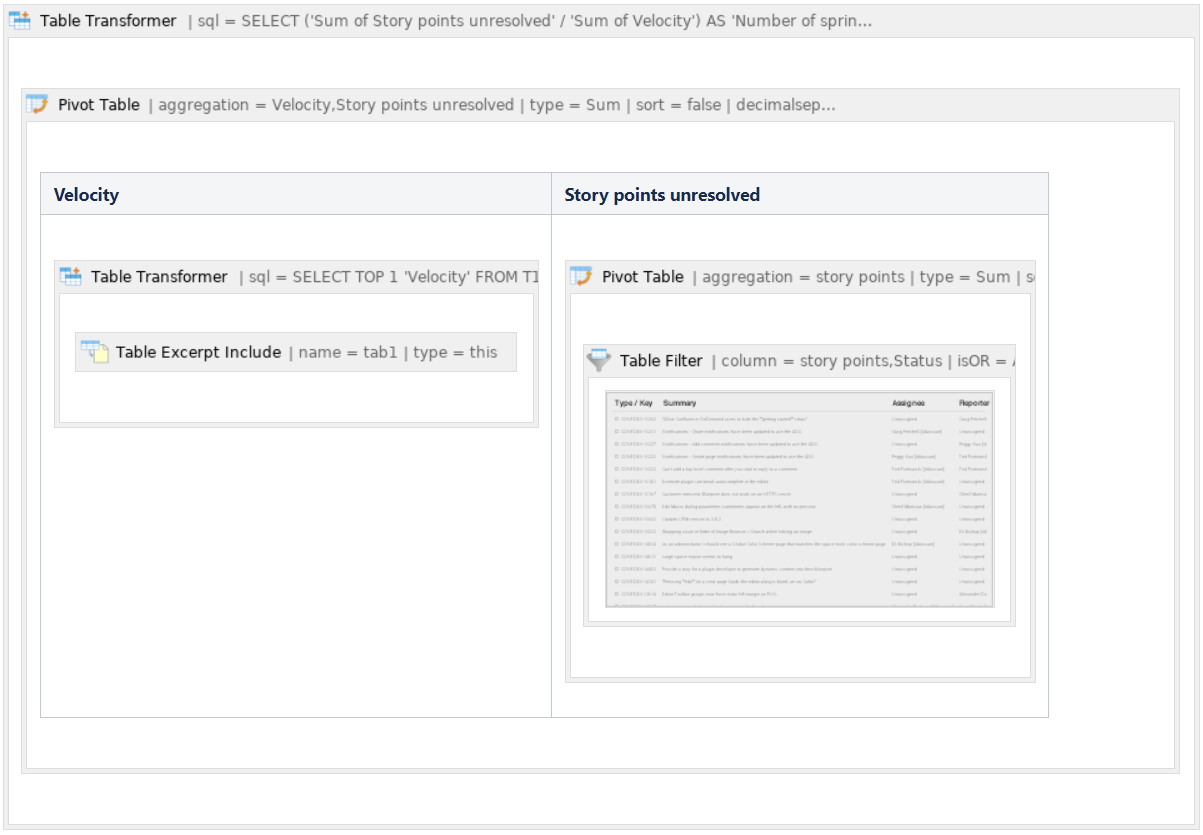
Page: Calculating Velocity
|
|
PNG File image2017-4-26 11:12:47.png |
95 kB |
Vadim Rutkevich |
Oct 02, 2017 07:39 |
Oct 02, 2017 07:39 |
|
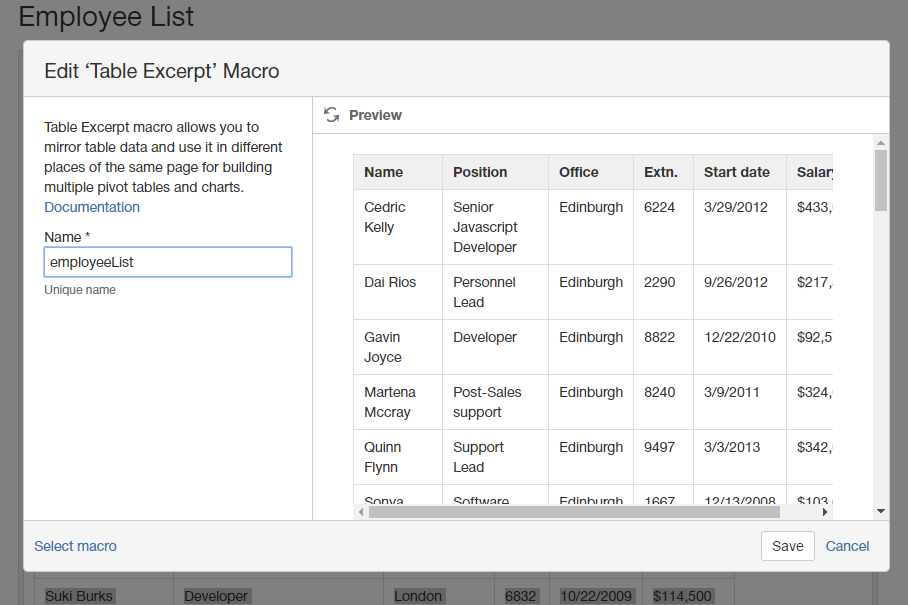
Page: How to use Table Excerpt and Table Excerpt Include macros
|
|
PNG File image2016-9-21 9:9:15.png |
94 kB |
Vadim Rutkevich |
Sep 21, 2016 06:09 |
Sep 21, 2016 06:09 |
|
Page: Managing Look of the Table and Filtration Pane
|
|
PNG File teams performance_4.png |
94 kB |
Natalie Paramonova |
Jun 25, 2019 07:18 |
Jun 25, 2019 07:18 |
|
Page: Creating a Dashboard Based on One Table
|
|
PNG File teams performance_4.png |
94 kB |
Natalie Paramonova |
Jul 05, 2019 09:28 |
Jul 05, 2019 09:28 |
|
Page: Building a Burndown Chart
|
|
PNG File teams performance_4.png |
94 kB |
Natalie Paramonova |
Jun 24, 2019 15:16 |
Jun 24, 2019 15:16 |
|
Page: Visualizing Story Points Performance
|
|
PNG File teams performance_4.png |
94 kB |
Natalie Paramonova |
Jun 24, 2019 15:06 |
Jun 24, 2019 15:06 |
|
Page: Visualizing the Issues Distribution by Sprints or Releases
|
|
PNG File teams performance_4.png |
94 kB |
Natalie Paramonova |
Jun 24, 2019 15:10 |
Jun 24, 2019 15:10 |
|
Page: Comparison of Graphs of Open and Resolved Tasks
|
|
PNG File teams performance_4.png |
94 kB |
Natalie Paramonova |
Jun 24, 2019 15:00 |
Jun 24, 2019 15:00 |
|
Page: Evaluating Calculated Planned and Spent Time Per Assignee
|
|
PNG File teams performance_4.png |
94 kB |
Natalie Paramonova |
Jun 24, 2019 14:57 |
Jun 24, 2019 14:57 |
|
Page: Aggregating Issues by Assignee
|
|
PNG File teams performance_4.png |
94 kB |
Natalie Paramonova |
Jun 24, 2019 15:03 |
Jun 24, 2019 15:03 |
|
Page: Visualizing of the Amount of Planned and Spent Time Within the Project
|
|
PNG File teams performance_4.png |
94 kB |
Natalie Paramonova |
Jun 25, 2019 07:13 |
Jun 25, 2019 07:13 |
|
Page: Building a Burnup Chart
|
|
PNG File teams performance_4.png |
94 kB |
Natalie Paramonova |
Jun 24, 2019 15:23 |
Jun 24, 2019 15:23 |
|
Page: Calculating Velocity
|
|
PNG File teams performance_4.png |
94 kB |
Natalie Paramonova |
Jun 25, 2019 07:16 |
Jun 25, 2019 07:16 |
|
Page: Building a Gantt Chart
|
|
PNG File teams performance_4.png |
94 kB |
Natalie Paramonova |
Jun 25, 2019 07:11 |
Jun 25, 2019 07:11 |
|
Page: Visualizing of Completed Story Points by Teams
|
|
PNG File teams performance_4.png |
94 kB |
Natalie Paramonova |
Jun 24, 2019 09:06 |
Jun 24, 2019 09:06 |
|
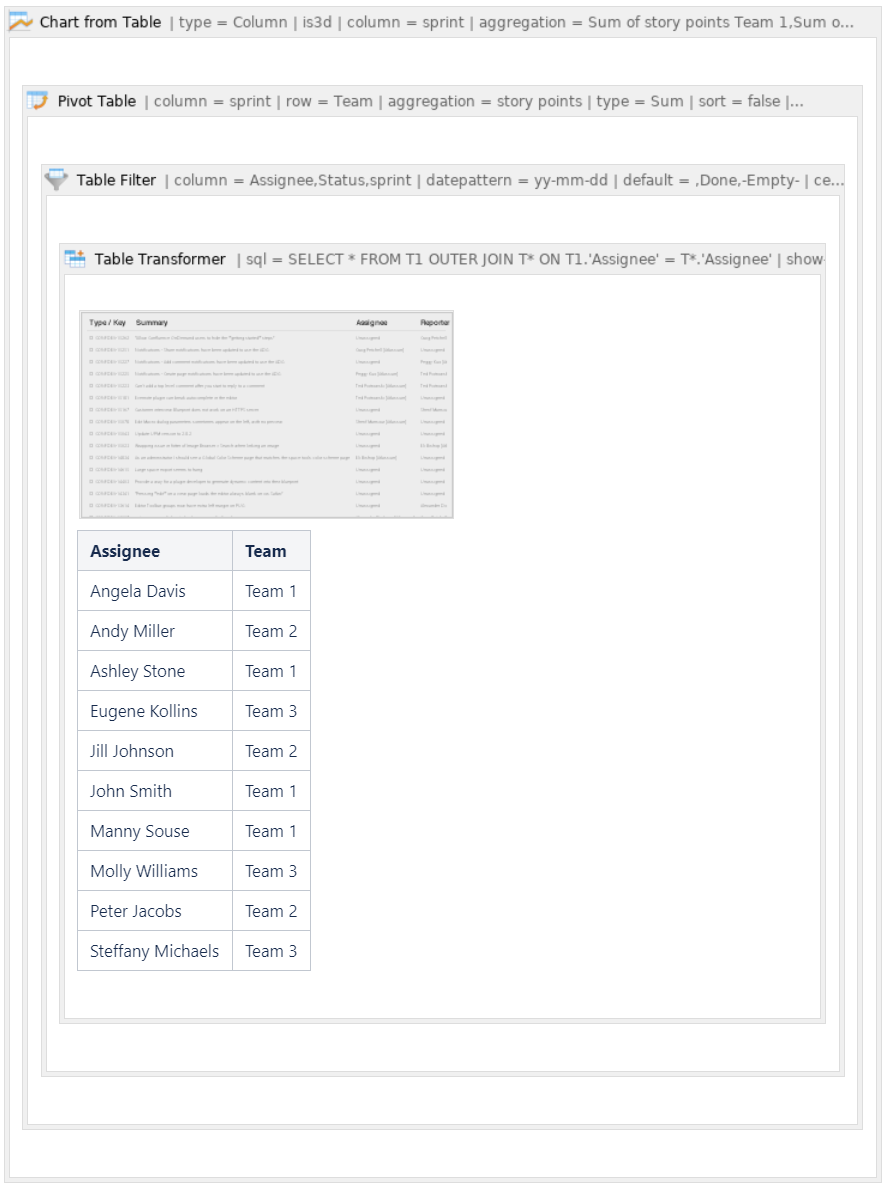
Page: Using Table Filter and Charts in Combination with the Jira Issues Macro
|