Use the following options for better viewing of a dashboard
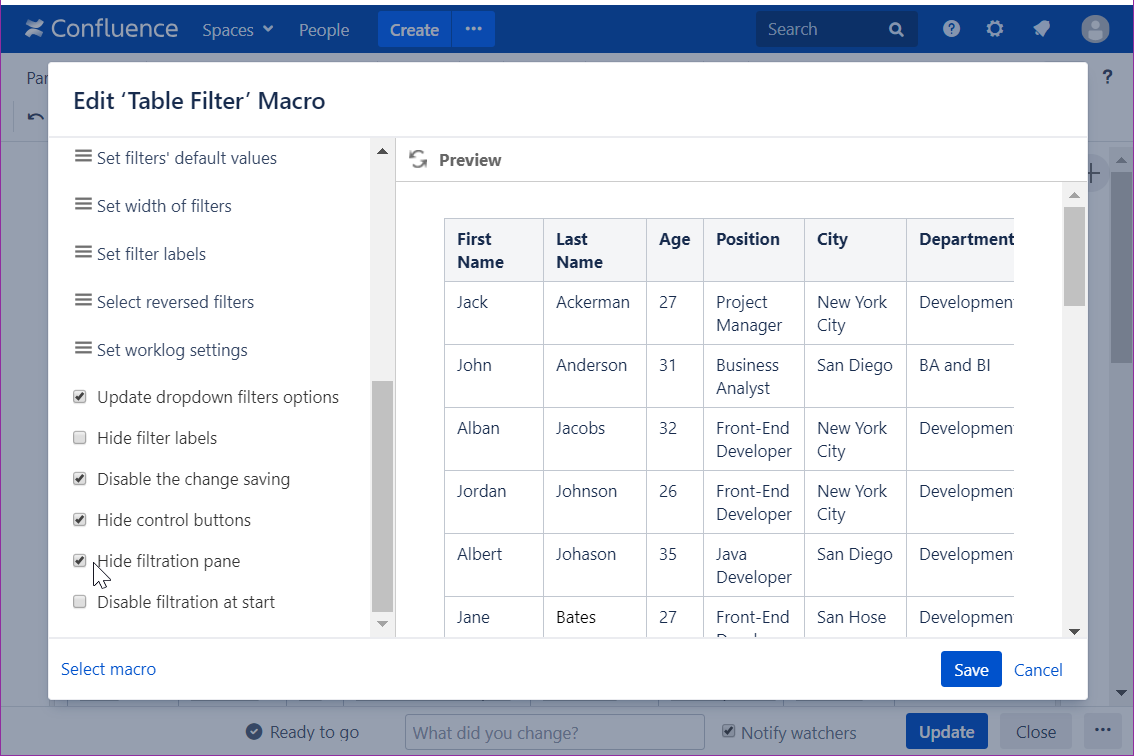
Hide filtration panel (Tabel Filter)
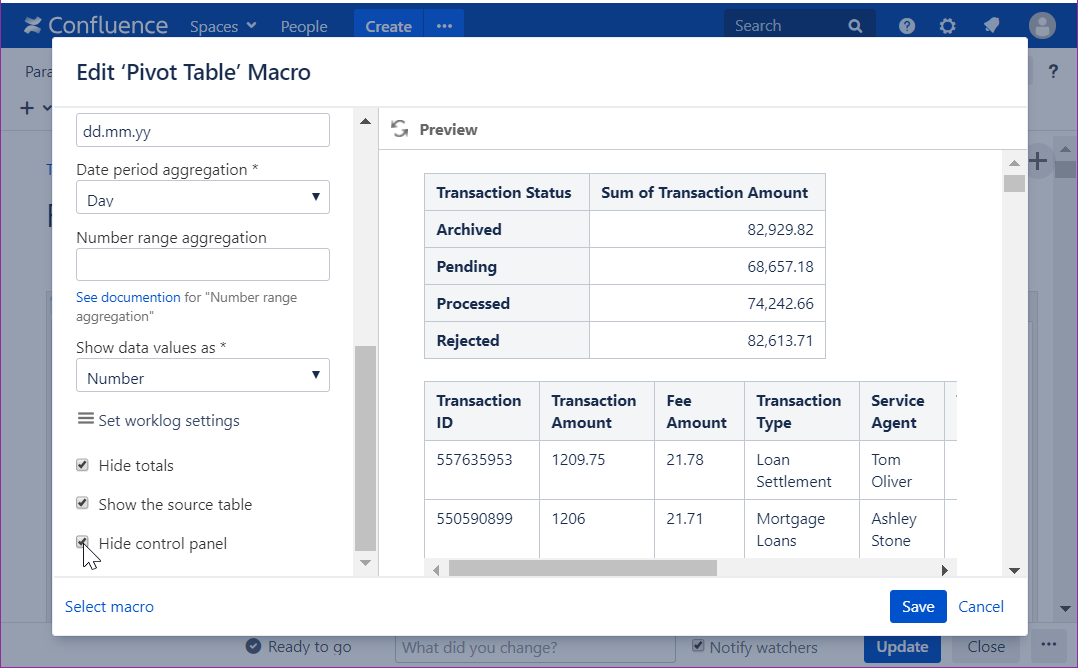
Hide control panel (Pivot Table)
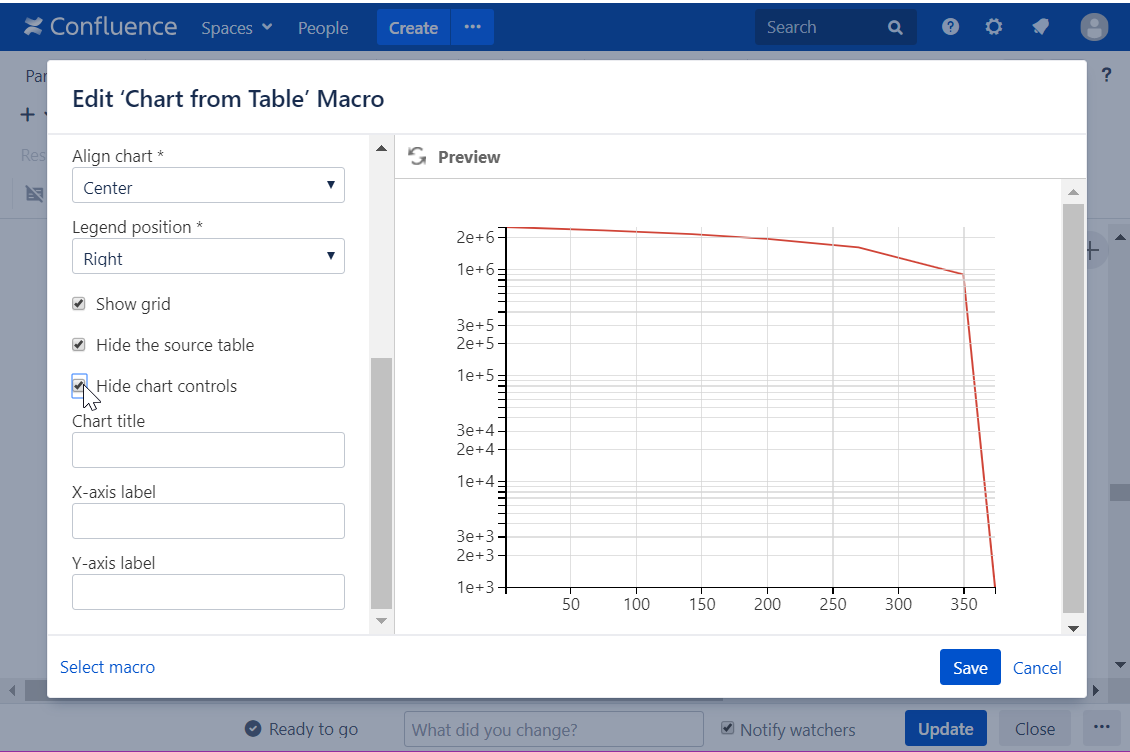
Hide chart controls (Chart from Table)
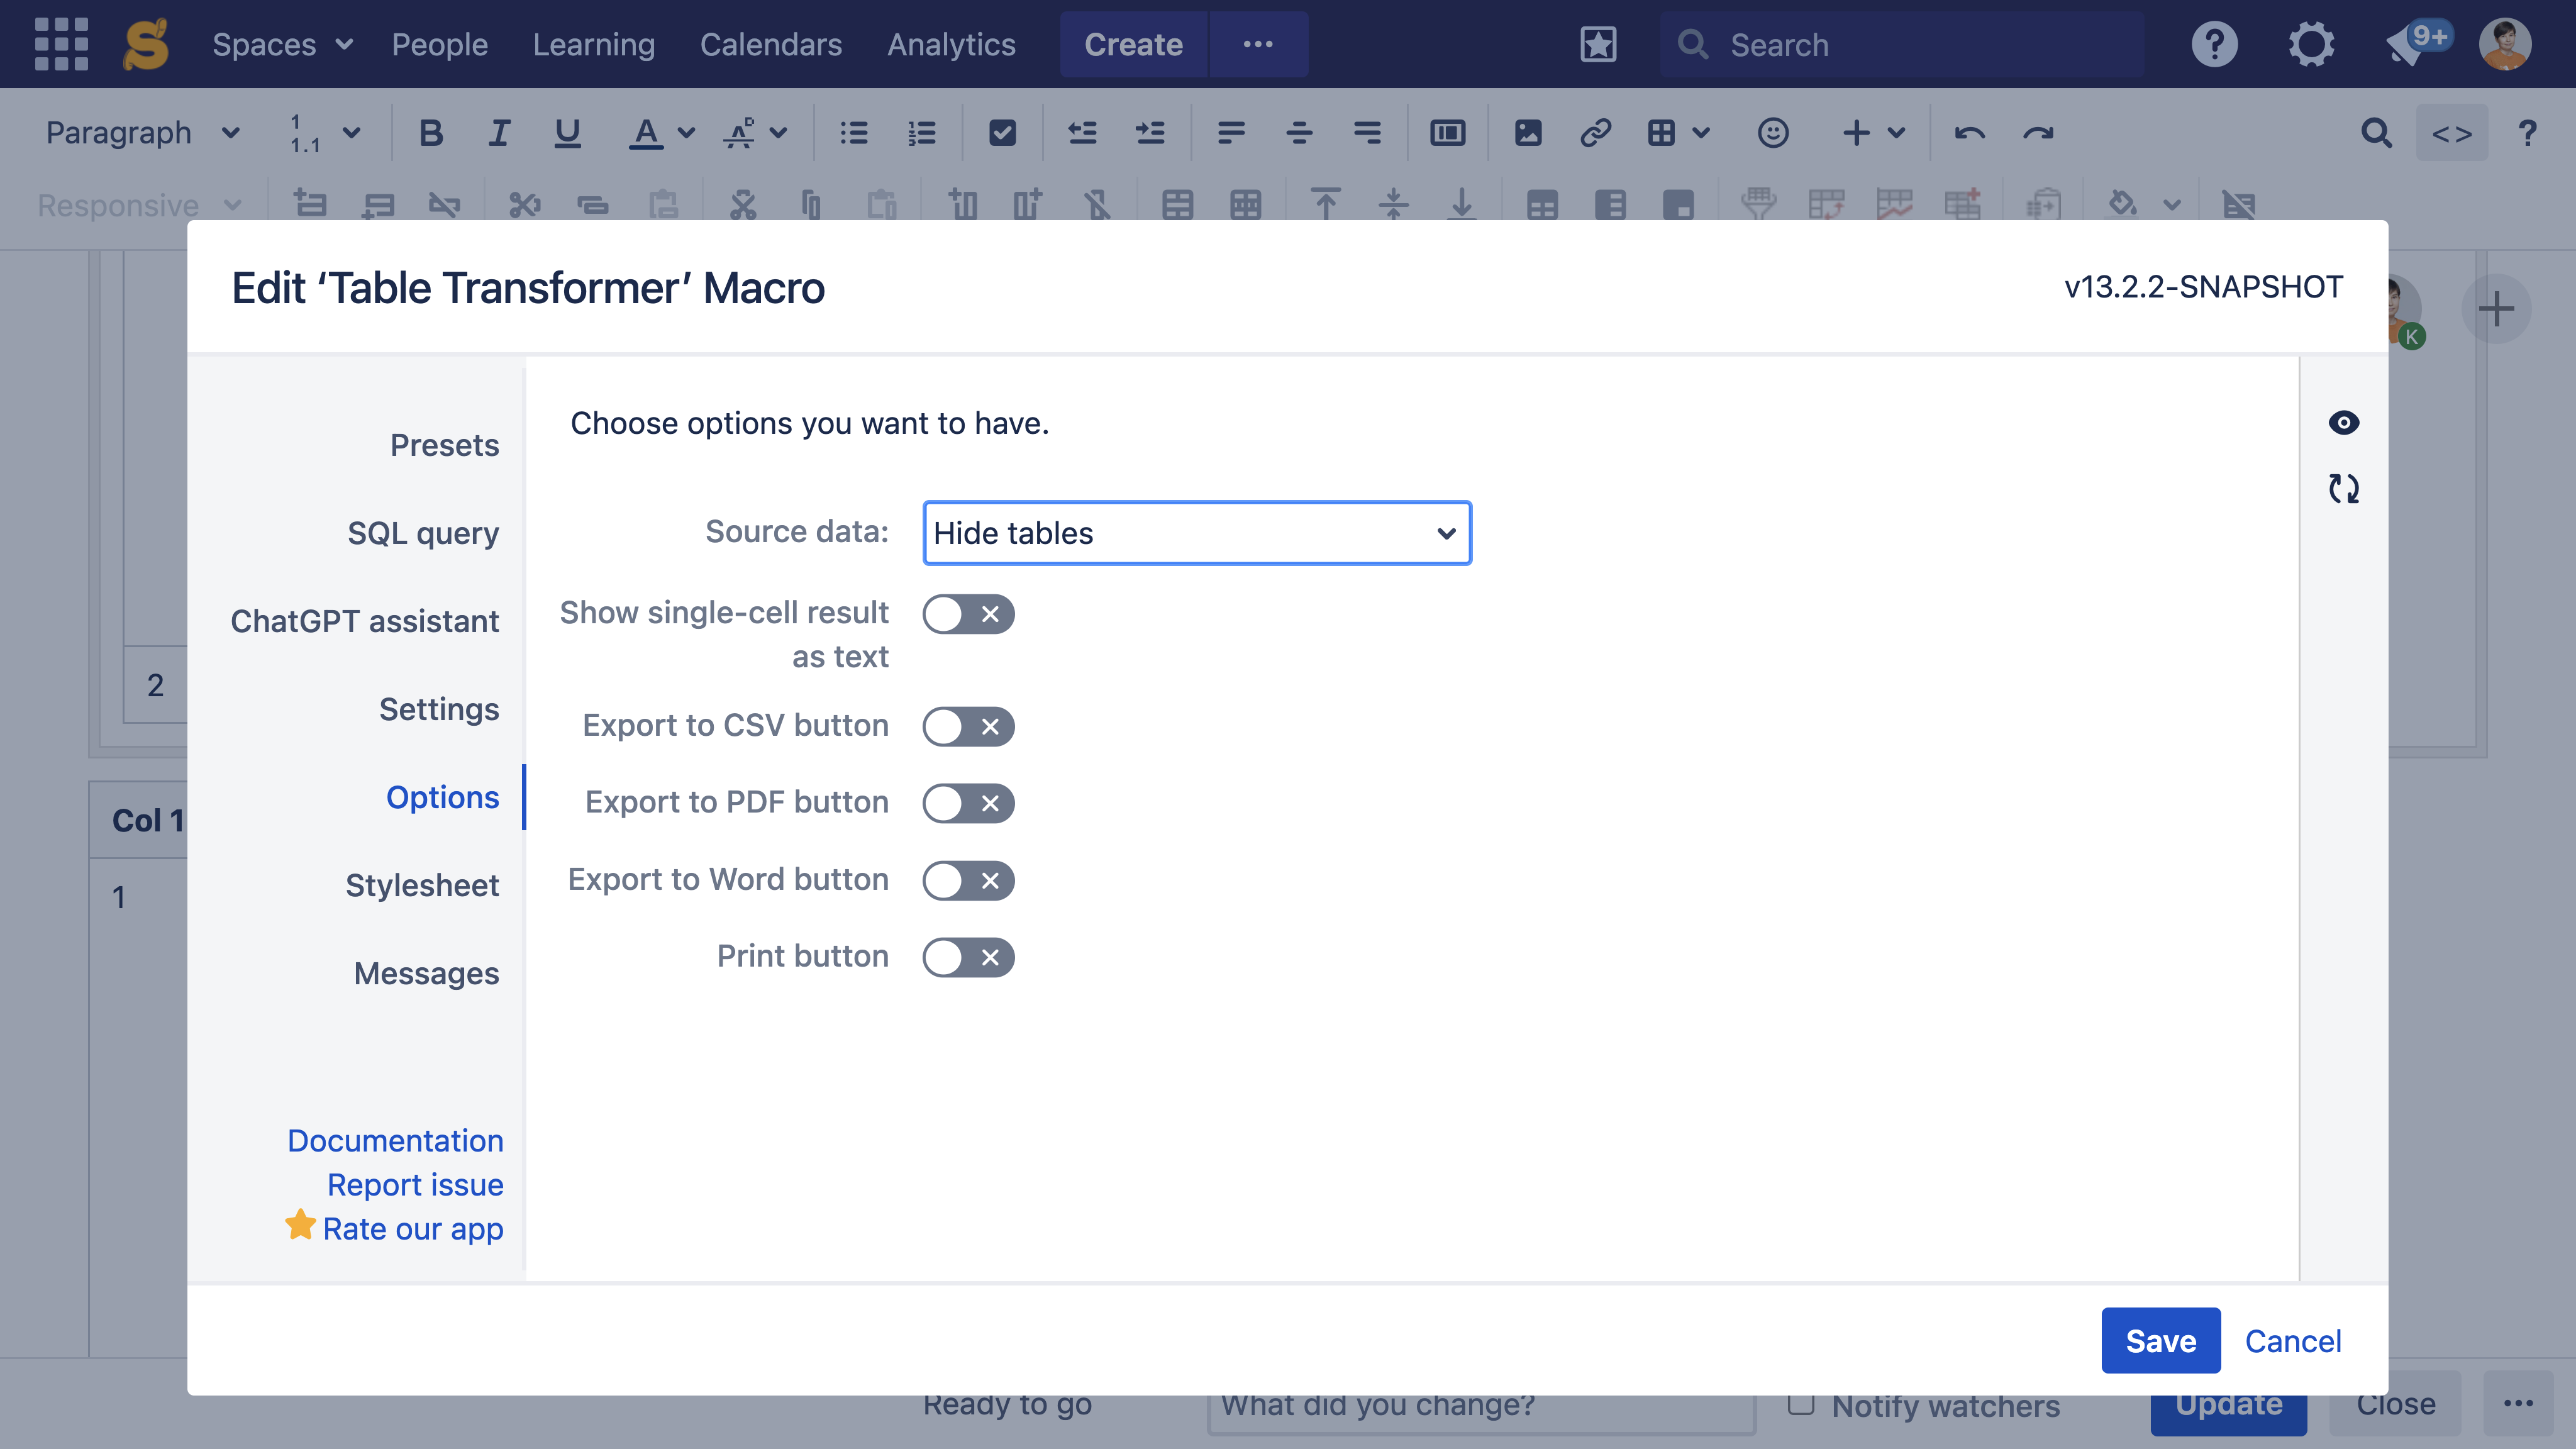
Hide source tables or Hide all content (in Pivot Table, Chart from Table, Table Transformer). The Hide all content option hides the unnecessary information about the number of issues coming from the Jira Issues macro
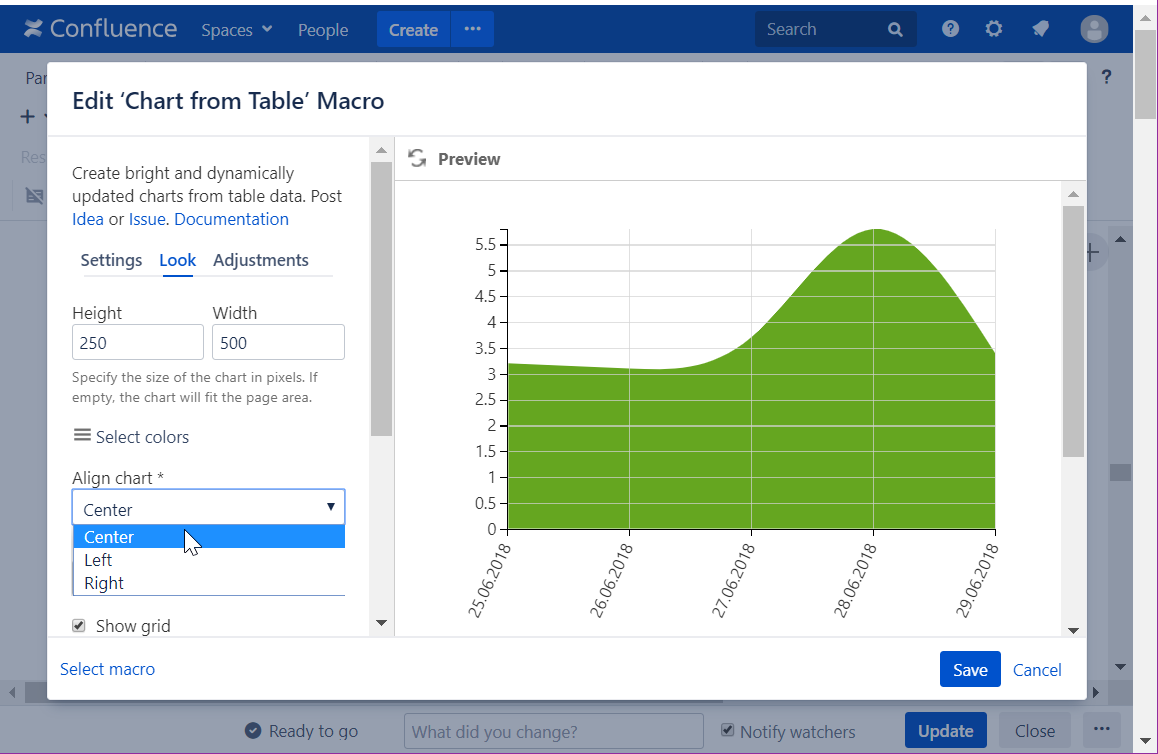
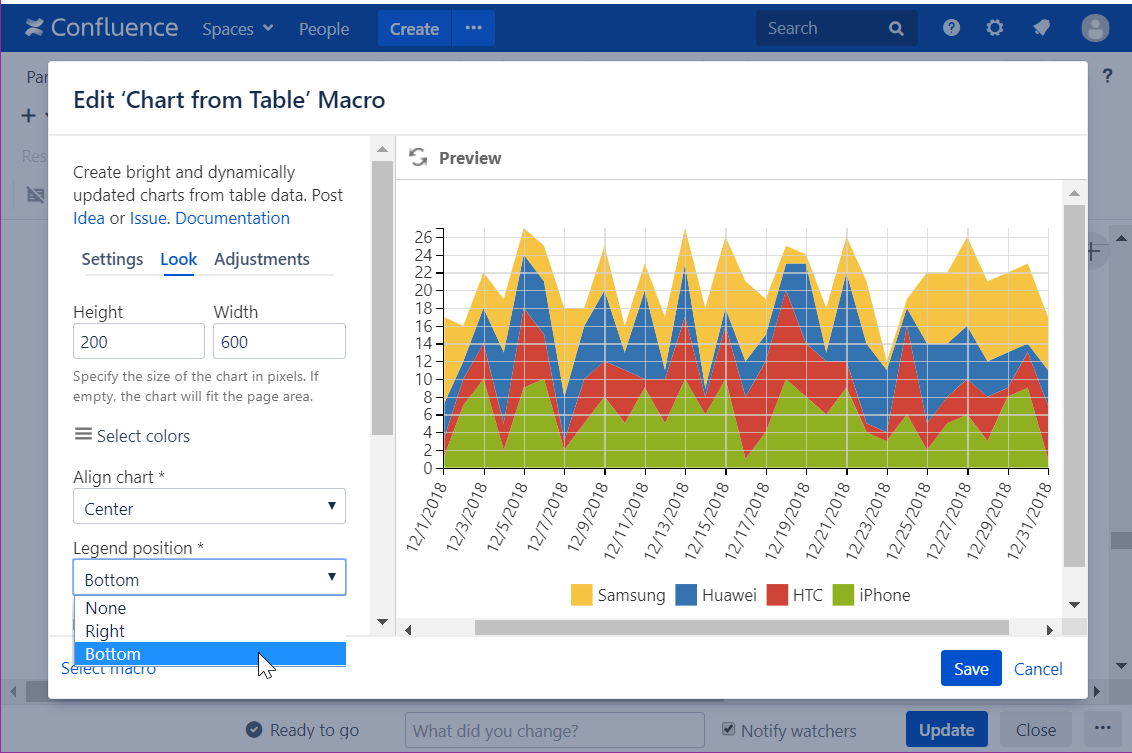
Set chart dimensions
Align a chart
Chart legend position
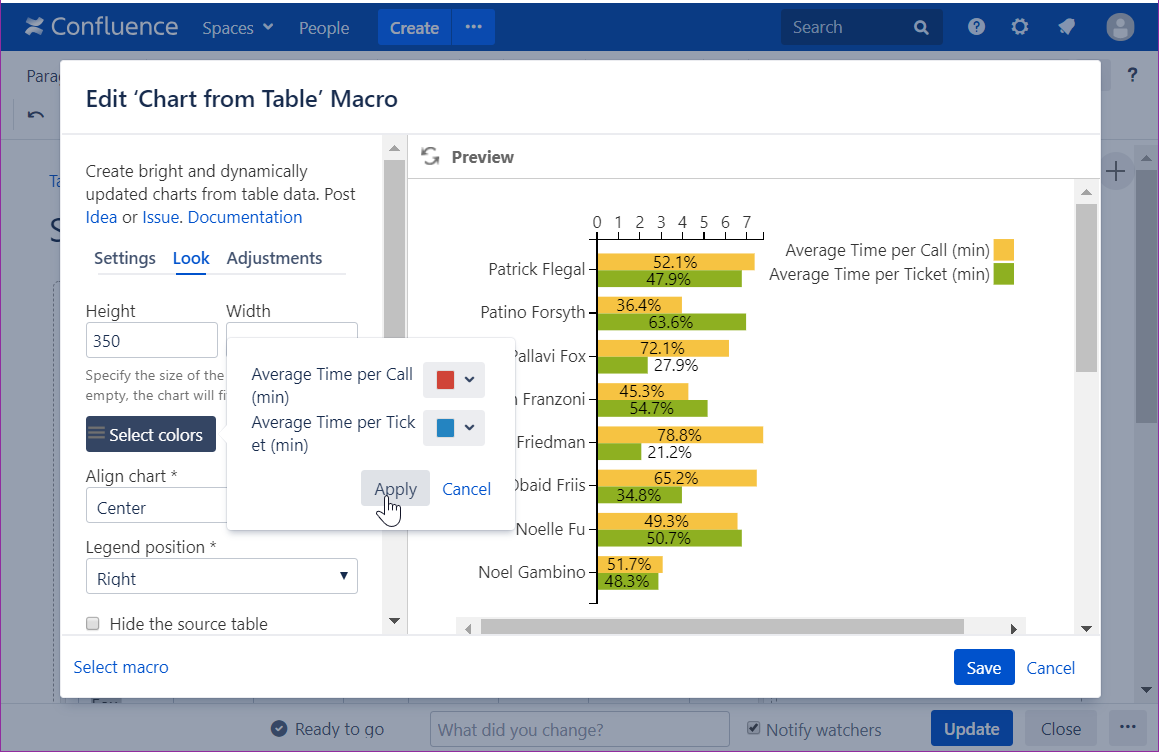
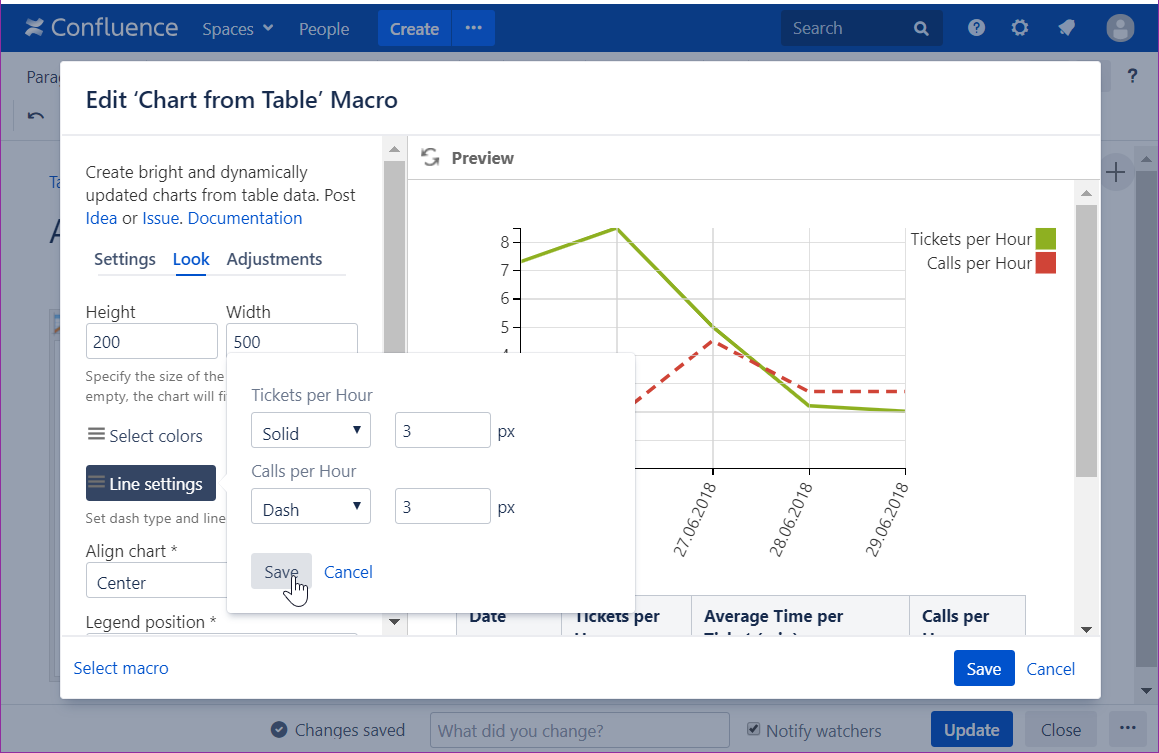
Set colors and line settings
On Data Center, the unwanted issue counter generated by the Jira Issues macro can be also removed by creating a user macro: