| Name
|
Size
|
Creator |
Creation Date
|
Last Modification Date
|
Labels |
Attached To |
|
PNG File teams performance_5.png |
66 kB |
Natalie Paramonova |
Oct 28, 2019 14:16 |
Oct 28, 2019 14:16 |
|
Page: Visualizing the Issues Distribution by Sprints or Releases
|
|
PNG File teams performance_5.png |
66 kB |
Natalie Paramonova |
Oct 28, 2019 14:16 |
Oct 28, 2019 14:16 |
|
Page: Visualizing of the Amount of Planned and Spent Time Within the Project
|
|
PNG File teams performance_5.png |
66 kB |
Natalie Paramonova |
Oct 28, 2019 14:16 |
Oct 28, 2019 14:16 |
|
Page: Visualizing of Completed Story Points by Teams
|
|
PNG File teams performance_5.png |
66 kB |
Natalie Paramonova |
Oct 28, 2019 14:16 |
Oct 28, 2019 14:16 |
|
Page: Visualizing Story Points Performance
|
|
PNG File teams performance_5.png |
66 kB |
Natalie Paramonova |
Oct 28, 2019 14:16 |
Oct 28, 2019 14:16 |
|
Page: Calculating Velocity
|
|
PNG File teams performance_5.png |
66 kB |
Natalie Paramonova |
Oct 28, 2019 14:16 |
Oct 28, 2019 14:16 |
|
Page: Building a Burndown Chart
|
|
PNG File teams performance_5.png |
66 kB |
Natalie Paramonova |
Oct 28, 2019 14:16 |
Oct 28, 2019 14:16 |
|
Page: Building a Burnup Chart
|
|
PNG File teams performance_5.png |
66 kB |
Natalie Paramonova |
Oct 28, 2019 14:16 |
Oct 28, 2019 14:16 |
|
Page: Building a Gantt Chart
|
|
PNG File teams performance_5.png |
66 kB |
Natalie Paramonova |
Oct 28, 2019 14:16 |
Oct 28, 2019 14:16 |
|
Page: Creating a Dashboard Based on One Table
|
|
PNG File teams performance_5.png |
66 kB |
Natalie Paramonova |
Oct 28, 2019 14:16 |
Oct 28, 2019 14:16 |
|
Page: Comparison of Graphs of Open and Resolved Tasks
|
|
PNG File image2022-8-4_15-40-53.png |
66 kB |
Nikita Kamai |
Jan 12, 2023 11:12 |
Jan 12, 2023 11:12 |
|
Page: .Table filtration vDraft
|
|
PNG File image2022-8-4_15-40-53.png |
66 kB |
Nikita Kamai |
Aug 04, 2022 12:40 |
Aug 04, 2022 12:40 |
|
Page: Table filtration
|
|
PNG File chart type edit.png |
66 kB |
Nikita Kamai |
Jan 12, 2023 11:30 |
Jan 12, 2023 11:30 |
|
Page: .Bubble Pie chart type vDraft
|
|
PNG File chart type edit.png |
66 kB |
Natalie Paramonova |
Sep 23, 2019 10:05 |
Sep 23, 2019 10:05 |
|
Page: Bubble Pie chart type
|
|
PNG File show data labels.png |
66 kB |
Nikita Kamai |
Jan 12, 2023 11:31 |
Jan 12, 2023 11:31 |
|
Page: .Column, Stacked Column, Bar, Stacked Bar chart types vDraft
|
|
PNG File show data labels.png |
66 kB |
Natalie Paramonova |
Aug 02, 2019 17:10 |
Aug 02, 2019 17:10 |
|
Page: Column, Stacked Column, Bar, Stacked Bar chart types
|
|
PNG File Screenshot 05-25-2020 11.13.08.png |
66 kB |
Nikita Kamai |
Jan 12, 2023 13:30 |
Jan 12, 2023 13:30 |
|
Page: .Lines of Code by User Chart vDraft
|
|
PNG File Screenshot 05-25-2020 11.13.08.png |
66 kB |
Dmitry Trofimov |
May 25, 2020 08:15 |
May 25, 2020 08:15 |
|
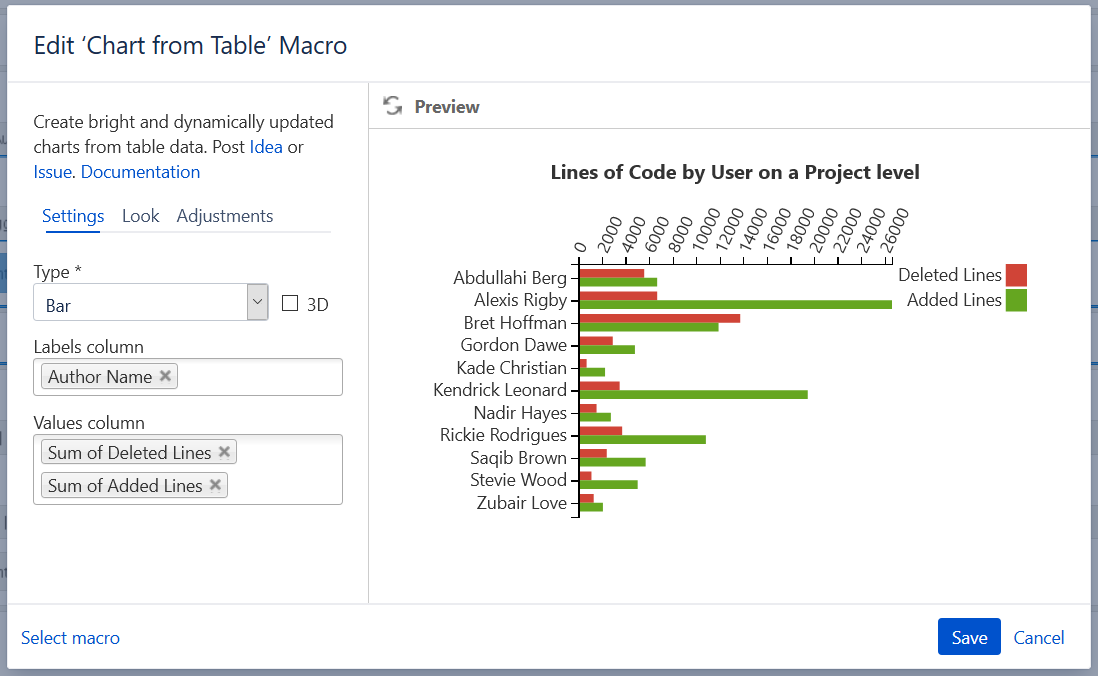
Page: Lines of Code by User Chart
|
|
PNG File 02.03.png |
66 kB |
Nikita Kamai |
Jan 12, 2023 13:31 |
Jan 12, 2023 13:31 |
|
Page: .Pull Request Activities Charts vDraft
|
|
PNG File 02.03.png |
66 kB |
Dmitry Trofimov |
May 25, 2020 08:34 |
May 25, 2020 08:34 |
|
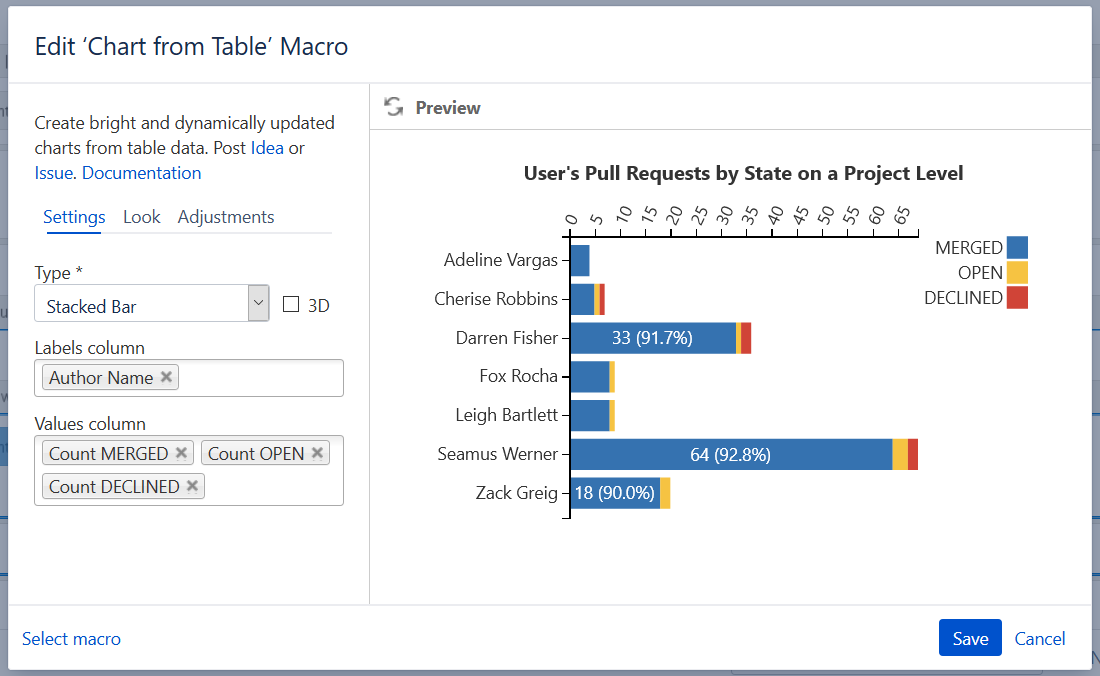
Page: Pull Request Activities Charts
|