| Name
|
Size
|
Creator |
Creation Date
|
Last Modification Date
|
Labels |
Attached To |
|
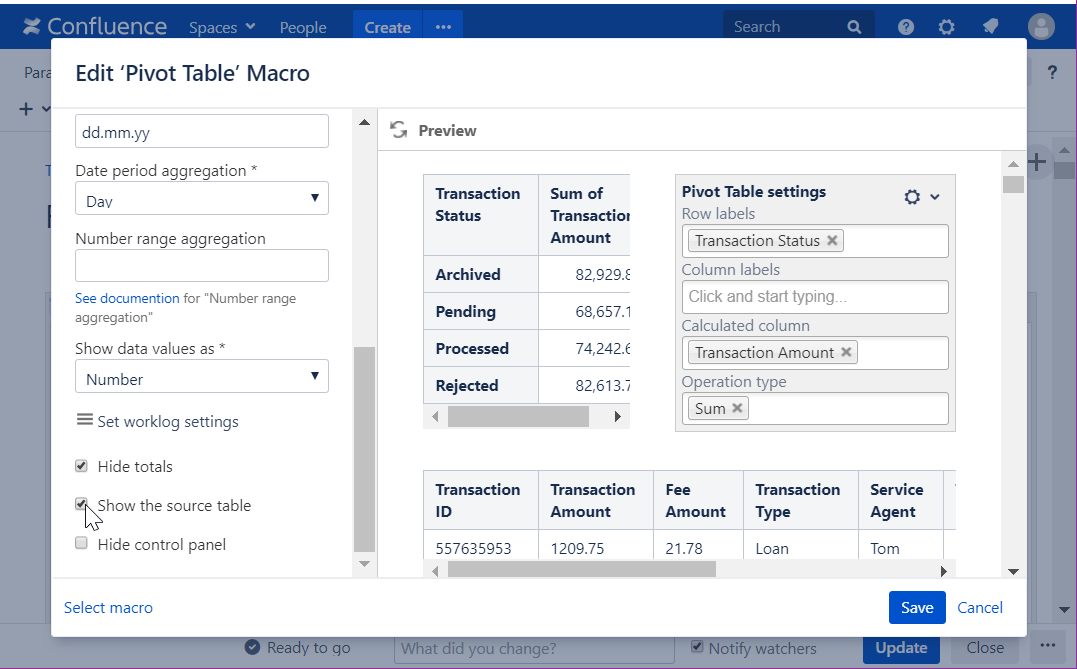
PNG File show source table edit.png |
69 kB |
Natalie Paramonova |
Jun 24, 2019 15:23 |
Jun 24, 2019 15:23 |
|
Page: Calculating Velocity
|
|
PNG File show source table edit.png |
69 kB |
Natalie Paramonova |
Jun 24, 2019 15:06 |
Jun 24, 2019 15:06 |
|
Page: Visualizing the Issues Distribution by Sprints or Releases
|
|
PNG File show source table edit.png |
69 kB |
Natalie Paramonova |
Jun 24, 2019 15:00 |
Jun 24, 2019 15:00 |
|
Page: Evaluating Calculated Planned and Spent Time Per Assignee
|
|
PNG File show source table edit.png |
69 kB |
Natalie Paramonova |
Jun 24, 2019 15:03 |
Jun 24, 2019 15:03 |
|
Page: Visualizing of the Amount of Planned and Spent Time Within the Project
|
|
PNG File show source table edit.png |
69 kB |
Natalie Paramonova |
Jun 24, 2019 14:57 |
Jun 24, 2019 14:57 |
|
Page: Aggregating Issues by Assignee
|
|
PNG File show source table edit.png |
69 kB |
Natalie Paramonova |
Jun 25, 2019 07:13 |
Jun 25, 2019 07:13 |
|
Page: Building a Burnup Chart
|
|
PNG File show source table edit.png |
69 kB |
Natalie Paramonova |
Jun 25, 2019 07:16 |
Jun 25, 2019 07:16 |
|
Page: Building a Gantt Chart
|
|
PNG File show source table edit.png |
69 kB |
Natalie Paramonova |
Jun 25, 2019 07:11 |
Jun 25, 2019 07:11 |
|
Page: Visualizing of Completed Story Points by Teams
|
|
PNG File show source table edit.png |
69 kB |
Natalie Paramonova |
Jun 24, 2019 13:15 |
Jun 24, 2019 13:15 |
|
Page: Using Table Filter and Charts in Combination with the Jira Issues Macro
|
|
PNG File show source table edit.png |
69 kB |
Natalie Paramonova |
Jun 24, 2019 15:16 |
Jun 24, 2019 15:16 |
|
Page: Visualizing Story Points Performance
|
|
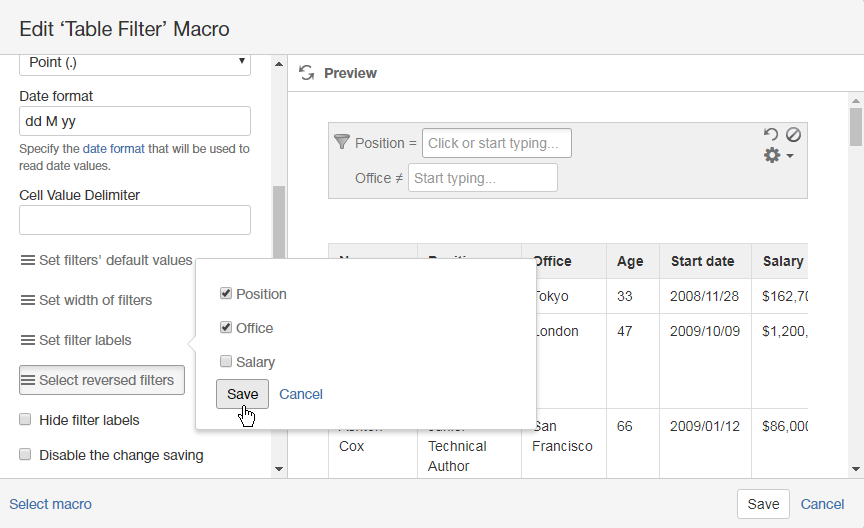
PNG File image2017-7-17_16-40-47.png |
69 kB |
Vadim Rutkevich |
Jul 17, 2017 13:40 |
Jul 17, 2017 13:40 |
|
Page: Managing Reversed Filters
|
|
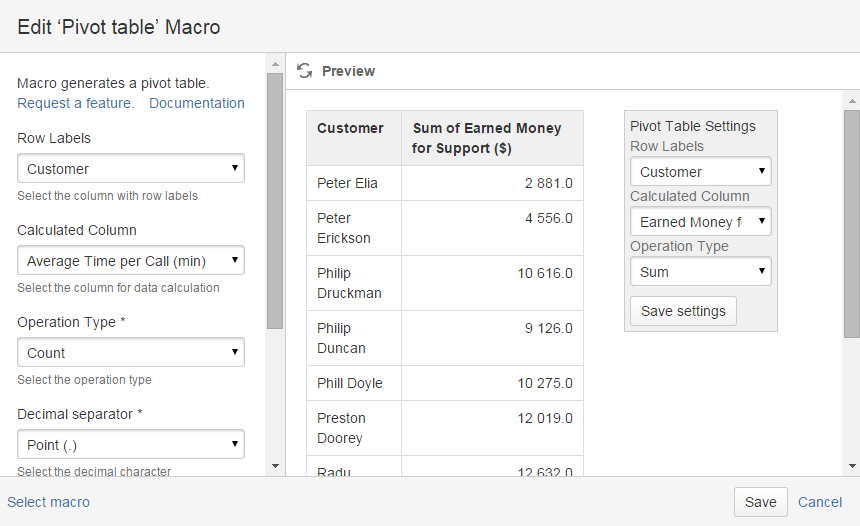
PNG File image2015-7-1 12:8:10.png |
69 kB |
Vadim Rutkevich |
Jul 01, 2015 09:08 |
Jul 01, 2015 09:08 |
|
Page: How to use Pivot table macro
|
|
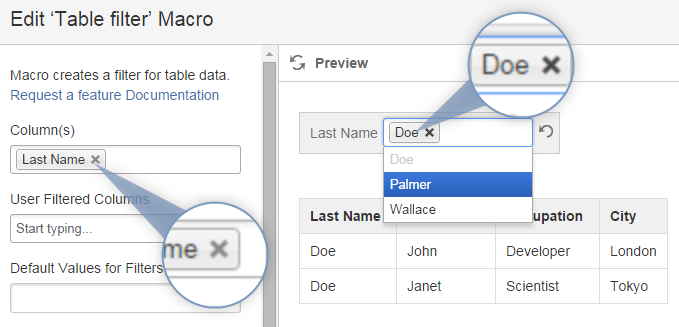
PNG File image2014-10-28 11:35:7.png |
69 kB |
Unknown User (ikornev) |
Oct 28, 2014 10:35 |
Oct 28, 2014 10:35 |
|
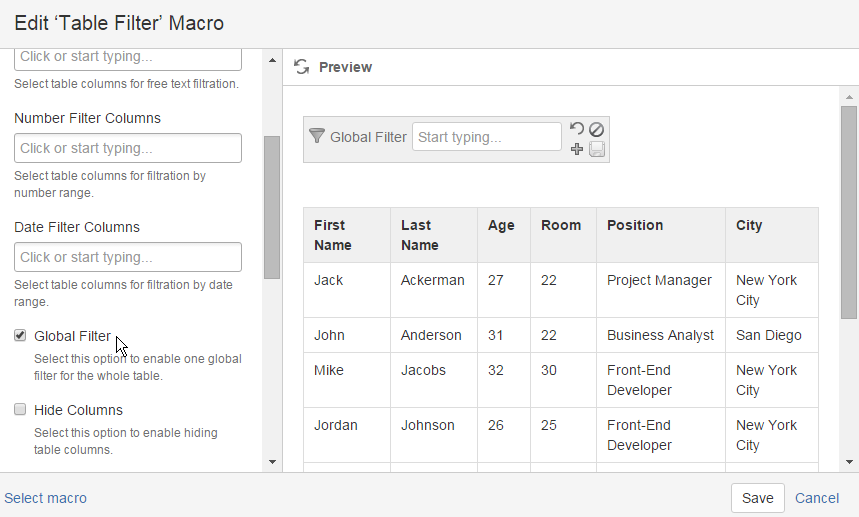
Page: Table Filter 2.0
|
|
PNG File image2018-4-27_15-34-22.png |
68 kB |
Vadim Rutkevich |
Apr 27, 2018 12:33 |
Apr 27, 2018 12:33 |
|
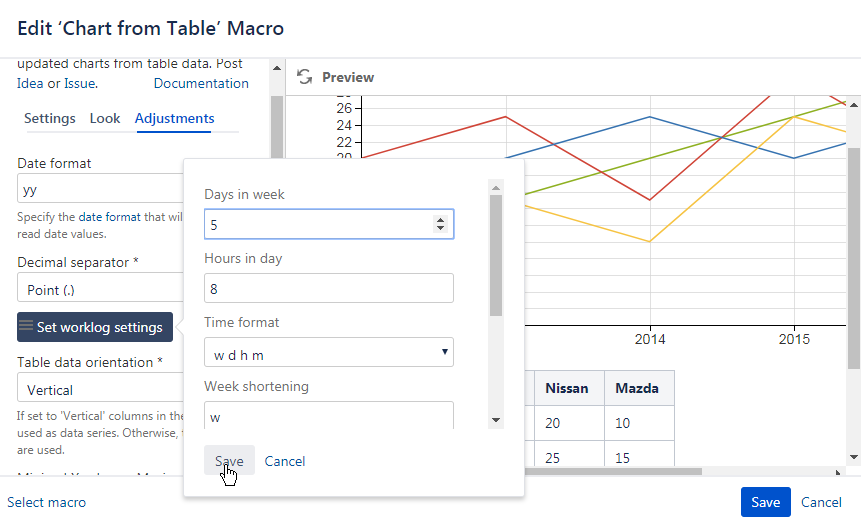
Page: How to use Chart from Table macro
|
|
PNG File image2015-10-12 15:12:41.png |
68 kB |
Vadim Rutkevich |
Oct 12, 2015 12:12 |
Oct 12, 2015 13:00 |
|
Page: Managing the Global FIlter
|
|
PNG File image2015-10-12 15:12:41.png |
68 kB |
Vadim Rutkevich |
Oct 12, 2015 13:45 |
Oct 12, 2015 13:56 |
|
Page: Managing Date Range Filters
|
|
PNG File image2015-10-12 15:12:41.png |
68 kB |
Vadim Rutkevich |
Nov 25, 2015 14:21 |
Nov 25, 2015 14:32 |
|
Page: Filtering Table in the Page Edit Mode
|
|
PNG File image2015-10-12 15:12:41.png |
68 kB |
Vadim Rutkevich |
Oct 12, 2015 14:01 |
Oct 12, 2015 14:05 |
|
Page: Managing Filters in the Page View Mode
|
|
PNG File image2015-10-12 15:12:41.png |
68 kB |
Vadim Rutkevich |
Oct 12, 2015 13:21 |
Oct 12, 2015 13:38 |
|
Page: Managing Number Range Filters
|
|
PNG File image2017-10-13_15-58-33.png |
68 kB |
Andrey Khaneev |
Nov 09, 2017 13:06 |
Nov 09, 2017 13:06 |
|
Page: Table Filter and Charts 11/09/2017
|