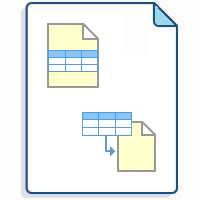
Pivot Table is one of the macros bundled in the Table Filter, Charts & Spreadsheets app. The macro allows you to summarize your table data and produce its aggregated view in the form of a pivot table. You can select the appropriate operation types as follows:
Add Pivot Table on the page
To add macros in view mode:
Click the More actions (⋯) menu in the top-right corner of the page.
Go to Apps → Use Table Filter App Macros.
In edit mode, macros are added just like any other Confluence macros:
Start entering /Pivot Table and select the macro.
On the editor pane, click Insert -> View more, find the macro and insert it on the page.
Make sure the source table - whether manually created or generated by another macro - is placed inside the macro body.
Find the answer to your question among the related FAQ
![]()
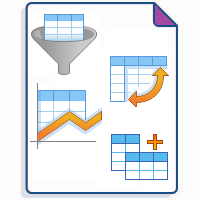
Build various charts based on your table
- Gantt chart type
- Pie and Donut chart types
- Bubble Pie chart type
- Column, Stacked Column, Bar, Stacked Bar chart types
- Line, Area, Stacked Area chart types
- Time Line, Time Area, Stacked Time Area chart types
- Radar (Spider) chart type
- Contiguity / Barcode chart (use case)
- Scatter plot (use case)
- Punchcard (use case)
- Comparison with native Confluence charts